We create a portrait of Central Asia that really works: the rules, methods, tips and analysis of errors
Anastasia Nikonorova, a business analyst at CityLife , shared with the Netology blog experience in creating a portrait of the target audience: with examples and analysis of the main mistakes.
It is considered that the key task of marketing is to attract and retain customers. And the main question that most marketing professionals face is not what tool should be chosen, but how to determine customer needs and correctly segment customers so that they can make an offer that they cannot refuse.

')
The main method for determining the target audience in modern marketing is segmentation. Segmentation is the division of customers into groups according to specified parameters.
First, to understand who your client is, what his needs are, and on the basis of this, correctly position the company.
Secondly, in order to build unique mechanics of interaction with each of the clients, to increase the conversion from supply to purchase and overall customer loyalty.
If you offer a client something that is potentially interesting to him, then his loyalty to the brand and the company increases regardless of whether he has made a purchase on this offer or not.
According to the Website builder , 44% of people who received targeted letters made at least one purchase of the proposals contained in them.
In most cases, the current customer base is segmented. But when creating a new business or lack of data collection, segmentation can be conducted based on surveys of existing or potential customers.
Many people perceive survey data only as a qualitative method of research, inferior to the analysis of consumer behavior. In fact, both types of analysis (based on surveys and purchase history) should be used equally in your business, since they have different goals.
Analysis of survey results is used to prioritize business objectives, create a vector of communication with consumers, or adjust the communication strategy. Analysis of the purchase history - to create advertising campaigns, build a mechanic loyalty program and gamification, change marketing focus.
For example, even a professional analyst (only if he has not additionally studied to be a psychologist) cannot understand better than the client himself what the client really needs.
Yes, the data on purchases can show that customers are leaving, that the average bill is declining, but to understand why this is happening and what consumers are missing is only possible with the help of feedback.
At the same time, it is important to bear in mind that during a survey, psychological aspects of behavior can introduce an error. First, since you are interested in the opinion of the person, he will try to thank you, giving answers that are potentially pleasing to you. Secondly, the wrong question or your own inclination to confirm your point of view can significantly affect the result.
In this article I tried to deviate from the standard methods of market segmentation, which are of little use in practice, and described only those of them that we ourselves use when creating strategies for loyalty programs.
Segmentation can be carried out even in Excel, for more complex analytics and large amounts of data, you can use machine learning methods, Python, R, Scala, Julia, which is gaining popularity, and others.
Dynamic indicators are those that are formed based on user behavior relative to other users: RFM-clustering, average check size, frequency of purchases, and so on. The boundaries of the segments formed on the basis of behavior, dynamic and change with each new purchase.
1. Determine the purpose of segmentation:
2. Choose one of the segmentation methods or create your own calculation algorithm.
3. Understand what data is needed:
4. To process and prepare data:
Above, I said that survey data, like quantitative data, can be segmented, but first they need to be processed:
Another question is how many clients to poll for accurate data. One of the options is to calculate the value using standard calculators for this purpose by entering the "sample size" in the search. But in fact, it is not so easy, such calculators allow you to find out the sample size for only one question, to which there will be only two possible answers. But in most cases, the questionnaire involves collecting more data.
There are standard statistical formulas that are used for calculations, but they assume that you already know what range the answers will be.
Obviously, the more people will be interviewed, the more accurate the result will be. The sample is actually weakly dependent on the general population, you may have 5 thousand clients or 5 million, but for the same number of parameters you will need to interview the same number of respondents.
Let's now look at several segmentation methodologies.
RFM analysis is an analysis of three indicators:
Often, when conducting RFM analysis, customers for each of the parameters are divided into groups at equal intervals from the minimum to maximum values. For example, the recency of the last purchase is up to 1 week, up to 2 weeks, up to 3 weeks.
We determine the boundaries of the clusters by calculating the sum and difference of the mean value with the standard deviation, thus, we get the largest number of users in the r2f2m2 cluster.
Indices 1 and 3 in the framework of the RFM-analysis of the characters for exceptional customers with different behaviors. So, the clients of the r1m3 cluster (for any value of f) are buyers who were previously profitable for the company, but stopped making purchases, the reason for which needs to be found out with the help of surveys.
The r3f3m1 cluster is potential for increasing LTV (monetary), as customers show loyalty, but make purchases of small amounts. In such a situation, customers should be offered a discount for purchases in the amount of N rubles, or recommend related products based on the history of their purchases.
With the help of RFM-segmentation, you can build a much more efficient policy of interaction with customers than sending letters to the entire client base. For this analysis, you will need the necessary indicators for customers, Excel and 30 minutes of work.
The purpose of cluster analysis is to unite clients into groups according to similar parameters. The most popular method of visualization analysis is a hierarchical tree, each successive level of which is the narrowing factors of difference.
We most often use one of the types of cluster analysis - k-means .
The analysis algorithm is as follows.
Assign the number of clusters k into which the clustering components will be divided. The number k is either set manually (it is convenient to determine the number of clusters on the basis of tree clustering), or is calculated as the optimal value using machine learning.
After that, k arbitrary points are assigned to cluster centers, and the distance between the designated centers and all other points inside the clustering is measured. The belonging of a point to a cluster is determined by determining the shortest distance to one of the k-centers.
The next step is the selection of new centers, their coordinates will be equal to the average value of the coordinates of points within the cluster. The points are again distributed over k-clusters, and the operation is repeated until the distances inside the clusters are repeated, which means that the optimal division has been achieved.
After the clusters are formed, it is necessary to understand which parameters of a point in the clusters are the most similar, that is, which of the features of user behavior are systematic. One of the fast-hacking lifehacks is to build boxsplots (boxes with mustaches), where the values are the indicators of each client for the selected indicator. They are immediately struck by the smallest range of sample values.
By example, we see that the cluster is formed due to the similarity of customers in the “Variability of Choices” and “Frequency of Participation in Shares” indices, which is a striking feature of behavior. This group is targeted for testing new application functionality, collecting feedback. The group is interested in promotions and the introduction of new products.
We carry out this analysis on the basis of a large amount of data collected, using the result for targeted actions. In practice, we found out that the result of segmentation requires testing, since the division into clusters can drastically differ from month to month.
Also, this type of segmentation can be used to analyze surveys. But since text data is difficult to convert to numerical indices, especially when it comes to thousands of respondents, we recommend asking questions in the “Rate the importance / quality / value… from 1 to 5” format.
Similarly, we conducted surveys of bank customers. Initially, the audience was divided into users of various bank products. For each product unique questions were formulated on the importance of the selection factors, where the respondent was asked to rate from 1 to 5 for each of the factors. Part of the obtained segmentation is presented below:
Debit Card Holders:
Legal entities regularly performing cash transactions:
Analysis of associative rules (market basket analysis) - an analysis that is used to find sustainable combinations of goods in purchases. There are many algorithms for calculating it, the first of which, AIS, was developed in 1993. For the analysis, a database of purchases is necessary, each purchase must have a unique identifier (often the check number appears in this role) and positions that are included in it.
What do companies that do not belong to the FMCG segment do in these cases? We propose to use and use in our own business instead of the check number a unique client id. Thus, we calculate stable patterns in the behavior of customers regarding the history of their purchases, on the basis of which we build a recommendation system.
For example, purchases on Aviasales made 3 thousand people, on Booking - 1 thousand. Customers who made purchases on both Aviasales and Booking - 500. The volume of the customer base is 5 thousand customers.
Based on these data, two indicators are calculated: confidence (confidence) and support (support) rules.
Support - the proportion of customers who have committed transactions with both partners from the total number of transactions, that is 10%.
Reliability (we also call it communication strength) is the share of customers who have made transactions with both partners, depending on the number of transactions of each of them individually.
Reliability, as you already understood, has two meanings, in our case for Booking it is equal to 50%, for Aviasales - 16.7%. This means that the customer is more likely to make a purchase on Booking and then makes a purchase on Aviasales than vice versa.
How to apply it in marketing? If we create a promotion for buyers, then it will promote Booking, since after that customers are more likely to make a purchase at Aviasales. We can also set up an automatic mailing: after making a purchase on Booking, the client will be sent a promotional code for the next purchase of Aviasales with a discount for a limited period. Another method of monetization can be the introduction of a combination of these two partners in a combo-set format, with the purchase of which the total cashback will be increased.
With all the availability and clarity of the methods and methods of segmentation of their own target audience, many marketers make mistakes when doing this work. About seven of them will be discussed below.
This, in my opinion, the biggest mistake that can be made during segmentation is to draw conclusions solely on the basis of the age and sex of consumers. It is rarely possible to find a correlation between demographic indicators and user behavior. The only relevant example was obtained by us in identifying patterns in the behavior of our own audience. We considered the ratio of clients making transactions by age and sex to the total number of clients of a given age and gender, the percentage was declining for women over 35 years old, the decline for men was not so significant. Based on this, it was decided to create training videos for making online purchases on Lamoda and Aliexpress.
In fact, often have to deal with this error. For one of our clients, the food retail chain, a colleague and I conducted an analytics training. Literally at first glance, I was introduced to the “Generation Y” and interviewed for what could attract me to a similar store and get me to start taking part in promotions. If my colleagues were based on my age and sex, then I’d probably be offered a promo with the heroes of popular TV shows. But then I returned home at a time when the stores of this format were closed, and in order to save time, I ordered the delivery of products to the house through the online store. Based on this, I had to offer ready-made sets of goods that I could pick up on my way home at one of the points of issue.
Data containing erroneous or critical values can lead to significant errors as a result of segmentation. For example, if you do not exclude outliers before conducting an RFM analysis, the borders of the clusters will be too extended. Thus, the number of clients in the r2f2m2 cluster will not correspond to reality, and you will not be able to select key segments for work.
Carrying out segmentation without taking into account external factors affecting customer behavior can lead to fragmented or even incorrect results. For example, it is impossible to analyze the aggregate data on residents of the capital and regions, since there is a difference in the standard of living and wages, a high average check in the region may be within the average for Moscow. Similarly, during the five years of data collection, you probably had a significantly adjusted assortment matrix, and the economic conditions also changed, indicating that it was impossible to represent them in the same array.
To make segmentation and think over the mechanics of interaction with each segment is not the whole work. It is necessary to monitor the reaction of customers, select the appropriate communication channels and test hypotheses.
We often create segmented newsletters and promotions on social networks. For example, empirically we found out that customers who did not make purchases from us for three months most often hid advertisements in social networks aimed at their return. But at the same time, it was quite effective for them to send emails with a promotional offer to extend the subscription fee.
Imagine that the analyst conducted a rather complicated cluster analysis and found a segment of clients - cat owners - on the principle of regular cat food purchases. He is happy and happy, goes with this insight to the marketing director, as a result the company sends a newsletter to these customers with a promotion for a new premium feed at a 50% discount. But as a result, the conversion to the link is from the letter below the expected one. This is due to the fact that when forming the list, the email analyst did not take into account the fact that he conducted the analysis according to data for 3 years, and 50% of customers did not make a purchase for more than a year.
In the first paragraph, I gave an example about an online grocery store - it was “Utkonos”. Living in Moscow, I was extremely loyal to him, I liked their range, convenient delivery time: they could deliver food even at 3 nights. Given my previous schedule, it was very helpful, I made orders at least once a month. But now I have been living in St. Petersburg for 4 months, and I’m still sending SMS messages from my beloved Utkonos, which delivers products only in Moscow, to me. The absence of orders for a period that is four times as long as my average interval does not bother them, they waste the budget on mailings, and I actually have no opportunity to make a repeat order.
Segmentation data, like any other, tends to become obsolete. And the speed of this depends on the characteristics of the business. For retail, for example, the maximum duration of segmentation relevance is a month. The most optimal solution is to set up an automatic update or create a BI dashboard to regularly monitor indicators that affect the segmentation result. If this is not possible, then the segmentation is regularly updated manually.
It is certainly important to understand who your customers are, but this is not the only application of segmentation. It is important to build communication with customers and overall marketing policies using data. Different segments should be sent different key messages, they are interested in different offers and products. This is one of the ways to significantly improve your business. Not using it, you lose competitive advantage.
Correctly identifying, segmenting and working with your target audience is an important skill of a modern marketing specialist. In this material, the goals and objectives of segmentation, methodologies and types of analysis, the main errors during segmentation were considered. Use this information, work professionally with your own customers, and the success of your business will not take long. Good luck!
Courses "Netology" on the topic:
Free classes and programs:
It is considered that the key task of marketing is to attract and retain customers. And the main question that most marketing professionals face is not what tool should be chosen, but how to determine customer needs and correctly segment customers so that they can make an offer that they cannot refuse.
')
The main method for determining the target audience in modern marketing is segmentation. Segmentation is the division of customers into groups according to specified parameters.
Why do you need to segment the audience?
First, to understand who your client is, what his needs are, and on the basis of this, correctly position the company.
Secondly, in order to build unique mechanics of interaction with each of the clients, to increase the conversion from supply to purchase and overall customer loyalty.
If you offer a client something that is potentially interesting to him, then his loyalty to the brand and the company increases regardless of whether he has made a purchase on this offer or not.
According to the Website builder , 44% of people who received targeted letters made at least one purchase of the proposals contained in them.
On average, segmentation increases the open rate by 14.69%, and the click rate by 60%.During the study, 52% of marketers surveyed said it was necessary to segment the database in email newsletters, since individual offers bring in 18 times more revenue than broadcast ones.
What data to segment
In most cases, the current customer base is segmented. But when creating a new business or lack of data collection, segmentation can be conducted based on surveys of existing or potential customers.
Many people perceive survey data only as a qualitative method of research, inferior to the analysis of consumer behavior. In fact, both types of analysis (based on surveys and purchase history) should be used equally in your business, since they have different goals.
Analysis of survey results is used to prioritize business objectives, create a vector of communication with consumers, or adjust the communication strategy. Analysis of the purchase history - to create advertising campaigns, build a mechanic loyalty program and gamification, change marketing focus.
For example, even a professional analyst (only if he has not additionally studied to be a psychologist) cannot understand better than the client himself what the client really needs.
Yes, the data on purchases can show that customers are leaving, that the average bill is declining, but to understand why this is happening and what consumers are missing is only possible with the help of feedback.
At the same time, it is important to bear in mind that during a survey, psychological aspects of behavior can introduce an error. First, since you are interested in the opinion of the person, he will try to thank you, giving answers that are potentially pleasing to you. Secondly, the wrong question or your own inclination to confirm your point of view can significantly affect the result.
Important Survey Principles
- Survey customers who already have experience using your product or a similar competitor product.
- Ask open-ended questions. For example, “How much would you pay for this product?” Instead of “Would you pay 100, 200 or 300 rubles?” Or “Would you pay 500 rubles for this product?”. Otherwise, the “anchor effect” is triggered and the person will be repelled by the indicated amount when responding.
- If the question relates to a client’s problem or pain, then ask how he solves it. If the answer is followed by "no way", then the priority of this problem is not as high as the interviewee describes.
- Avoid generalizations. Instead of the wording “How often do you use the service?” Use “How many times a month do you use the service?”.
- To confirm the positive position of the client, ask him to take a specific action here and now: subscribe to the group on social networks, pay for the product, leave contacts. If he is not ready to do this, then he is unlikely to actually buy the product in the future.
- Ask clarifying questions. If the client says that he often encounters the indicated problem, ask when he came across it the last time, after which the answer may change.
How to segment
In this article I tried to deviate from the standard methods of market segmentation, which are of little use in practice, and described only those of them that we ourselves use when creating strategies for loyalty programs.
Segmentation can be carried out even in Excel, for more complex analytics and large amounts of data, you can use machine learning methods, Python, R, Scala, Julia, which is gaining popularity, and others.
There are two major types of segmentation: based on static and dynamic data.Static data - the criteria for users who are independent of his actions, do not change or change rarely. Indicators of static segmentation include: gender, age, geographical data.
Dynamic indicators are those that are formed based on user behavior relative to other users: RFM-clustering, average check size, frequency of purchases, and so on. The boundaries of the segments formed on the basis of behavior, dynamic and change with each new purchase.
Step by Step Guide for Segmentation
1. Determine the purpose of segmentation:
- who will use the segmentation results;
- what they will be used for.
2. Choose one of the segmentation methods or create your own calculation algorithm.
3. Understand what data is needed:
- what part of the customer base will be used (active customers; customers making N purchases; buying a certain product; installing a mobile application; all customers);
- select a period;
- collect the indicators needed to calculate.
4. To process and prepare data:
- collect data in one consistent array, where one row is one observation, one column is one variable;
- check data for errors and clear them (remove empty or invalid values);
- remove emissions for each of the parameters:
- calculate the standard deviation. The fact of its significant difference from the mean indicates that there are outliers in the sample;
- calculate the median - the value located in the middle of the data set, ordered in ascending or descending order. If the number of members is odd, then it takes the value of the sum of two middle members divided by two;
- calculate the upper and lower boundaries of the quartile - values beyond which (above and below, respectively) is 25% of the values;
- all that lies above the sum (difference) of the upper (lower) border of the quartile and the interquartile distance multiplied by 1.5 is emissions.
Above, I said that survey data, like quantitative data, can be segmented, but first they need to be processed:
- check of the questionnaire: if you do not do the questionnaire personally, but outsource or send the questionnaire by email, then first of all you should check the quality of the filling and the absence of the missed answers;
- digitize: all questionnaires must be converted into electronic form to continue the analysis, then correct the errors, bring the answers to open questions to uniform wording;
- data cleansing - at this stage it is necessary to re-check the data for missing values, the output values are beyond the specified limits. Questionnaires with errors should be completely excluded from the analysis.
Another question is how many clients to poll for accurate data. One of the options is to calculate the value using standard calculators for this purpose by entering the "sample size" in the search. But in fact, it is not so easy, such calculators allow you to find out the sample size for only one question, to which there will be only two possible answers. But in most cases, the questionnaire involves collecting more data.
There are standard statistical formulas that are used for calculations, but they assume that you already know what range the answers will be.
Obviously, the more people will be interviewed, the more accurate the result will be. The sample is actually weakly dependent on the general population, you may have 5 thousand clients or 5 million, but for the same number of parameters you will need to interview the same number of respondents.
Let's now look at several segmentation methodologies.
RFM analysis
RFM analysis is an analysis of three indicators:
- Recency is an indicator of activity, calculated as the duration of the last action of the client (purchase, authorization in the personal account, opening an email distribution, etc.).
- Frequency - the number of purchases (other actions) of the client.
- Monetary - Lifetime value, the life value of a customer, is equal to the sum of his purchases or profits.
Often, when conducting RFM analysis, customers for each of the parameters are divided into groups at equal intervals from the minimum to maximum values. For example, the recency of the last purchase is up to 1 week, up to 2 weeks, up to 3 weeks.
We determine the boundaries of the clusters by calculating the sum and difference of the mean value with the standard deviation, thus, we get the largest number of users in the r2f2m2 cluster.
Indices 1 and 3 in the framework of the RFM-analysis of the characters for exceptional customers with different behaviors. So, the clients of the r1m3 cluster (for any value of f) are buyers who were previously profitable for the company, but stopped making purchases, the reason for which needs to be found out with the help of surveys.
The r3f3m1 cluster is potential for increasing LTV (monetary), as customers show loyalty, but make purchases of small amounts. In such a situation, customers should be offered a discount for purchases in the amount of N rubles, or recommend related products based on the history of their purchases.
With the help of RFM-segmentation, you can build a much more efficient policy of interaction with customers than sending letters to the entire client base. For this analysis, you will need the necessary indicators for customers, Excel and 30 minutes of work.
Cluster analysis
The purpose of cluster analysis is to unite clients into groups according to similar parameters. The most popular method of visualization analysis is a hierarchical tree, each successive level of which is the narrowing factors of difference.
We most often use one of the types of cluster analysis - k-means .
The analysis algorithm is as follows.
Assign the number of clusters k into which the clustering components will be divided. The number k is either set manually (it is convenient to determine the number of clusters on the basis of tree clustering), or is calculated as the optimal value using machine learning.
After that, k arbitrary points are assigned to cluster centers, and the distance between the designated centers and all other points inside the clustering is measured. The belonging of a point to a cluster is determined by determining the shortest distance to one of the k-centers.
The next step is the selection of new centers, their coordinates will be equal to the average value of the coordinates of points within the cluster. The points are again distributed over k-clusters, and the operation is repeated until the distances inside the clusters are repeated, which means that the optimal division has been achieved.
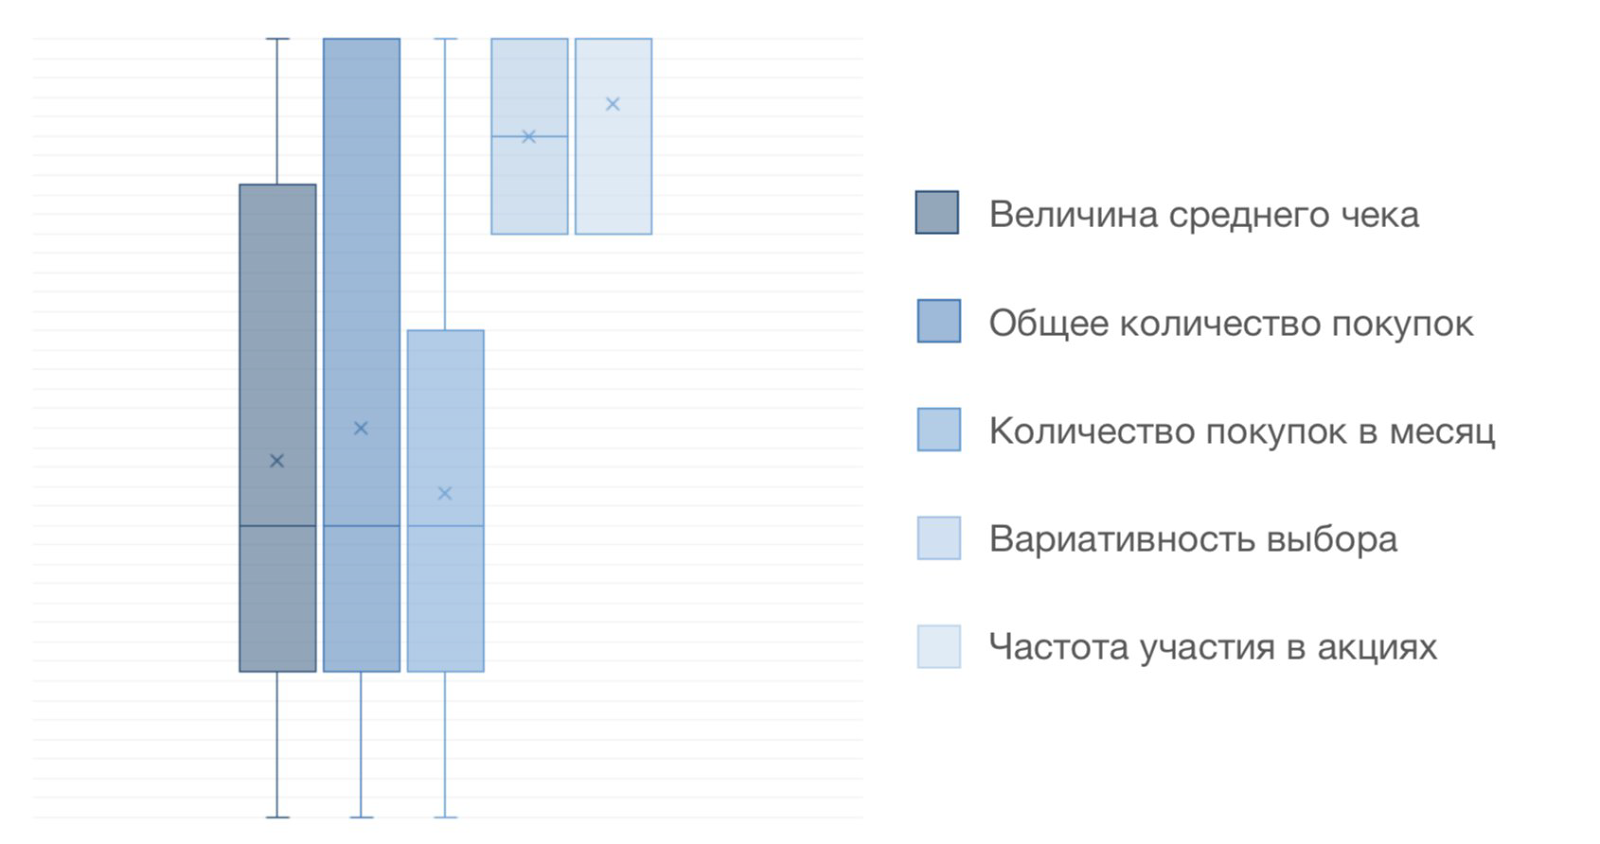
After the clusters are formed, it is necessary to understand which parameters of a point in the clusters are the most similar, that is, which of the features of user behavior are systematic. One of the fast-hacking lifehacks is to build boxsplots (boxes with mustaches), where the values are the indicators of each client for the selected indicator. They are immediately struck by the smallest range of sample values.
By example, we see that the cluster is formed due to the similarity of customers in the “Variability of Choices” and “Frequency of Participation in Shares” indices, which is a striking feature of behavior. This group is targeted for testing new application functionality, collecting feedback. The group is interested in promotions and the introduction of new products.
We carry out this analysis on the basis of a large amount of data collected, using the result for targeted actions. In practice, we found out that the result of segmentation requires testing, since the division into clusters can drastically differ from month to month.
Also, this type of segmentation can be used to analyze surveys. But since text data is difficult to convert to numerical indices, especially when it comes to thousands of respondents, we recommend asking questions in the “Rate the importance / quality / value… from 1 to 5” format.
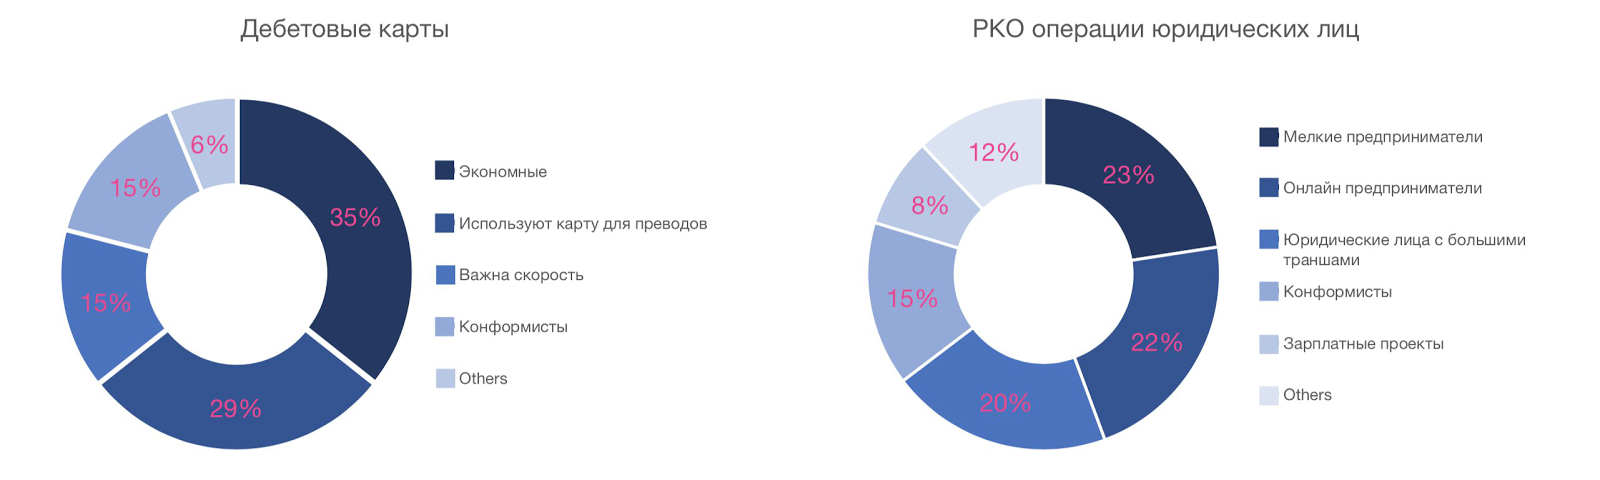
Similarly, we conducted surveys of bank customers. Initially, the audience was divided into users of various bank products. For each product unique questions were formulated on the importance of the selection factors, where the respondent was asked to rate from 1 to 5 for each of the factors. Part of the obtained segmentation is presented below:
Debit Card Holders:
- thrifty - the highest estimates were given to the factor “cost of annual service”;
- use a card for transfers - the size of the fee for transfers to cards of other banks is important;
- conformists - appreciated the importance of the factors “brand reputation” and “reviews” on 5 out of 5, “cost of service” - on 4.
Legal entities regularly performing cash transactions:
- small entrepreneurs - the main factors of choice are the "cost of opening an account", "ease of connection and use of Internet services of the bank", "favorable rates for services";
- legal entities with large tranches - the established limits for cash transactions and the reliability and reputation of the bank are most important.
Association rule analysis
Analysis of associative rules (market basket analysis) - an analysis that is used to find sustainable combinations of goods in purchases. There are many algorithms for calculating it, the first of which, AIS, was developed in 1993. For the analysis, a database of purchases is necessary, each purchase must have a unique identifier (often the check number appears in this role) and positions that are included in it.
What do companies that do not belong to the FMCG segment do in these cases? We propose to use and use in our own business instead of the check number a unique client id. Thus, we calculate stable patterns in the behavior of customers regarding the history of their purchases, on the basis of which we build a recommendation system.
For example, purchases on Aviasales made 3 thousand people, on Booking - 1 thousand. Customers who made purchases on both Aviasales and Booking - 500. The volume of the customer base is 5 thousand customers.
Based on these data, two indicators are calculated: confidence (confidence) and support (support) rules.
Support - the proportion of customers who have committed transactions with both partners from the total number of transactions, that is 10%.
Reliability (we also call it communication strength) is the share of customers who have made transactions with both partners, depending on the number of transactions of each of them individually.
Reliability, as you already understood, has two meanings, in our case for Booking it is equal to 50%, for Aviasales - 16.7%. This means that the customer is more likely to make a purchase on Booking and then makes a purchase on Aviasales than vice versa.
How to apply it in marketing? If we create a promotion for buyers, then it will promote Booking, since after that customers are more likely to make a purchase at Aviasales. We can also set up an automatic mailing: after making a purchase on Booking, the client will be sent a promotional code for the next purchase of Aviasales with a discount for a limited period. Another method of monetization can be the introduction of a combination of these two partners in a combo-set format, with the purchase of which the total cashback will be increased.
Major errors in audience segmentation
With all the availability and clarity of the methods and methods of segmentation of their own target audience, many marketers make mistakes when doing this work. About seven of them will be discussed below.
Based only on the age and gender characteristics of customers
This, in my opinion, the biggest mistake that can be made during segmentation is to draw conclusions solely on the basis of the age and sex of consumers. It is rarely possible to find a correlation between demographic indicators and user behavior. The only relevant example was obtained by us in identifying patterns in the behavior of our own audience. We considered the ratio of clients making transactions by age and sex to the total number of clients of a given age and gender, the percentage was declining for women over 35 years old, the decline for men was not so significant. Based on this, it was decided to create training videos for making online purchases on Lamoda and Aliexpress.
In fact, often have to deal with this error. For one of our clients, the food retail chain, a colleague and I conducted an analytics training. Literally at first glance, I was introduced to the “Generation Y” and interviewed for what could attract me to a similar store and get me to start taking part in promotions. If my colleagues were based on my age and sex, then I’d probably be offered a promo with the heroes of popular TV shows. But then I returned home at a time when the stores of this format were closed, and in order to save time, I ordered the delivery of products to the house through the online store. Based on this, I had to offer ready-made sets of goods that I could pick up on my way home at one of the points of issue.
Do not process data
Data containing erroneous or critical values can lead to significant errors as a result of segmentation. For example, if you do not exclude outliers before conducting an RFM analysis, the borders of the clusters will be too extended. Thus, the number of clients in the r2f2m2 cluster will not correspond to reality, and you will not be able to select key segments for work.
Do not limit the period and geography
Carrying out segmentation without taking into account external factors affecting customer behavior can lead to fragmented or even incorrect results. For example, it is impossible to analyze the aggregate data on residents of the capital and regions, since there is a difference in the standard of living and wages, a high average check in the region may be within the average for Moscow. Similarly, during the five years of data collection, you probably had a significantly adjusted assortment matrix, and the economic conditions also changed, indicating that it was impossible to represent them in the same array.
Do not test
To make segmentation and think over the mechanics of interaction with each segment is not the whole work. It is necessary to monitor the reaction of customers, select the appropriate communication channels and test hypotheses.
We often create segmented newsletters and promotions on social networks. For example, empirically we found out that customers who did not make purchases from us for three months most often hid advertisements in social networks aimed at their return. But at the same time, it was quite effective for them to send emails with a promotional offer to extend the subscription fee.
Do not consider customer activity
Imagine that the analyst conducted a rather complicated cluster analysis and found a segment of clients - cat owners - on the principle of regular cat food purchases. He is happy and happy, goes with this insight to the marketing director, as a result the company sends a newsletter to these customers with a promotion for a new premium feed at a 50% discount. But as a result, the conversion to the link is from the letter below the expected one. This is due to the fact that when forming the list, the email analyst did not take into account the fact that he conducted the analysis according to data for 3 years, and 50% of customers did not make a purchase for more than a year.
In the first paragraph, I gave an example about an online grocery store - it was “Utkonos”. Living in Moscow, I was extremely loyal to him, I liked their range, convenient delivery time: they could deliver food even at 3 nights. Given my previous schedule, it was very helpful, I made orders at least once a month. But now I have been living in St. Petersburg for 4 months, and I’m still sending SMS messages from my beloved Utkonos, which delivers products only in Moscow, to me. The absence of orders for a period that is four times as long as my average interval does not bother them, they waste the budget on mailings, and I actually have no opportunity to make a repeat order.
Do not update segmentation
Segmentation data, like any other, tends to become obsolete. And the speed of this depends on the characteristics of the business. For retail, for example, the maximum duration of segmentation relevance is a month. The most optimal solution is to set up an automatic update or create a BI dashboard to regularly monitor indicators that affect the segmentation result. If this is not possible, then the segmentation is regularly updated manually.
Use segmentation only for the purpose of determining CA
It is certainly important to understand who your customers are, but this is not the only application of segmentation. It is important to build communication with customers and overall marketing policies using data. Different segments should be sent different key messages, they are interested in different offers and products. This is one of the ways to significantly improve your business. Not using it, you lose competitive advantage.
Correctly identifying, segmenting and working with your target audience is an important skill of a modern marketing specialist. In this material, the goals and objectives of segmentation, methodologies and types of analysis, the main errors during segmentation were considered. Use this information, work professionally with your own customers, and the success of your business will not take long. Good luck!
From the Editor
Courses "Netology" on the topic:
- Full-time course " Director of online marketing ";
- full-time course " Data Scientist ";
- online marketing program;
- the online program “ Web Analytics: What the Internet Specialist Should Know ”;
- online program " Excel: data management tools for marketers and analysts ";
- online program " Big Data: Basics of working with large data arrays. "
Free classes and programs:
- Google AdWords: Exam Preparation ;
- the program “ Yandex.Direct: preparation for certification ”;
- the session “ Technology of Forming a Modern Brand ” - February 21, 2017;
- Lesson " How to use Big Data for your business " - January 17, 2017.
Source: https://habr.com/ru/post/346702/
All Articles