Selfish problems: traffic jams and the Braes paradox

Building wider roads may worsen the traffic situation. Usually this counterintuitive and counterproductive result is explained as follows: the greater the roads, the larger the malls they attract, which in turn attracts more cars. But this is not the whole story. In the 1960s, Dietrich Braes discovered a theoretical road configuration in which the construction of a new connecting road can slow everyone down even if the number of cars remains constant. Conversely, the closure of one road in the Braes network will allow everyone to get home faster. Such a phenomenon is so strange that it deserves its own definition - “Paradox Braes”.
A few years ago, Joel Cohen told me that the Braes paradox could be a good topic for my column in Computing Science. I began to doubt. Quite a few discussions of this paradox have already been published, including Cohen’s stunning articles, as well as a book by Tim Rafgarden (a review of which I wrote for American Scientist ). I did not think that I could add something new to the discussion.
Recently, however, I began to consider the task of visualizing the Braes paradox — presenting it in such a way that we could observe individual cars traveling through the road network, and not just calculate average speeds and travel time. The ability to experiment with a model — press the levers and buttons, try different routing algorithms — can lead to a clearer understanding of why well-informed and self-interested drivers can choose the route that will slow everyone down as a result.
Now I have a working model of something resembling the Braes paradox, written in JavaScript. I recommend to try to ride on it . There is also an accompanying column “Computing Science” in American Scientist , which is posted on the magazine's website in HTML and PDF . If you are interested in the source code, then it is on Github . Here I want to tell a little about the implementation of the model and what it taught me.
')
Adaptation of the mathematical model of Braes to a more mechanistic and visual environment turned out to be more difficult than I expected. The original wording is rather abstract and not very physical; it is closer to graph theory than to the design of highways. The diagrams below show wide blue roads labeled A and B never to be congested; Regardless of the traffic they pass, the time of movement on them is always one hour. On narrow red roads a and b , the travel time is zero when they are empty, but the traffic increases with increasing load; if all the cars are assembled on the same red road, the driving time on it also becomes equal to one hour. The golden route X magically provides instant transportation to any number of cars.
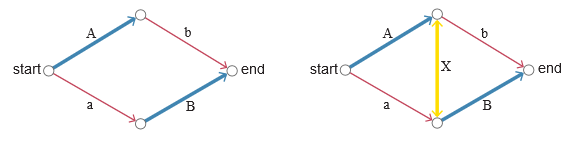
The presence of a paradox depends on the existence of road X. Without a gold connection (left circuit), traffic is evenly distributed between routes Ab and aB , and all cars spend 90 minutes for the entire trip. When opening connection X (right scheme), all drivers prefer the aXb route, and everyone spends a full two hours on the road.
A necessary assumption for this paradox is that everyone strives for selfish construction of the route, choosing the path that provides the fastest movement, and ignoring all other factors, except the time of movement. Ironically, by persisting that no one else would have a shorter ride, drivers create a tight traffic jam on route aXb , while AXB remains empty. Why? If any driver decides to move to AXB , his absence will slightly reduce the load on aXb , which will give this route a slight speed advantage. Following selfish aspirations, the driver who has shifted to another path must return to aXb . It turns out a stalemate.
Cars moving at infinite speed and roads with infinite carrying capacity are quite appropriate in a mathematical model, but cause problems in a simulation that is supposed to simulate real traffic on a highway. In search of a more realistic model, I came to the location of roads shown below, inspired by the scheme from Claude M. Pincin's 1997 article (Braess Paradox: the maximum penalty in a minimal critical network. Transportation Research A 31 (5): 379–388).
The topology of the circuit is the same as in the original Braes network, but the geometry is different, and therefore the relationship between overflow and speed is also different. The goal is still to get from start to finish or from Origin to Destination . Segments of roads A and B are still wide and not subject to traffic jams. Roads a and b are shorter and shorter, but narrower at the same time. With zero traffic, the speed of the machine on a and b is the same as on A and B , but with increasing load the speed drops. The analogue of the “golden road” is a short bridge in the center of the map, possessing the same speed properties as A with B. In the original configuration, the bridge is locked, but it can be opened by clicking the mouse. In the screenshot of the working model shown above, the bridge is open and it is moving.
Cars, represented by colored dots, enter the system at the Origin point. At the time of entry, each machine chooses one of the possible routes. If the bridge is closed, there are only two options: Ab and aB . When the bridge is open, drivers can also choose a short ab road or a longer AB . Then the cars move along the selected routes, obeying the speed limits on each segment, until they reach the Destination point.
This scheme differs in some important ways from the original Braes formulation. Does it show a paradox? In other words, is driving time longer when the bridge is open and drivers can follow ab and AB ? The answer for a wide range of parameter values is “yes”, and this can be seen from the following results:
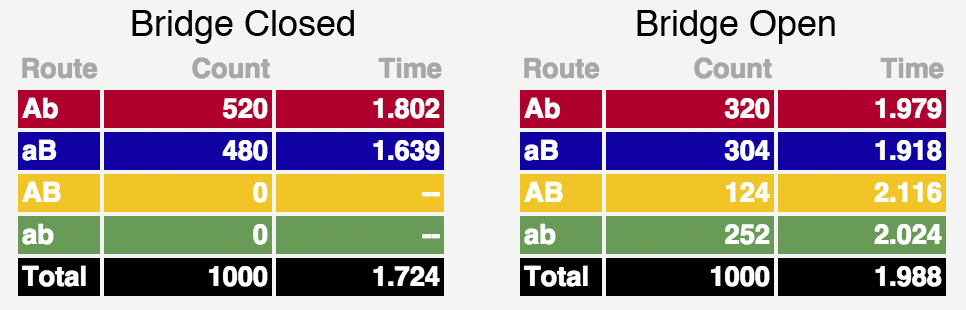
The tables show the number of cars that chose each of the routes and the average time they spent on the road. (Time is measured in units of the fastest possible trip: the shortest way is ab with zero traffic.) Notice that opening the bridge slowed down the speed on all four routes. Even though the Ab and aB routes had 37% less traffic, the vehicles on these routes needed 9-15% more time to complete the trip. The ab and ab routes were even slower.
But the numbers do not reveal the situation completely - this was the first thing I realized after running the simulation. In the case of a closed bridge, when the total traffic is divided into two approximately equal flows, it can be assumed that new cars alternately choose Ab or aB , so that the system reaches a statistically equilibrium state with an equal number of cars on each of the two routes at any given time. But something completely different happens! It is best to verify this by running a simulation, but the graph below also gives us a general understanding of the model.
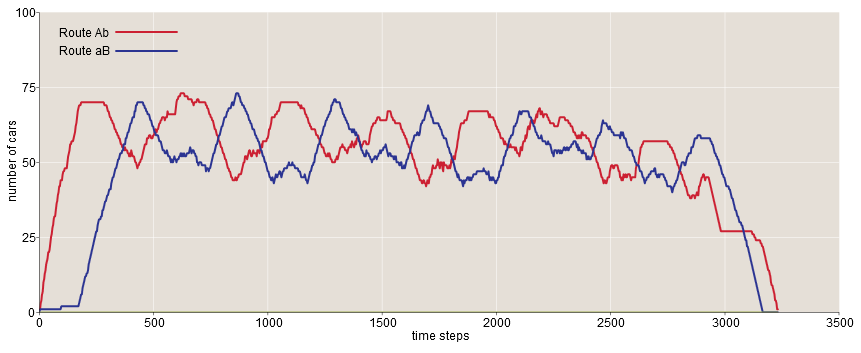
Instead of moving to an equilibrium state, the system oscillates with a period of approximately 500 time periods, which is approximately equal to half the time it takes for an average car to move from Origin to Destination . The two curves are phase shifted almost exactly 180 degrees.
It is easy to understand where such oscillations come from. When each vehicle enters the road network, it selects a route with the shortest expected travel time based on the current status. The main decisive factor in the expected travel time is the number of cars occupying segments a and b , on which the speed decreases when the roads are filled. But when cars choose a less popular route, they also increase the occupancy of this route, which makes it less desirable for the cars following them. In addition, there is a significant delay on the Ab route before the vehicles reach the stretch that is affected by overflow. Delay and network asymmetry creates instability — a feedback loop in which outliers and over-correction are inevitable.
When the bridge is open, the pattern becomes more complex, but the vibrations are still very noticeable:
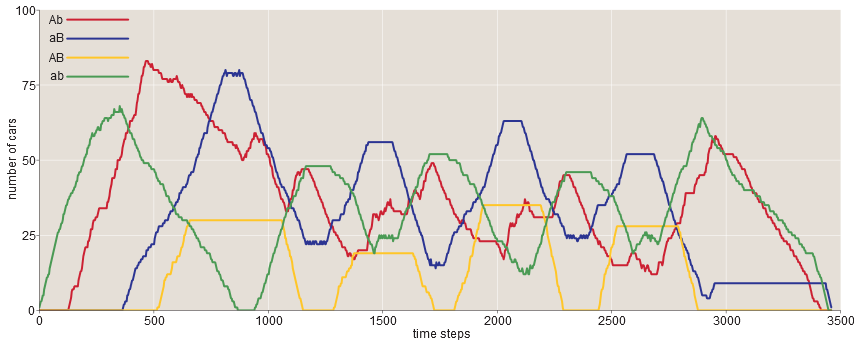
It seems that there are two alternating phases - in one Ab and ab dominate (in this color scheme - red-green Christmas phase), in the other ab and AB (yellow-green "boy scout" phase) win. The period of the waves is less regular, but mostly it is longer.
I am not the first to observe such vibrations; for example, they are mentioned by Daniel Bush and colleagues in an article describing a simulation of Braesian-like road networks in NetLogo . However, in general, such fluctuations and instabilities are given little attention in the literature.
The asymmetry of the circuit is very important for creating both oscillations and paradoxical deceleration when opening the central junction. You can verify this yourself by running a symmetrical version of the model . It turns out to be pretty boring.
One more bug / feature of dynamic model deserves comment. In the original Braes network, connections A and B have unlimited capacity; in fact, the model promises that the travel time of these roads will be constant, regardless of the traffic. In a dynamic model with discrete machines with non-zero dimensions, this promise is hard to keep. Suppose cars follow the route Ab and segment b is completely clogged. At the junction point, where A goes to b , the cars have no place to go, so they come back to segment A , which, because of this, cannot guarantee a constant speed.
When implementing a dynamic model, I discovered that there are many possible solutions in the choice of which the mathematical formulation of the original Braes system will not help me much. One of them was the problem of "backward penetration of the queue." To allow cars to accumulate on the road or give them invisible buffers in which they can safely wait for their turn to continue the journey? What about the cars that appear in the start node when there is no room for them on the roads? Do I have to put them in a queue, throw them away, allow them to block cars heading for another road? Another slippery point concerns priorities and honesty. Two nodes near the middle of the road circuit have two entrances and two exits. If there are cars in both queues at the entrance, waiting for passage through the node, which one will move first? If you do not pay attention to the choice of strategy for handling such traffic jams, then one route will be permanently blocked by another.
After studying the code in JavaScript, you can understand what solutions I chose. I will not argue that my answers are completely correct. But more importantly, after a lot of experimentation and research on alternative solutions, I found out that most of the details are not so important. The Braes effect is quite stable, it manifests itself in many versions of the model with slightly different assumptions and algorithms. Such stability tells us that it is worth looking more closely at the real tracks for evidence of paradoxical traffic patterns.
Source: https://habr.com/ru/post/346574/
All Articles