Analytics Guide for Startup Founder
You need an analyst.
I am absolutely sure of this, because today everyone needs an analyst. Not only the product team, not only marketing or finance, but also sales, delivery, today every startup needs an analyst . Analytics helps to make all decisions, from strategic to tactical, both to managers and ordinary employees.
This is a post on how to create analytics in your organization. It is not about what metrics to track (many good posts have already been written about this), but about how to make your business generate them. In practice, it turns out that the question of implementation is how can I build a business that extracts data for making decisions? - It is much more difficult to answer.
And this answer changes all the time. The ecosystem of analytics is developing very quickly, and the options that are at your disposal have changed significantly over the past 2 years. This post reflects the recommendations and experience of using data technology in 2017.
First of all: Why should you listen to me?
I have worked in analytics for almost twenty years. I saw a lot of successful cases, but much more was unsuccessful. At the beginning of my career, I introduced an outdated BI for enterprises (eh) . From 2009-2010, I built the first analytics in Squarespace and picked up a big round with this data. Then I became the operations director at Argyle Social , a startup analyzing social networks, and then vice president of marketing at RJMetrics , the leading BI platform for startups.
Now I’m helping startup managers implement analytics as CEO and founder of Fishtown Analytics . At Fishtown, we start working with companies after they pick up Round A, and help them build their analytics as they grow. To date, we have gone through a process that I will describe in this article with more than a dozen companies, including Casper , SeatGeek, and Code Climate .
I will explain step by step how to do analytics at each stage of your startup. My recommendations for each stage will help answer the question: “What is the absolute minimum that I can do without?” . We are not here to build castles in the air; we need the cheapest solutions.
Let's start.
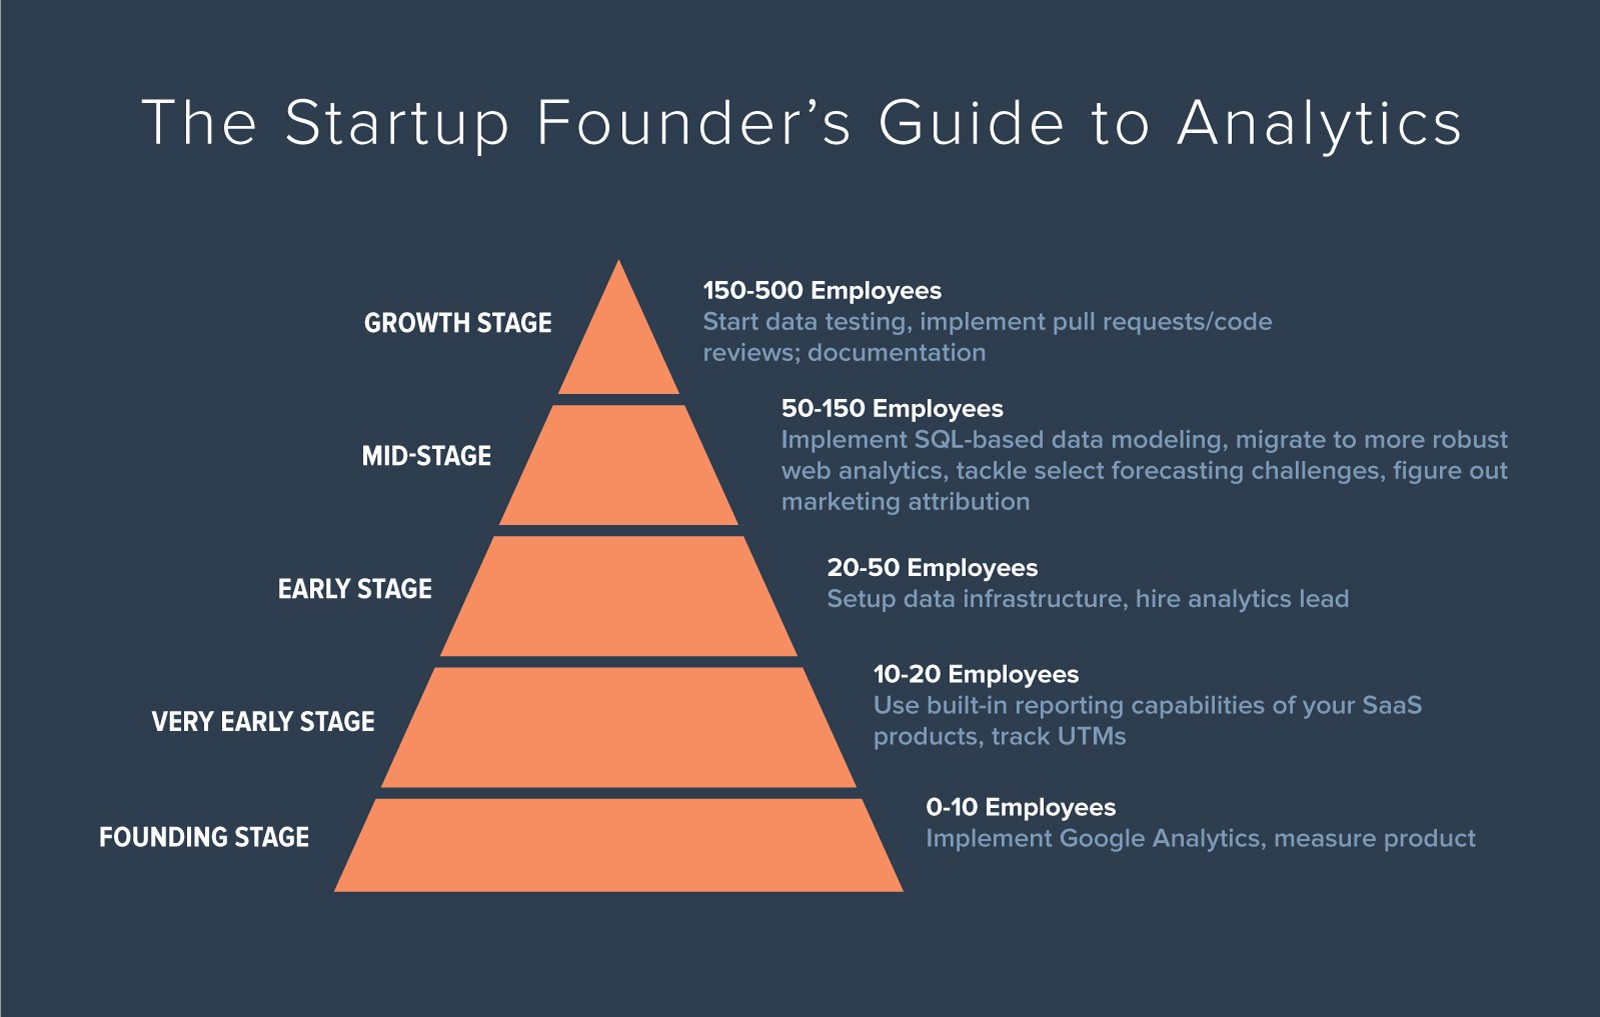
Stage of foundation
(0 to 10 employees)
At this stage, you have no resources and no time. There are a million things that you could measure, but you are so immersed in the details of your business that, in general, you can make good decisions based on instinct. The only thing that you still have to measure is your product, because it is the product indicators that will help you to quickly iterate in this critical phase. Everything else goes to the background.
What to do
- Install Google Analytics on your site using the Google Tag Manager . The data will not be perfect without additional work, but now is not the time to worry about it.
- If you have a business in the field of e-commerce, then you still need to make sure that your data in Google Analytics is all right. GA can do a great job of tracking your e-commerce events all the way from the visitor to the purchase, so take the time to set it up correctly.
- If you are developing software, you need to keep track of user events. No matter which tool you use, Mixpanel and Heap are very similar and both are good. At this point, I wouldn't really think about which events to monitor: just use the AutoTrack mode in Mixpanel or the default settings in Heap. When you realize that you need any events, you will find that they are already being tracked. This approach does not scale well, but for now it will do.
- Keep your financial statements in Quickbooks. Predict do in Excel. If you have a subscription business, use Baremetrics for subscription metrics. If you are an e-commerce business, use your trading platform to calculate income. Do not get carried away.
If you are not technically savvy, you may need a programmer who can help with GA and event tracking. All this setup will not take more than two hours, including reading documents. Spend on this time allocated for the development, it is worth it.
What not to do
Nothing that is listed above. Do not let anyone sell you a data warehouse, BI platform, a large consulting project or ... well, you understand. Stay focused. When you start building analytics, there are additional costs. Data changes all the time. Changing business logic. Stepping on this track, you will not be able to pause your analytical project. Set aside a large investment for later.
There will be many questions that you simply can not answer. This is normal (for now).
Very early stage
(10 to 20 people)
You slightly increase your team. These people need data to do their jobs. They may not be data experts, so you need to make sure that they are doing basic things correctly.
What to do
- You probably hired marketers. Make sure that they are responsible for GA. Make them responsible for the purity of the data displayed in it. Let them affix UTM tags to every damn link they create. Let make sure your subdomains are not tracked twice . Your marketers can say that they "do not rummage in GA." Do not listen to them. There is enough information about GA on the Internet, so if they are smart and motivated, they can learn and understand this. If they can't figure it out, fire them off and find someone else (seriously).
- If you have a sales department and there is CRM, use the built-in reporting. Make sure your people know how to use it. You should be able to calculate basic things, such as sales performance and conversion rates for sales funnel steps. Salesforce can do this out of the box. Do not export data to Excel, generate reports in their (terrible) report builder. Even if now you are uncomfortable, it will save you a lot of time in the coming months.
- You probably have several support people. Most support desk systems do not have good reporting, so choose such KPIs that you can easily measure in their interface.
- Make sure you measure the NPS. Use Wootric or Delighted .
What not to do
It's too early for data storage and SQL-based analytics - it just takes too much time. You need to spend all your time on business, not analytics , and the easiest way to do this is to use the built-in reports of various SaaS products with which you are already working. In addition, you do not need to hire a full-time analyst. Now there are more important things to spend your limited funds on.
Early stage
(20 to 50 employees)
It is here that everything becomes interesting, and the changes over the past two years are obvious. As soon as you raise your round A and you have 20+ employees, you will have new opportunities.
These capabilities are due to one thing: technology analytics is rapidly improving . Infrastructure of this kind, as now, was previously only available to large companies. Its benefits? More reliable performance, greater flexibility and a more suitable platform for future growth .
This is the most difficult and most important stage: promising if you do everything right, but painful if wrong.
What to do
- Configure the data infrastructure. This means choosing a data warehouse, ETL and BI tools. As a data warehouse, consider Snowflake and Redshift (I prefer to work with Snowflake if you have a choice). As an ETL tool, take Stitch 1 or Fivetran . As for BI, look at Mode and Looker 2 . There are many, many products in this area; these six are those to which we return again and again with our clients.
- Take a strong analyst leader. On the way, you will need a whole team of analytics experts: engineers, analysts, data scientists ... But for now, you can afford (no more than) one person per staff. You need to find that special person who will benefit on the first day, but who will also be able to hire a team around you as you grow. This person is hard to find - take the time to search for him. Often these people have experience in consulting or finance, and they often have an MBA. Although this person should be ready to roll up his sleeves and mess around, focus on hiring someone who can think about data and your business strategically: he will become an essential part of your analytical puzzle over the years.
- Consider hiring a consultant. While it’s great that you’ve found the analyst’s manager, this person will not have the experience necessary to combine all the components of your technology stack or to solve all the analytics problems you will encounter in your business. Mistakes made at this critical stage will entail serious costs both in time and money as you grow, so it is important to lay a solid foundation . To do this, most startups today prefer to work with consultants to help them set up the infrastructure, and then build a team around it.
What not to do
- If machine learning is not the main part of your product, do not hire a data scientist yet. To create your analytical team, you need a wagon, not a narrow specialist.
- For God's sake, do not write your own ETL . You will spend a lot of time developing it. Buy ready-made solutions from Stitch or Fivetran.
- Do not use any other BI tool other than the two mentioned above. Otherwise it will turn you into a big waste.
- Do not try to use a more traditional database, such as Postgres, as your data store. It is not much cheaper, and you will spend a lot of time to migrate from it later, when its possibilities are exhausted. Postgres does not scale as well as a real data store.
Middle stage
(50 to 150 people)
This stage is potentially the most difficult. You still have a relatively small team and few resources, but you will be asked to provide increasingly sophisticated and diverse analytics for your business, and your work can directly affect the success or failure of the company as a whole. Nobody puts pressure on you.
Here it is important to move forward, making sure that you continue to lay the foundation for the future stages of your growth. The decisions you make at this stage can make you crash right into a brick wall if you don’t think about the future.
What to do
- Implement a robust SQL-based data modeling process. Your data models serve as the core business logic for your analytics and should be used in all cases, from BI to data science. Make sure that your process allows all users to make changes to data modeling scripts, is versioned and runs in a transparent environment . We support an open source product called dbt , which is used by many companies in the growth stage precisely for this.
- Migrate from existing web analytics and event tracking systems to Snowplow Analytics . Snowplow does everything that paid tools do, but it is an open source product. You can either host it yourself (and just pay the costs for your EC2 copies), or pay for hosting the event collector in Snowplow or Fivetran. If you do not make the transition at this stage, you will not be able to collect much more detailed data, and prepare for really huge bills from Segment, Heap or Mixpanel in the near future. When you pass this stage, paid tools can easily charge you $ 10,000 a month.
- Develop your team thoughtfully . The core of your team should always be business intelligence: people who are experts in SQL and your BI tool, and spend their time working with business users to help them get data. It is incredibly important to find out what the profile of these people is, how to train and equip them. You should also hire your first data scientist at this stage. It is important to gather your data infrastructure and core analytics team before hiring experienced (and expensive) talents in data science, but at some point you will need to add these skills.
- Begin to selectively solve some forecasting problems . Forecasting is more difficult than just calculating quantities and amounts, but there are several key areas that it makes sense to begin to dive into. If you are working in SaaS, you should work on the outflow prediction model. If you are an e-commerce business, you absolutely must work on a demand forecasting model. These models may not be super complex, but they will be a big improvement over random numbers in the Excel spreadsheet that someone from the finance department has built.
- Spend time and effort to deal with marketing attribution . You can write a separate post about this, but suffice it to say that you simply cannot entrust this critical business task to a third party.
What not to do
It's easy to get carried away and start investing in a powerful data infrastructure. Do not do this. At this stage, major infrastructure investments are still expensive entertainment. Here are some tips on how to stay flexible:
- Push hard SQL and your data warehouse. At this point, you can handle anything using the computing power of your data warehouse. Buy as much storage capacity as you need — paying for servers is much cheaper than paying for people.
- Add Jupyter Notebooks for data science tasks. If the data was previously aggregated in your repository, you do not need to do the processing in a Spark or Hadoop cluster.
- Find inexpensive ways to make ETL data for which there are no ready-made integrations. This is one of the things we love Singer for . 3
Avoiding the cost of monkey work, you will focus on solving real business problems.
Stage of growth
(150 to 500 employees)
This stage is associated with the creation of analytical processes that are scaled. You need to balance getting the answers you need today with the introduction of analytical methods that will scale as your team continues to grow.
By the time you have 150 employees, probably only a small team (3-6 people) will be engaged exclusively in analytics. By the time you have 500 employees, there can easily be 30 more. 3-6 analysts can act rather haphazardly, sharing knowledge (and code) in an informal way. By the time you have 8+ analysts, the process will begin to fall apart very quickly.
If you do not cope with this transition, you will actually work worse and worse as your team grows : you will need more time to get useful insights, and your answers will be of lower quality. It’s just a non-linear increase in complexity: you will have more data and more analysts working with them. To deal with this, you need processes for reliable collaboration.
What to do
- Implement data testing . At the moment, you have data coming into your repository from at least a dozen sources, and you need a process to ensure that the data loaded continues to meet the requirements set for them: uniqueness, foreign key relationships, non-zero fields, custom business logic . If you do not have a robust automated process that verifies this history, the quality of your analysis will continue to deteriorate, and you will not know why. We use our dbt test functionality with our clients.
- Use pull requests and code review. Your analytic code is an asset, just like the code of your site and application. Creating a high-quality code requires serious version control. Add each member of your team to git, teach them to use branches, and disable threads in master. All code sent to production must go through a pull request with a mandatory review from another team member. four
- Take the documentation seriously . Your company has a complex data infrastructure. The only way to effectively manage your knowledge about it and share it with your team is to spend time and energy on documenting it. This will add some overhead, but if you don’t make this investment, you will find that your analysts spend more time figuring out where to get the right data or how to use it than on the analyst itself. Airbnb did a great job in this area .
- Consider the structure of your analytical team. There are two basic models for structuring an analytical team: centralized and embedded. There is no clear right answer, but this decision will be crucial for how you bring the analyst to your growing organization. Karl Anderson describes the compromises well in his book “ Creating a Data-Driven Organization ”. five
What not to do
Do not accept excuses. To do analytics at this level is hard work, and this requires a talented and motivated team that constantly comes up with something new and improves. Code review takes time and energy. Analysts are not used to checking their code. And documentation is hard work. You will find resistance to these practices, especially among the old members of your team who remember the “good old days”. But as complexity increases, you need to develop your processes in order to adapt to it.
These processes actually make analytics simpler, faster and more reliable, but their implementation resembles pulling teeth out. If you are serious about analytics scaling, you will move forward.
You are a pioneer
I came to each of these recommendations after several years of independent work in companies, and then scaling up this approach as a consultant. The opportunity to work with a number of similar clients made it perfectly clear to me how rarely companies perform such work well .
If you take all the recommendations in this post, you will literally be one of the most effective analytics organizations in the world . A good competitive advantage.
From translator
It is a pity that I stumbled upon this post just now, when Tristan mentioned it in his absolutely wonderful weekly newsletter on analytics and data science (subscribe urgently, he selects the most juicy of recent articles and posts on the topic).
For the last 16 months, I actually spend in Skyeng just the changes that are described here. When I joined the company in October 2016, I had to collect the data warehouse, build the data infrastructure , organize a single data access for the entire company. Then I assembled a distributed team of SQL analysts attached to various business units, set up communication between them, the code review and sharing of the results processes. Now we have 20 analysts, besides me, and I am building a decentralized control scheme for this structure.
Thanks to Tristan, now I see that I was moving in the right direction and did not step on most of the rake.
Notes
1. About the cloudy ETL out of the box with Stitch, you can read more in my article on Habré .
2. I have been working with Redash for the last 2 years - it is an order of magnitude cheaper than Mode and covers almost all cases, except perhaps python notebooks. Unfortunately, Looker does not officially work with companies from Russia.
3. Singer is a simple open source framework from the creators of Stitch that allows you to write custom connectors to python data sources. For example, we made with it our own connector to Typeform in order to permanently collect the results of user surveys.
4. We in Skyeng have not yet reached the correct code review of analysts with the help of pull-requests, but I wrote a simple script that takes all new SQL queries from Redash, puts them in the master, assigns the revier and makes a post about it in Slack. So we do not lose in speed, but we get a stable process review post factum in hot pursuit.
5. The book was published in 2017 in Russian under the name Analytical Culture.
From data collection to business results.
')
Source: https://habr.com/ru/post/346326/
All Articles