"Letter to the Turkish Sultan" or linear regression on C # using Accord.NET for the analysis of open data in Moscow
When it comes to mastering the very basics of machine learning, it is often suggested to study the corresponding tools in Python or R. We will not discuss their pros and cons, but just ask ourselves what to do if you are familiar only with the .NET ecosystem, but at the same time you are very curious to plunge into the world of data science? The answer is simple, do not despair and look towards F # , and if you also, like me from .NET, only know the basics of C #, then try to learn the Accord.NET Framework .
We have already analyzed its use for solving the classification problem , and this time we will try to consider the simplest tools for linear regression. To do this, we will use open data on the analysis of citizens' appeals taken from the official website of the Mayor of Moscow .
Despite the fact that the title of the article is C # , we will try to build code on VB.NET .
')
I just need to invite you under the cat!

In order to avoid such comments , right at the very beginning I will say that I have nothing to do with the Moscow government , governments, prefectures, etc. therefore, it makes no sense for me to complain about their work . I just accidentally found this data , manually typed it in a tablet and put it on GitHub for you.
Well, and if anyone is curious, then this article continues the mini-cycle on how I studied Data Science from scratch (and so I did not really learn) , if anyone is interested, then I hid references to other articles under the spoiler.
Honestly, I'm not a programmer, besides Accord.NET, I learned very superficially. Unfortunately, there is not so much literature on it, and on-line courses were somehow not immediately found, so in many respects only the developer site remains, and it is not as informative as we would like.
Therefore, with the data set proposed above, I carried out the main manipulations in the last article of the cycle (ibid also a more detailed description of the data set). And in this article, we will creakly try to read the data, train the model and build some kind of graph.
Content:
Part I: introduction and some data
Part II: we write code on C #
Part III: we write the code on VB and the conclusion
Before you start writing code - two words about data.
These are open data on the analysis of citizens' appeals sent to those or other executive bodies of the city of Moscow. I must say that the statistics are scarce, while only 22 months.
In fact, it could have been - 23 months, but in November, the developers provided an incomplete data set, and I did not include it.
Data is presented in csv format. Data columns mean the following:
I did not find a way to automate the data collection process and had to be collected by hand in the end, so that I could have made a slight mistake somewhere, well, the reliability of the data itself would be left to the authors.
It remains to tell just a few words about the framework itself and you can go to the code.
Accord.NET is an open source project , which in most cases can still be used for commercial development under the LGPL license. It seems that the framework has all the basic tools needed for data analysis and machine learning, from testing statistical hypotheses to neural networks.
Now you can go with a clear conscience to the code.
I posted a solution with a project on C # and VB.NET for you on GitHub , you can just download it and try to build it (the idea is to start). If you want to create a project yourself from scratch, then for a similar functionality you need to do the following:
I will place the full code in C # under the spoiler.
In many ways, the solution of the linear regression problem is taken from the example from the developers site , everything is not very difficult there, but still let's sort the code in parts.
Load namespaces of third-party libraries.
Create a namespace, class, main method - everything is trivial.
We define variables that will be useful to us later to divide the data into control and training samples.
It is useful for us, so that our fractional separator is read in the same way in the version of the project in python and in the version in .NET (at least for me) .
We read data from a csv file into a data table format.
In order to process data about the month in which appeals took place, it is necessary to translate them into a digestible format, in this case we will encode everything into double type.
By analogy with the solution in Python, we first create a dictionary, and then recode the data in accordance with it using a loop.
Select the objective function. We will forecast the number of positive decisions for all appeals.
In the first line, we pull out this data from the table, converting it to a double type.
And then in the other two variables, copy positions from 0 to 18 for the training set and from 18 to 22 for the control sample.
We remove unnecessary columns from the table: our objective function, months, years, and the total number of hits, because it includes information about the positive outcome of the review.
And now, add a column with recoded months, first create a new column, add it to the table, and then fill it in a loop.
By analogy with the objective function, we create arrays of input data (attributes).
It remains to create a model. First, we create an object of ordinary linear regression, and then on the basis of it we create a model for multiple regression, because we have almost 30 signs. We train the model naturally on a training set.
We directly obtain the prediction for the training sample.
We display in the console data on the predicted and real values, as well as information about the error and the coefficient of determination.
The developers themselves seem to advise using third-party tools for displaying graphs, but we will use the ScatterplotBox chart supplied with the framework, which displays points. For the data to be at least somehow visual, we create an analogue of the time trend on the X scale (point 1 is January 16, the last point is October 2017), and in parallel we classify points in another array the first 22 are our original data and the last 4 predicted (graph paint them in a different color).
ScatterplotBox.Show displays a window with a schedule. To him we will feed our previously prepared data for the X and Y axes.
Frankly, I don’t know Visual Basic, but here the converter from C # to VB.NET will help us.
We will not analyze the code in parts, you can use the comments left in the code, they are identical for both projects and divide the code into similar sections.
It should be noted that our project turned out to be quite cross-platform, since it can be assembled both using Visual Studio under Windows and using MonoDevelop under Linux. However, this is true, only in relation to C #, the code on VB.NET under Mono is not always going without problems.
Instead of a thousand words, let's take a look at screen shots.
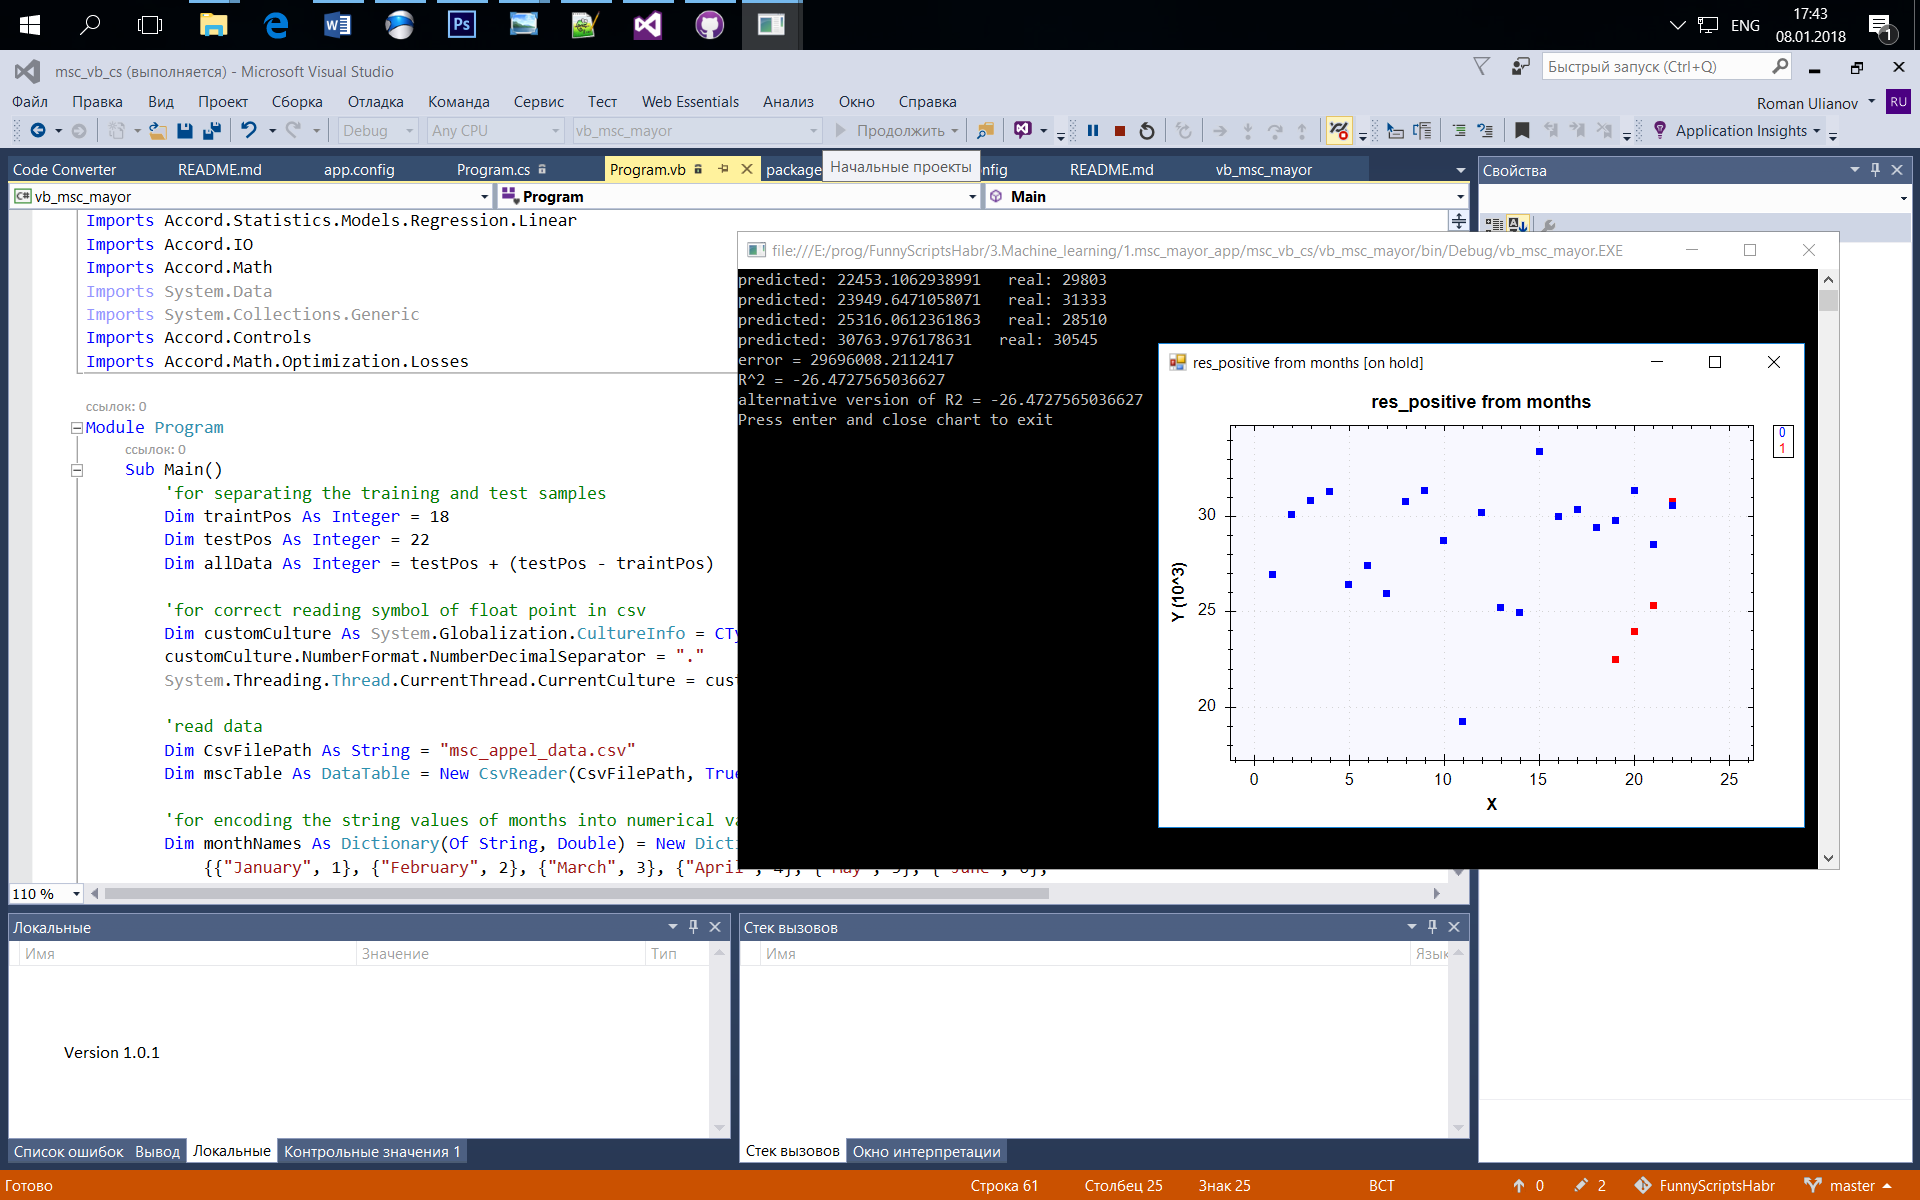
Build VB project version 1.0.1. under Windows.
Build C # project version 1.0.0. under Linux Mint.
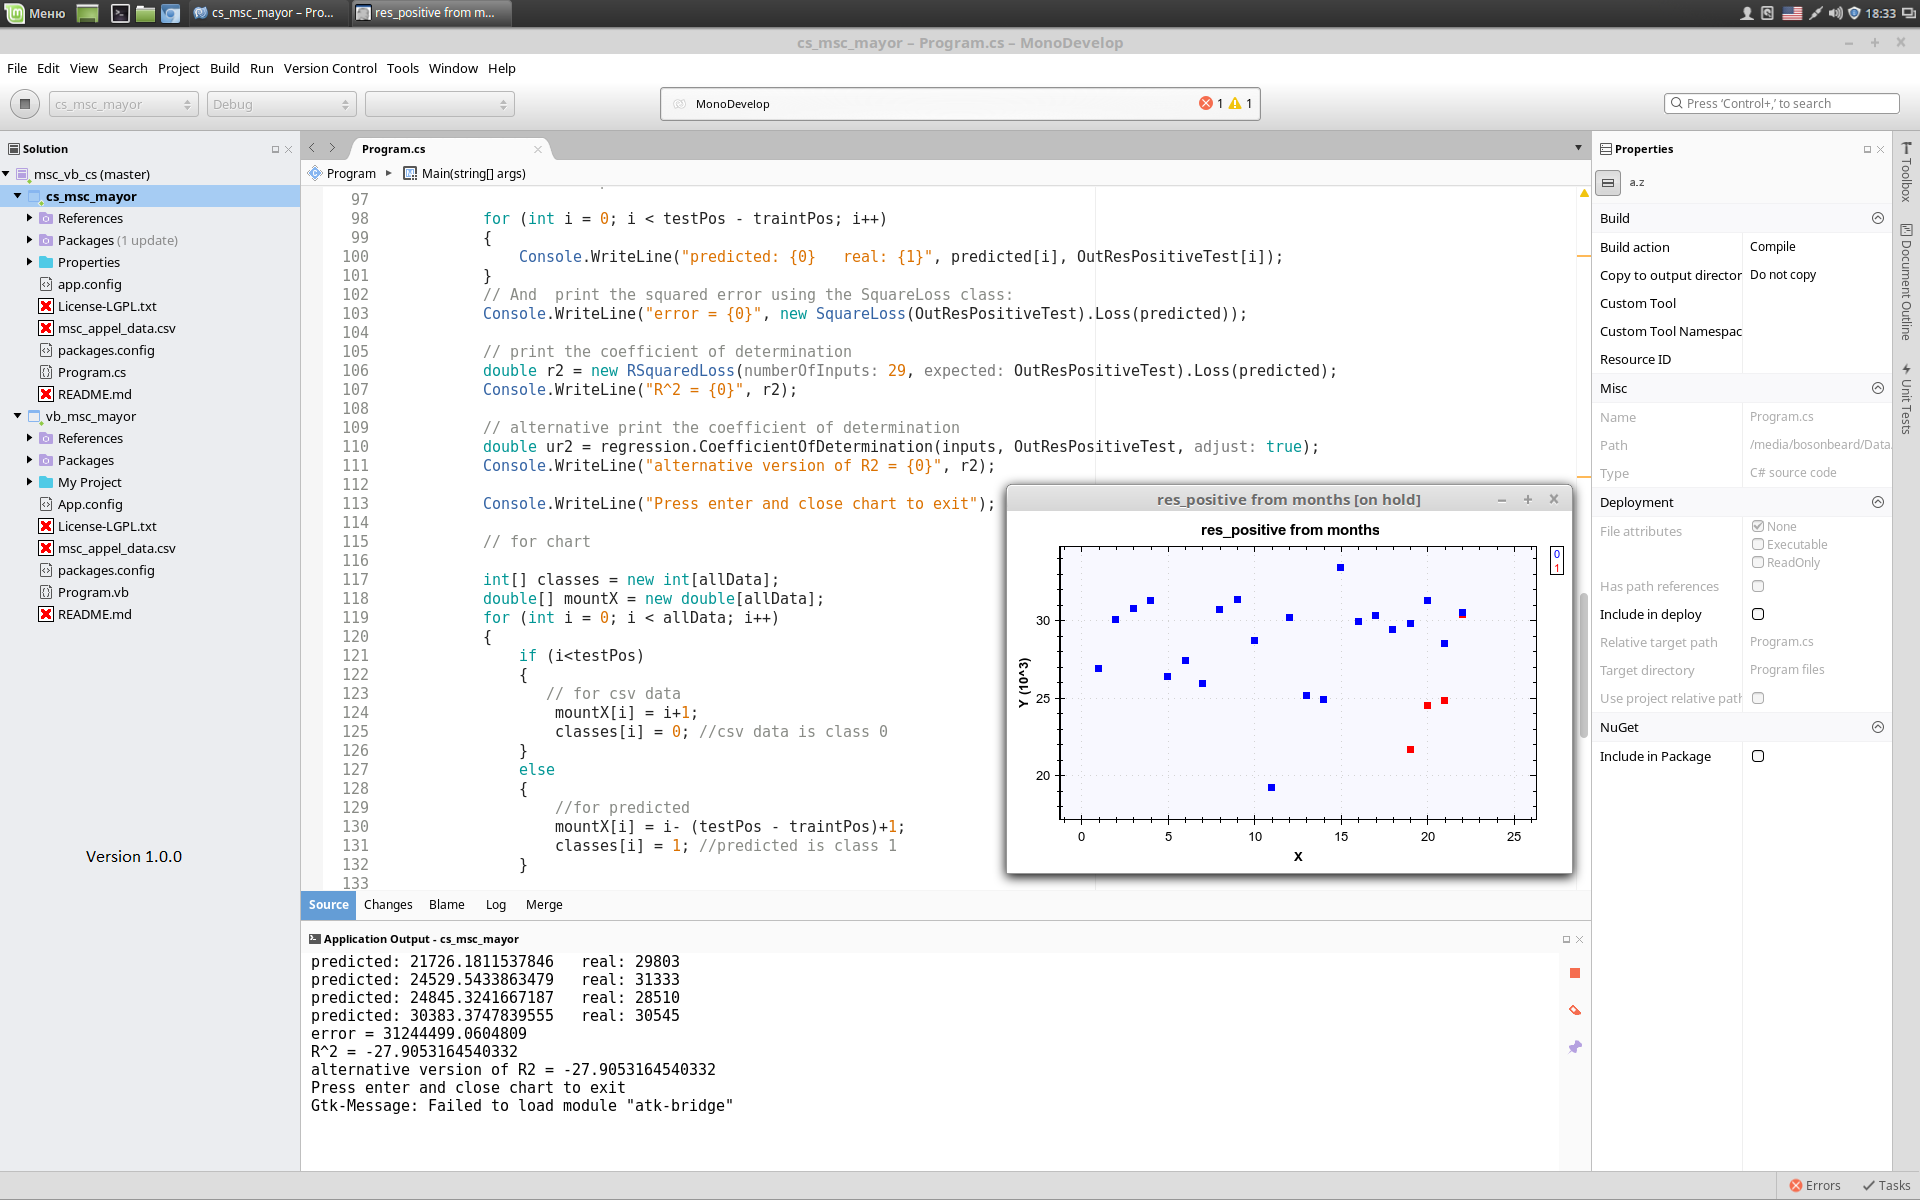
You probably noticed that the results in the pictures are slightly different.
This is not Mono's fault . The thing is that in the version of the project (1.0.0) on C # compiled under Linux, I forgot to take into account the recoded column with months. And in the project version (1.0.1) on VB compiled in Visual Studio - I took it into account.
I wanted to first correct the screenshots, but then I thought that this was a clear demonstration that this feature slightly improved the quality of the prediction.
However, in fact, we have achieved poor results that have no benefit other than training.
The reasons for this are the following factors:
Maybe some other things about which I do not know.
But fortunately we didn’t set ourselves the goal of practical application of the model, it was important for us to learn about the framework and try to do the simplest things, well, then I hope that you will master this tool and I will learn how to work with Accord on your articles .
We have already analyzed its use for solving the classification problem , and this time we will try to consider the simplest tools for linear regression. To do this, we will use open data on the analysis of citizens' appeals taken from the official website of the Mayor of Moscow .
Despite the fact that the title of the article is C # , we will try to build code on VB.NET .
')
I just need to invite you under the cat!
In order to avoid such comments , right at the very beginning I will say that I have nothing to do with the Moscow government , governments, prefectures, etc. therefore, it makes no sense for me to complain about their work . I just accidentally found this data , manually typed it in a tablet and put it on GitHub for you.
Well, and if anyone is curious, then this article continues the mini-cycle on how I studied Data Science from scratch (and so I did not really learn) , if anyone is interested, then I hid references to other articles under the spoiler.
Other articles of the cycle
1. Learn the basics:
2. Practice first skills
- “ Catch data big and small! "- (Overview of Cognitive Class Data Science Courses)
- " Now he counted you " or Data Science from Scratch
- “ Iceberg instead of Oscar! "Or as I tried to learn the basics of DataScience on kaggle
- “ “ A train that could! ”Or“ Specialization Machine learning and data analysis ”, through the eyes of a newbie in Data Science
2. Practice first skills
- “Rise of Machinery Learning” or combine a hobby in Data Science and analyzing the spectra of light bulbs
- “As per the notes!” Or Machine Learning (Data science) in C # using Accord.NET Framework
- “Use the Power of Machine Learning, Luke!” Or automatic classification of luminaires according to the CIL
- “4 weddings and one funerals” or linear regression for analyzing the open data of the Moscow government
Honestly, I'm not a programmer, besides Accord.NET, I learned very superficially. Unfortunately, there is not so much literature on it, and on-line courses were somehow not immediately found, so in many respects only the developer site remains, and it is not as informative as we would like.
Therefore, with the data set proposed above, I carried out the main manipulations in the last article of the cycle (ibid also a more detailed description of the data set). And in this article, we will creakly try to read the data, train the model and build some kind of graph.
Content:
Part I: introduction and some data
Part II: we write code on C #
Part III: we write the code on VB and the conclusion
Before you start writing code - two words about data.
These are open data on the analysis of citizens' appeals sent to those or other executive bodies of the city of Moscow. I must say that the statistics are scarce, while only 22 months.
In fact, it could have been - 23 months, but in November, the developers provided an incomplete data set, and I did not include it.
Data is presented in csv format. Data columns mean the following:
num –
year –
month –
total_appeals –
appeals_to_mayor –
res_positive-
res_explained –
res_negative –
El_form_to_mayor –
Pap_form_to_mayor - to_10K_total_VAO…to_10K_total_YUZAO – 10000
to_10K_mayor_VAO… to_10K_mayor_YUZAO– 10000
I did not find a way to automate the data collection process and had to be collected by hand in the end, so that I could have made a slight mistake somewhere, well, the reliability of the data itself would be left to the authors.
It remains to tell just a few words about the framework itself and you can go to the code.
Accord.NET is an open source project , which in most cases can still be used for commercial development under the LGPL license. It seems that the framework has all the basic tools needed for data analysis and machine learning, from testing statistical hypotheses to neural networks.
Now you can go with a clear conscience to the code.
I posted a solution with a project on C # and VB.NET for you on GitHub , you can just download it and try to build it (the idea is to start). If you want to create a project yourself from scratch, then for a similar functionality you need to do the following:
- Create a new project (I created a console project with Net Framework 4.5).
- Using the package manager (NuGet), install Accord.Controls version 3.8 (it will pull all the other packages we need) and Accord.IO for working with tables. Also, for drawing graphics, you will need to include the standard Windows.Forms library. That's actually all you can write code.
I will place the full code in C # under the spoiler.
Full code for C #
using System; using System.Linq; using Accord.Statistics.Models.Regression.Linear; using Accord.IO; using Accord.Math; using System.Data; using System.Collections.Generic; using Accord.Controls; using Accord.Math.Optimization.Losses; namespace cs_msc_mayor { class Program { static void Main(string[] args) { //for separating the training and test samples int traintPos = 18; int testPos = 22; int allData = testPos + (testPos - traintPos); //for correct reading symbol of float point in csv System.Globalization.CultureInfo customCulture = (System.Globalization.CultureInfo)System.Threading.Thread.CurrentThread.CurrentCulture.Clone(); customCulture.NumberFormat.NumberDecimalSeparator = "."; System.Threading.Thread.CurrentThread.CurrentCulture = customCulture; //read data string CsvFilePath = @"msc_appel_data.csv"; DataTable mscTable = new CsvReader(CsvFilePath, true).ToTable(); //for encoding the string values of months into numerical values Dictionary<string, double> monthNames = new Dictionary<string, double> { ["January"] = 1, ["February"] = 2, ["March"] = 3, ["April"] = 4, ["May"] = 5, ["June"] = 6, ["July"] = 7, ["August"] = 8, ["September"] = 9, ["October"] = 10, ["November"] = 11, ["December"] = 12 }; string[] months = mscTable.Columns["month"].ToArray<String>(); double[] dMonths= new double[months.Length]; for (int i=0; i< months.Length; i++) { dMonths[i] = monthNames[months[i]]; //Console.WriteLine(dMonths[i]); } //select the target column double[] OutResPositive = mscTable.Columns["res_positive"].ToArray(); // separation of the test and train target sample double[] OutResPositiveTrain = OutResPositive.Get(0, traintPos); double[] OutResPositiveTest = OutResPositive.Get(traintPos, testPos); //deleting unneeded columns mscTable.Columns.Remove("total_appeals"); mscTable.Columns.Remove("month"); mscTable.Columns.Remove("res_positive"); mscTable.Columns.Remove("year"); //add coded in a double column month into Table //create new column DataColumn newCol = new DataColumn("dMonth", typeof(double)); newCol.AllowDBNull = true; // add new column mscTable.Columns.Add(newCol); //fill new column int counter = 0; foreach (DataRow row in mscTable.Rows) { row["dMonth"] = dMonths[counter]; counter++; } //receiving input data from a table double[][] inputs = mscTable.ToArray(); //separation of the test and train sample double[][] inputsTrain= inputs.Get(0, traintPos); double[][] inputsTest = inputs.Get(traintPos, testPos); //simple linear regression model var ols = new OrdinaryLeastSquares() { UseIntercept = true }; //linear regression model for several features MultipleLinearRegression regression = ols.Learn(inputsTrain, OutResPositiveTrain); //make a prediction double[] predicted = regression.Transform(inputsTest); //console output for (int i = 0; i < testPos - traintPos; i++) { Console.WriteLine("predicted: {0} real: {1}", predicted[i], OutResPositiveTest[i]); } // And print the squared error using the SquareLoss class: Console.WriteLine("error = {0}", new SquareLoss(OutResPositiveTest).Loss(predicted)); // print the coefficient of determination double r2 = new RSquaredLoss(numberOfInputs: 29, expected: OutResPositiveTest).Loss(predicted); Console.WriteLine("R^2 = {0}", r2); // alternative print the coefficient of determination double ur2 = regression.CoefficientOfDetermination(inputs, OutResPositiveTest, adjust: true); Console.WriteLine("alternative version of R2 = {0}", r2); Console.WriteLine("Press enter and close chart to exit"); // for chart int[] classes = new int[allData]; double[] mountX = new double[allData]; for (int i = 0; i < allData; i++) { if (i<testPos) { // for csv data mountX[i] = i+1; classes[i] = 0; //csv data is class 0 } else { //for predicted mountX[i] = i- (testPos - traintPos)+1; classes[i] = 1; //predicted is class 1 } } // make points of chart List<double> OutChart = new List<double>(); OutChart.AddRange(OutResPositive); OutChart.AddRange(predicted); // plot chart ScatterplotBox.Show("res_positive from months", mountX, OutChart.ToArray(), classes).Hold(); // for pause Console.ReadLine(); } } } In many ways, the solution of the linear regression problem is taken from the example from the developers site , everything is not very difficult there, but still let's sort the code in parts.
using System; using System.Linq; using Accord.Statistics.Models.Regression.Linear; using Accord.IO; using Accord.Math; using System.Data; using System.Collections.Generic; using Accord.Controls; using Accord.Math.Optimization.Losses; Load namespaces of third-party libraries.
namespace cs_msc_mayor { class Program { static void Main(string[] args) { Create a namespace, class, main method - everything is trivial.
//for separating the training and test samples int traintPos = 18; int testPos = 22; int allData = testPos + (testPos - traintPos); We define variables that will be useful to us later to divide the data into control and training samples.
//for correct reading symbol of float point in csv System.Globalization.CultureInfo customCulture = (System.Globalization.CultureInfo)System.Threading.Thread.CurrentThread.CurrentCulture.Clone(); customCulture.NumberFormat.NumberDecimalSeparator = "."; System.Threading.Thread.CurrentThread.CurrentCulture = customCulture; It is useful for us, so that our fractional separator is read in the same way in the version of the project in python and in the version in .NET (at least for me) .
//read data string CsvFilePath = @"msc_appel_data.csv"; DataTable mscTable = new CsvReader(CsvFilePath, true).ToTable(); We read data from a csv file into a data table format.
//for encoding the string values of months into numerical values Dictionary<string, double> monthNames = new Dictionary<string, double> { ["January"] = 1, ["February"] = 2, ["March"] = 3, ["April"] = 4, ["May"] = 5, ["June"] = 6, ["July"] = 7, ["August"] = 8, ["September"] = 9, ["October"] = 10, ["November"] = 11, ["December"] = 12 }; string[] months = mscTable.Columns["month"].ToArray<String>(); double[] dMonths= new double[months.Length]; for (int i=0; i< months.Length; i++) { dMonths[i] = monthNames[months[i]]; //Console.WriteLine(dMonths[i]); } In order to process data about the month in which appeals took place, it is necessary to translate them into a digestible format, in this case we will encode everything into double type.
By analogy with the solution in Python, we first create a dictionary, and then recode the data in accordance with it using a loop.
//select the target column double[] OutResPositive = mscTable.Columns["res_positive"].ToArray(); // separation of the test and train target sample double[] OutResPositiveTrain = OutResPositive.Get(0, traintPos); double[] OutResPositiveTest = OutResPositive.Get(traintPos, testPos); Select the objective function. We will forecast the number of positive decisions for all appeals.
In the first line, we pull out this data from the table, converting it to a double type.
And then in the other two variables, copy positions from 0 to 18 for the training set and from 18 to 22 for the control sample.
//deleting unneeded columns mscTable.Columns.Remove("total_appeals"); mscTable.Columns.Remove("month"); mscTable.Columns.Remove("res_positive"); mscTable.Columns.Remove("year"); We remove unnecessary columns from the table: our objective function, months, years, and the total number of hits, because it includes information about the positive outcome of the review.
//add coded in a double column month into Table //create new column DataColumn newCol = new DataColumn("dMonth", typeof(double)); newCol.AllowDBNull = true; // add new column mscTable.Columns.Add(newCol); //fill new column int counter = 0; foreach (DataRow row in mscTable.Rows) { row["dMonth"] = dMonths[counter]; counter++; } And now, add a column with recoded months, first create a new column, add it to the table, and then fill it in a loop.
//receiving input data from a table double[][] inputs = mscTable.ToArray(); //separation of the test and train sample double[][] inputsTrain= inputs.Get(0, traintPos); double[][] inputsTest = inputs.Get(traintPos, testPos); By analogy with the objective function, we create arrays of input data (attributes).
//simple linear regression model var ols = new OrdinaryLeastSquares() { UseIntercept = true }; //linear regression model for several features MultipleLinearRegression regression = ols.Learn(inputsTrain, OutResPositiveTrain); It remains to create a model. First, we create an object of ordinary linear regression, and then on the basis of it we create a model for multiple regression, because we have almost 30 signs. We train the model naturally on a training set.
//make a prediction double[] predicted = regression.Transform(inputsTest); We directly obtain the prediction for the training sample.
//console output for (int i = 0; i < testPos - traintPos; i++) { Console.WriteLine("predicted: {0} real: {1}", predicted[i], OutResPositiveTest[i]); } // And print the squared error using the SquareLoss class: Console.WriteLine("error = {0}", new SquareLoss(OutResPositiveTest).Loss(predicted)); // print the coefficient of determination double r2 = new RSquaredLoss(numberOfInputs: 29, expected: OutResPositiveTest).Loss(predicted); Console.WriteLine("R^2 = {0}", r2); // alternative print the coefficient of determination double ur2 = regression.CoefficientOfDetermination(inputs, OutResPositiveTest, adjust: true); Console.WriteLine("alternative version of R2 = {0}", r2); Console.WriteLine("Press enter and close chart to exit"); We display in the console data on the predicted and real values, as well as information about the error and the coefficient of determination.
// for chart int[] classes = new int[allData]; double[] mountX = new double[allData]; for (int i = 0; i < allData; i++) { if (i<testPos) { // for csv data mountX[i] = i+1; classes[i] = 0; //csv data is class 0 } else { //for predicted mountX[i] = i- (testPos - traintPos)+1; classes[i] = 1; //predicted is class 1 } } // make points of chart List<double> OutChart = new List<double>(); OutChart.AddRange(OutResPositive); OutChart.AddRange(predicted); The developers themselves seem to advise using third-party tools for displaying graphs, but we will use the ScatterplotBox chart supplied with the framework, which displays points. For the data to be at least somehow visual, we create an analogue of the time trend on the X scale (point 1 is January 16, the last point is October 2017), and in parallel we classify points in another array the first 22 are our original data and the last 4 predicted (graph paint them in a different color).
// plot chart ScatterplotBox.Show("res_positive from months", mountX, OutChart.ToArray(), classes).Hold(); // for pause Console.ReadLine(); } } } ScatterplotBox.Show displays a window with a schedule. To him we will feed our previously prepared data for the X and Y axes.
Frankly, I don’t know Visual Basic, but here the converter from C # to VB.NET will help us.
We will not analyze the code in parts, you can use the comments left in the code, they are identical for both projects and divide the code into similar sections.
Full code on VB.NET
Imports System Imports System.Linq Imports Accord.Statistics.Models.Regression.Linear Imports Accord.IO Imports Accord.Math Imports System.Data Imports System.Collections.Generic Imports Accord.Controls Imports Accord.Math.Optimization.Losses Module Program Sub Main() 'for separating the training and test samples Dim traintPos As Integer = 18 Dim testPos As Integer = 22 Dim allData As Integer = testPos + (testPos - traintPos) 'for correct reading symbol of float point in csv Dim customCulture As System.Globalization.CultureInfo = CType(System.Threading.Thread.CurrentThread.CurrentCulture.Clone(), System.Globalization.CultureInfo) customCulture.NumberFormat.NumberDecimalSeparator = "." System.Threading.Thread.CurrentThread.CurrentCulture = customCulture 'read data Dim CsvFilePath As String = "msc_appel_data.csv" Dim mscTable As DataTable = New CsvReader(CsvFilePath, True).ToTable() 'for encoding the string values of months into numerical values Dim monthNames As Dictionary(Of String, Double) = New Dictionary(Of String, Double) From {{"January", 1}, {"February", 2}, {"March", 3}, {"April", 4}, {"May", 5}, {"June", 6}, {"July", 7}, {"August", 8}, {"September", 9}, {"October", 10}, {"November", 11}, {"December", 12}} Dim months As String() = mscTable.Columns("month").ToArray(Of String)() Dim dMonths As Double() = New Double(months.Length - 1) {} For i As Integer = 0 To months.Length - 1 dMonths(i) = monthNames(months(i)) Next 'select the target column Dim OutResPositive As Double() = mscTable.Columns("res_positive").ToArray() 'separation of the test and train target sample Dim OutResPositiveTrain As Double() = OutResPositive.[Get](0, traintPos) Dim OutResPositiveTest As Double() = OutResPositive.[Get](traintPos, testPos) 'deleting unneeded columns mscTable.Columns.Remove("total_appeals") mscTable.Columns.Remove("month") mscTable.Columns.Remove("res_positive") mscTable.Columns.Remove("year") 'add coded in a double column month into Table 'create new column Dim newCol As DataColumn = New DataColumn("dMonth", GetType(Double)) newCol.AllowDBNull = True 'add new column mscTable.Columns.Add(newCol) 'fill new column Dim counter As Integer = 0 For Each row As DataRow In mscTable.Rows row("dMonth") = dMonths(counter) counter += 1 Next 'receiving input data from a table Dim inputs As Double()() = mscTable.ToArray() 'separation of the test and train sample Dim inputsTrain As Double()() = inputs.[Get](0, traintPos) Dim inputsTest As Double()() = inputs.[Get](traintPos, testPos) 'simple linear regression model Dim ols = New OrdinaryLeastSquares() With {.UseIntercept = True} 'linear regression model for several features Dim regression As MultipleLinearRegression = ols.Learn(inputsTrain, OutResPositiveTrain) 'make a prediction Dim predicted As Double() = regression.Transform(inputsTest) 'console output For i As Integer = 0 To testPos - traintPos - 1 Console.WriteLine("predicted: {0} real: {1}", predicted(i), OutResPositiveTest(i)) Next 'And print the squared error using the SquareLoss class Console.WriteLine("error = {0}", New SquareLoss(OutResPositiveTest).Loss(predicted)) 'print the coefficient of determination Dim r2 As Double = New RSquaredLoss(numberOfInputs:=29, expected:=OutResPositiveTest).Loss(predicted) Console.WriteLine("R^2 = {0}", r2) 'alternative print the coefficient of determination Dim ur2 As Double = regression.CoefficientOfDetermination(inputs, OutResPositiveTest, adjust:=True) Console.WriteLine("alternative version of R2 = {0}", r2) Console.WriteLine("Press enter and close chart to exit") 'for chart Dim classes As Integer() = New Integer(allData - 1) {} Dim mountX As Double() = New Double(allData - 1) {} For i As Integer = 0 To allData - 1 If i < testPos Then mountX(i) = i + 1 classes(i) = 0 'csv data is class 0 Else mountX(i) = i - (testPos - traintPos) + 1 classes(i) = 1 'predicted is class 1 End If Next 'make points of chart Dim OutChart As List(Of Double) = New List(Of Double)() OutChart.AddRange(OutResPositive) OutChart.AddRange(predicted) 'plot chart ScatterplotBox.Show("res_positive from months", mountX, OutChart.ToArray(), classes).Hold() 'for pause Console.ReadLine() End Sub End Module It should be noted that our project turned out to be quite cross-platform, since it can be assembled both using Visual Studio under Windows and using MonoDevelop under Linux. However, this is true, only in relation to C #, the code on VB.NET under Mono is not always going without problems.
Instead of a thousand words, let's take a look at screen shots.
Build VB project version 1.0.1. under Windows.
Build C # project version 1.0.0. under Linux Mint.
You probably noticed that the results in the pictures are slightly different.
This is not Mono's fault . The thing is that in the version of the project (1.0.0) on C # compiled under Linux, I forgot to take into account the recoded column with months. And in the project version (1.0.1) on VB compiled in Visual Studio - I took it into account.
I wanted to first correct the screenshots, but then I thought that this was a clear demonstration that this feature slightly improved the quality of the prediction.
However, in fact, we have achieved poor results that have no benefit other than training.
The reasons for this are the following factors:
- We have data in different quantities, but we did not scale them. (Because I have not figured out how to do it yet with Accord.NET) .
- We also shoved almost all the signs into the model and did not use the “bad” signs, that is, regularization. (Guess why? That's right because I haven't figured it out yet either) .
- Well, certainly too little data to do, normal predictions.
Maybe some other things about which I do not know.
But fortunately we didn’t set ourselves the goal of practical application of the model, it was important for us to learn about the framework and try to do the simplest things, well, then I hope that you will master this tool and I will learn how to work with Accord on your articles .
Source: https://habr.com/ru/post/346222/
All Articles