System for collecting, analyzing, notifying and visualizing logs on syslog-ng, elasticsearch, kibana, grafana, elasticalert
What we get after this article:
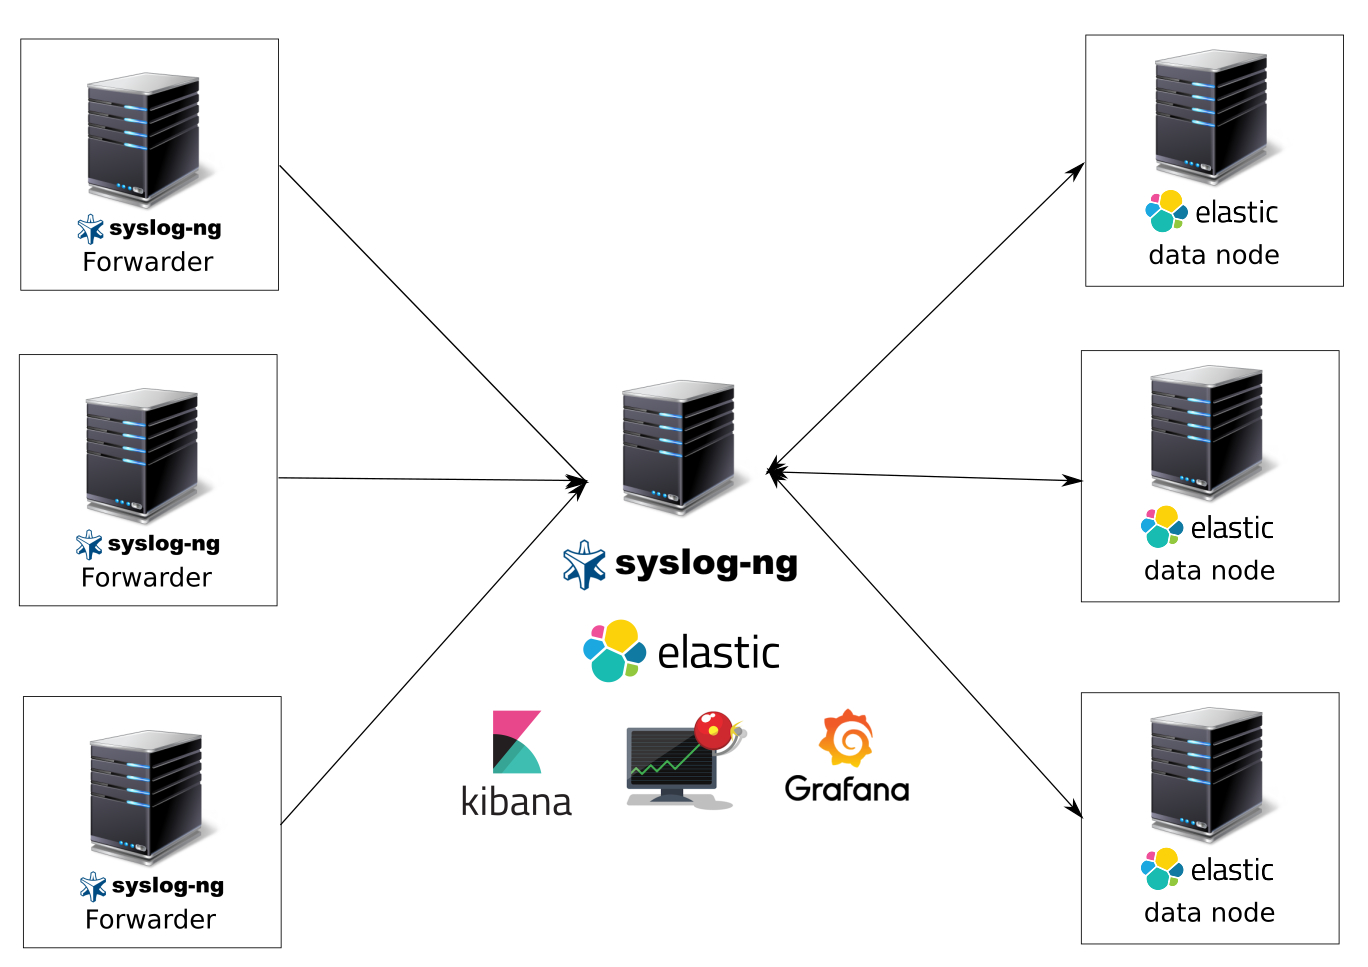
A system for collecting and analyzing logs on syslog-ng, elasticsearch as a data warehouse, kibana and grafana as data visualization systems, kibana for easy searching by logs, elasticalert for sending notifications on events. Get ready, tutorial surround.
What logs will be collected:
- all system logs decomposed into indices depending on their facility (auth, syslog, messages, etc.);
- nginx logs - access and error;
- pm2 logs;
- and etc.
Justification of the choice of system
Why did I choose a bundle with syslog-ng as a sender, parser and log receiver? Yes, because it is very fast, reliable, not demanding of resources (yes, yes — logstash as agents on servers and virtual machines is just a mess in terms of devouring resources and java requirement), with a distinct syntax of configs (did you see rsyslog? - it’s a silent horror ), with wide capabilities - parsing, filtering, a large number of data storages (postgresql, mysql, elasticsearch, files, etc.), buffering (upd does not support buffering), third-party modules and other chips.
Requirements:
- Ubuntu 16.04 or debian 8-9;
- vm for deployment;
- Straight arms.
Let's start or welcome under kat
A little explanation.
Only cluster elasticsearch can be used in production, the system from one node will simply be bent. In production, we use a cluster of master nodes and several danodas. Failover cluster will not be considered here. Who cares - google ahead. Elastic recommends using the same configuration for the nodes of a cluster, since the cluster will still work at the speed of the slowest node. I use nodes on 4 cpu and 12 gb ram and 700 gb ssd.
Our logging system will consist of several virtual machines — the head server (elasticnode1) and the datanad elasticsearch (elasticnode2-9), on which data will only be stored.
Immediately correct the file / etc / hosts, if you do not have a configured dns server.
10.10.10.210 elasticsearch-node1 elasticnode1 10.10.10.211 elasticsearch-node2 elasticnode2 10.10.10.212 elasticsearch-node3 elasticnode3 10.10.10.213 elasticsearch-node4 elasticnode4 10.10.10.214 elasticsearch-node5 elasticnode5 10.10.10.215 elasticsearch-node6 elasticnode6 10.10.10.216 elasticsearch-node7 elasticnode7 10.10.10.217 elasticsearch-node8 elasticnode8 10.10.10.218 elasticsearch-node9 elasticnode9 We change the scheduler - we have the same ssd
echo noop > /sys/block/sda/queue/scheduler Components of the head server
(elasticnode1):
- syslog-ng is our main receiver, logger and logger;
- docker - in it we will raise grafana, kibana, elasticalert;
- kibana - visualization and search for logs;
- grafana - visualization and sending of notifications (at the moment notifications can be sent using elasticsearch as a data warehouse);
- elasticalert (through it we will send notifications from elasticsearch to the telegram - where do without it);
- elasticsearch - here we’ll actually send all our data from nodes and parsed files;
- ubuntu 16.04 as oc.
Datanod components (elasticnode2-elasticnode7):
- elasticsearch;
- ubuntu 16.04 as wasps.
Log senders components:
- ubuntu or debian;
- syslog-ng.
At the moment, version 6 of the products elasticsearch, kibana, etc. has appeared, but I use 5.6.3 in production - so far it has not been possible to migrate to the latest version.
We configure senders of logs.
Install the latest version of syslog-ng. We will install from the repository. Here is the installation for Ubuntu 16.04.
systemctl disable rsyslog; systemctl stop rsyslog; apt-get purge rsyslog -y wget -P . http://download.opensuse.org/repositories/home:/laszlo_budai:/syslog-ng/xUbuntu_17.04/Release.key; apt-key add Release.key echo "deb http://download.opensuse.org/repositories/home:/laszlo_budai:/syslog-ng/xUbuntu_16.10 ./" > /etc/apt/sources.list.d/syslog-ng-obs.list wget http://no.archive.ubuntu.com/ubuntu/pool/main/j/json-c/libjson-c3_0.12.1-1.1_amd64.deb && dpkg -i libjson-c3_0.12.1-1.1_amd64.deb apt-get update && apt-get install syslog-ng-core -y Thuny sysctl.conf
Overwrite
: > /etc/sysctl.conf We insert
nano /etc/sysctl.conf vm.swappiness=1 vm.max_map_count=262144 net.ipv4.tcp_wmem = 4096 65536 16777216 net.ipv4.tcp_wmem = 4096 262144 4194304 net.ipv4.tcp_window_scaling = 1 net.ipv4.tcp_tw_reuse = 0 #net.ipv4.tcp_tw_recycle = 0 net.ipv4.tcp_timestamps = 1 net.ipv4.tcp_syncookies = 0 net.ipv4.tcp_synack_retries = 1 net.ipv4.tcp_sack = 1 net.ipv4.tcp_rmem = 4096 262144 4194304 net.ipv4.tcp_rfc1337 = 1 net.ipv4.tcp_orphan_retries = 0 net.ipv4.tcp_no_metrics_save = 1 net.ipv4.tcp_moderate_rcvbuf = 1 net.ipv4.tcp_mem = 50576 64768 98152 net.ipv4.tcp_max_syn_backlog = 65536 net.ipv4.tcp_max_orphans = 65536 net.ipv4.tcp_keepalive_time = 600 net.ipv4.tcp_keepalive_probes = 20 net.ipv4.tcp_keepalive_intvl = 60 net.ipv4.tcp_fin_timeout = 10 net.ipv4.tcp_congestion_control = htcp net.ipv4.tcp_adv_win_scale = 2 net.ipv4.route.flush = 1 net.ipv4.ip_local_port_range = 10240 65535 net.ipv4.ip_forward = 1 net.ipv4.icmp_ignore_bogus_error_responses = 1 net.ipv4.icmp_echo_ignore_broadcasts = 1 net.ipv4.icmp_echo_ignore_all = 1 net.ipv4.conf.lo.rp_filter = 1 net.ipv4.conf.lo.accept_source_route = 0 net.ipv4.conf.default.rp_filter = 1 net.ipv4.conf.default.accept_source_route = 0 net.ipv4.conf.all.send_redirects = 0 net.ipv4.conf.all.secure_redirects = 0 net.ipv4.conf.all.rp_filter = 1 net.ipv4.conf.all.accept_source_route = 0 net.ipv4.conf.all.accept_redirects = 0 kernel.sem = 350 358400 64 1024 fs.inotify.max_user_watches = 67108864 fs.file-max = 518144 net.core.somaxconn = 15000 #net.core.netdev_max_backlog = 1000 net.core.rmem_default = 65536 net.core.wmem_default = 65536 net.core.rmem_max = 67108864 net.core.wmem_max = 67108864 # Connection tracking to prevent dropped connections (usually issue on LBs) net.netfilter.nf_conntrack_max=262144 net.netfilter.nf_conntrack_tcp_timeout_established=86400 Apply
sysctl -p We configure syslog-ng for parsing and sending logs from the client to the server.
We bring /etc/syslog-ng/syslog-ng.conf to this form.
@version: 3.13 @include "scl.conf" # options { sync (5000); time_reopen (10); time_reap(5); long_hostnames (off); use_dns (no); use_fqdn (no); create_dirs (no); keep_hostname (yes); log_fifo_size (536870912); stats_freq(60); flush_lines(500); flush_timeout(10000); bad_hostname("^gconfd$"); }; @include "/etc/syslog-ng/conf.d/*.conf" We create a config of sending logs to the server.
mkdir -p /etc/syslog-ng/conf.d/ Paste the following contents here.
nano /etc/syslog-ng/conf.d/output.conf source s_src { system(); internal(); }; destination d_net { udp("elasticnode1" port(514) ); }; log { source(s_src); destination(d_net); }; Thus, we will send all logs via udp to server port 514. There he will deal with them - decompose by index, filter, etc.
Setting up sending nginx access and error logs by outputting the contents of the log and sending by udp to designated ports.
Why did I choose to output the contents from the file and send via udp, rather than direct sending from nginx to the port? I had incomprehensible bugs when sending logs directly from nginx (the server started to return a lot of 500 and 502 errors).
Setup of logs for sending in nginx. Let's edit the nginx.conf config.
# nginx, syslog-ng. log_format full_format '"$time_iso8601"|"$host"|"$http_host"|"$remote_addr"|"$http_x_forwarded_for"|"$request_method"|"$request"|"$status"|"$upstream_status"|"$body_bytes_sent"|"$http_referer"|"$request_time"|"$upstream_response_time"|"$upstream_http_x_cache"|"$uri"|"$upstream_addr"|"$upstream_response_length"|"$server_name"|"$upstream_cache_status"|"$http_user_agent"|"$scheme://$host$request_uri"|"$cookie_bar"'; access_log /var/log/nginx/access.log full_format; error_log /var/log/nginx/error.log; # , !!!!!! UDP!!!!! access_log syslog:server=syslogng-server:25230,tag=nginx1 full_format; error_log syslog:server=syslogng-server:25231,tag=nginx1 warn; Restart nginx. All logs will fall (if you do not have it redefined in configs) to the / var / log / nginx / folder in 2 files specified above.
We configure syslog-ng to read files and send via udp.
nano /etc/syslog-ng/conf.d/output-nginx-logs.conf #### nginx_access destination udp_remote_log_host_nginx_main { udp("elasticnode1" port(25230) ); }; ### udp, tcp, destination tcp-remote_log_host_nginx_main { tcp ( "elasticnode1" port(25230) disk-buffer( mem-buf-length(10000) disk-buf-size(2000000) reliable(no) ) ); }; ###### nginx access################## source s_tail_log_host_nginx_main { file( "/var/log/nginx/access_main.log" follow_freq(1) flags(no-parse) ); }; log {source(s_tail_log_host_nginx_main); destination(udp_remote_log_host_nginx_main);}; #### nginx_error destination d_server_nginx_error { udp("elasticnode1" port(25231) ); }; source s_tail_nginx_error { file( "/var/log/nginx/error.log" follow_freq(1) flags(no-parse) ); }; log {source(s_tail_nginx_error ); destination(d_server_nginx_error);}; Do not forget to periodically reset the log file so that it does not eat all the space on the server. You can use this script on the crown.
#!/bin/bash /usr/bin/find /var/log/ -type f | xargs truncate -s 0 /usr/sbin/logrotate /etc/logrotate.conf > /dev/null 2>&1 We configure the head server with syslog-ng, elasticsearch, kibana, grafana and elasticalert.
For starters, "tyunim" "system.
Tunim limits.conf
Overwrite
: > /etc/security/limits.conf We insert
nano /etc/security/limits.conf * hard memlock unlimited * soft memlock unlimited * - nofile 999999 root soft nproc unlimited Check
ulimit -a Thuny sysctl.conf
Overwrite
: > /etc/sysctl.conf We insert
nano /etc/sysctl.conf vm.swappiness=1 vm.max_map_count=262144 net.ipv4.tcp_wmem = 4096 65536 16777216 net.ipv4.tcp_wmem = 4096 262144 4194304 net.ipv4.tcp_window_scaling = 1 net.ipv4.tcp_tw_reuse = 0 #net.ipv4.tcp_tw_recycle = 0 net.ipv4.tcp_timestamps = 1 net.ipv4.tcp_syncookies = 0 net.ipv4.tcp_synack_retries = 1 net.ipv4.tcp_sack = 1 net.ipv4.tcp_rmem = 4096 262144 4194304 net.ipv4.tcp_rfc1337 = 1 net.ipv4.tcp_orphan_retries = 0 net.ipv4.tcp_no_metrics_save = 1 net.ipv4.tcp_moderate_rcvbuf = 1 net.ipv4.tcp_mem = 50576 64768 98152 net.ipv4.tcp_max_syn_backlog = 65536 net.ipv4.tcp_max_orphans = 65536 net.ipv4.tcp_keepalive_time = 600 net.ipv4.tcp_keepalive_probes = 20 net.ipv4.tcp_keepalive_intvl = 60 net.ipv4.tcp_fin_timeout = 10 net.ipv4.tcp_congestion_control = htcp net.ipv4.tcp_adv_win_scale = 2 net.ipv4.route.flush = 1 net.ipv4.ip_local_port_range = 10240 65535 net.ipv4.ip_forward = 1 net.ipv4.icmp_ignore_bogus_error_responses = 1 net.ipv4.icmp_echo_ignore_broadcasts = 1 net.ipv4.icmp_echo_ignore_all = 1 net.ipv4.conf.lo.rp_filter = 1 net.ipv4.conf.lo.accept_source_route = 0 net.ipv4.conf.default.rp_filter = 1 net.ipv4.conf.default.accept_source_route = 0 net.ipv4.conf.all.send_redirects = 0 net.ipv4.conf.all.secure_redirects = 0 net.ipv4.conf.all.rp_filter = 1 net.ipv4.conf.all.accept_source_route = 0 net.ipv4.conf.all.accept_redirects = 0 kernel.sem = 350 358400 64 1024 fs.inotify.max_user_watches = 67108864 fs.file-max = 518144 net.core.somaxconn = 15000 #net.core.netdev_max_backlog = 1000 net.core.rmem_default = 65536 net.core.wmem_default = 65536 net.core.rmem_max = 67108864 net.core.wmem_max = 67108864 # Connection tracking to prevent dropped connections (usually issue on LBs) net.netfilter.nf_conntrack_max=262144 net.netfilter.nf_conntrack_tcp_timeout_established=86400 Apply
systctl -p Disable swap.
swapoff -a Remove rsyslog
systemctl disable rsyslog systemctl stop rsyslog apt purge rsyslog -y We collect syslog-ng from sources with all modules of the latest version for our server.
Dependencies:
apt-get install bison gcc+ libglib2.0-0 libpcre3 glib-2.0 libglib2.0-dev flex python-dev libriemann-client-dev riemann-c-client libhiredis-dev libesmtp-dev libnet-dev libmaxminddb-dev libgeoip-dev libdbi-dev autoconf-archive libpixman-1-dev apt-get install libcurl4-openssl-dev -y Install granle
wget https://services.gradle.org/distributions/gradle-4.4-bin.zip mkdir /opt/gradle unzip -d /opt/gradle gradle-4.4-bin.zip ls /opt/gradle/gradle-4.4 export PATH=$PATH:/opt/gradle/gradle-4.4/bin configure && make && make install We put java8 and export paths
apt-get install openjdk-8-jdk -y export LD_LIBRARY_PATH=/usr/lib/jvm/java-8-openjdk-amd64/jre/lib/amd64/server:$LD_LIBRARY_PATH Clone the syslog-ng repository, build and install
git clone https://github.com/balabit/syslog-ng/ cd syslog-ng ./autogen.sh ./configure --enable-all-modules --enable-systemd make -j4 && make install ldconfig -v We add init.d script - if you didn’t change anything during the build (path) then everything will work.
nano /etc/init.d/syslog-ng #! /bin/sh ### BEGIN INIT INFO # Provides: syslog-ng # Required-Start: $local_fs $network $time $remote_fs # Required-Stop: $local_fs $network $time $remote_fs # Default-Start: 2 3 4 5 # Default-Stop: 0 1 6 # Short-Description: Starting system logging daemon # Description: Starting syslog-NG, the next generation # syslog daemon. ### END INIT INFO# set -e SYSLOGNG_OPTS="" #we source /etc/default/syslog-ng if exists [ -r /etc/default/syslog-ng ] && . /etc/default/syslog-ng # stop syslog-ng before changing its PID file! PIDFILE="/var/run/syslog-ng.pid" SYSLOGNG="/usr/sbin/syslog-ng" NAME="syslog-ng" PATH=/sbin:/bin:/usr/sbin:/usr/bin test -f $SYSLOGNG || exit 0 # Define LSB log_* functions. # Depend on lsb-base (>= 3.0-6) to ensure that this file is present. . /lib/lsb/init-functions case "x$CONSOLE_LOG_LEVEL" in x[1-8]) dmesg -n $CONSOLE_LOG_LEVEL ;; x) ;; *) log_warning_msg "CONSOLE_LOG_LEVEL is of unaccepted value." ;; esac create_xconsole() { XCONSOLE=/dev/xconsole if [ "$(uname -s)" = "GNU/kFreeBSD" ]; then XCONSOLE=/var/run/xconsole ln -sf $XCONSOLE /dev/xconsole fi if [ ! -e $XCONSOLE ]; then mknod -m 640 $XCONSOLE p chown root:adm $XCONSOLE [ -x /sbin/restorecon ] && /sbin/restorecon $XCONSOLE fi } create_pidfiledir() { if [ ! -d /var/run/syslog-ng ] then mkdir -p /var/run/syslog-ng fi } syslogng_wait() { if [ "$2" -ne 0 ]; then return 1 fi if [ -n "$DPKG_MAINTSCRIPT_PACKAGE" ]; then return 0 fi RET=1 for i in $(seq 1 30); do status=0 syslog-ng-ctl stats >/dev/null 2>&1 || status=$? if [ "$status" != "$1" ]; then RET=0 break fi sleep 1s done return $RET } syslogng_start() { log_daemon_msg "Starting system logging" "$NAME" create_pidfiledir create_xconsole start-stop-daemon --start --oknodo --quiet --exec "$SYSLOGNG" \ --pidfile "$PIDFILE" -- -p "$PIDFILE" $SYSLOGNG_OPTS syslogng_wait 1 $? RET="$?" log_end_msg $RET return $RET } syslogng_stop() { log_daemon_msg "Stopping system logging" "$NAME" start-stop-daemon --stop --oknodo --quiet --name "$NAME" --retry 3 \ --pidfile "$PIDFILE" syslogng_wait 0 $? RET="$?" log_end_msg $RET return $RET } syslogng_reload() { log_daemon_msg "Reload system logging" "$NAME" if $SYSLOGNG -s $SYSLOGNG_OPTS then start-stop-daemon --stop --signal 1 --quiet --exec "$SYSLOGNG" \ --pidfile "$PIDFILE" syslogng_wait 1 $? RET="$?" log_end_msg $RET return $RET else log_end_msg 1 return 1 fi } case "$1" in start) syslogng_start || exit 1 ;; stop) syslogng_stop || exit 1 ;; reload|force-reload) syslogng_reload || exit 1 ;; restart) syslogng_stop syslogng_start || exit 1 ;; status) status_of_proc "$SYSLOGNG" "$NAME" && exit 0 || exit $? ;; *) echo "Usage: /etc/init.d/$NAME {start|stop|restart|reload|force-reload|status}" >&2 exit 1 ;; esac exit 0 We give him rights and do unmask
chmod +x /etc/init.d/syslog-ng && systemctl unmask syslog-ng Install elasticsearch from the deb package.
wget https://artifacts.elastic.co/downloads/elasticsearch/elasticsearch-5.6.3.deb dpkg -i elasticsearch-5.6.3.deb Another small manipulation. Create a directory for the data and autorun elasticsearch after restarting the system.
mkdir /elasticsearchdata/ && chown -R elasticsearch:elasticsearch /elasticsearchdata/ update-rc.d elasticsearch defaults 95 10 sudo /bin/systemctl daemon-reload sudo /bin/systemctl enable elasticsearch.service Set up elasticsearch for maximum memory usage. For this elasticsearch.service we bring to this form.
nano /usr/lib/systemd/system/elasticsearch.service [Unit] Description=Elasticsearch Documentation=http://www.elastic.co Wants=network-online.target After=network-online.target [Service] Environment=ES_HOME=/usr/share/elasticsearch Environment=CONF_DIR=/etc/elasticsearch Environment=DATA_DIR=/var/lib/elasticsearch Environment=LOG_DIR=/var/log/elasticsearch Environment=PID_DIR=/var/run/elasticsearch EnvironmentFile=-/etc/default/elasticsearch LimitMEMLOCK=infinity WorkingDirectory=/usr/share/elasticsearch User=elasticsearch Group=elasticsearch ExecStartPre=/usr/share/elasticsearch/bin/elasticsearch-systemd-pre-exec ExecStart=/usr/share/elasticsearch/bin/elasticsearch \ -p ${PID_DIR}/elasticsearch.pid \ --quiet \ -Edefault.path.logs=${LOG_DIR} \ -Edefault.path.data=${DATA_DIR} \ -Edefault.path.conf=${CONF_DIR} # StandardOutput is configured to redirect to journalctl since # some error messages may be logged in standard output before # elasticsearch logging system is initialized. Elasticsearch # stores its logs in /var/log/elasticsearch and does not use # journalctl by default. If you also want to enable journalctl # logging, you can simply remove the "quiet" option from ExecStart. StandardOutput=journal StandardError=inherit # Specifies the maximum file descriptor number that can be opened by this process LimitNOFILE=65536 # Specifies the maximum number of processes LimitNPROC=2048 # Specifies the maximum size of virtual memory LimitAS=infinity # Specifies the maximum file size LimitFSIZE=infinity # Disable timeout logic and wait until process is stopped TimeoutStopSec=0 # SIGTERM signal is used to stop the Java process KillSignal=SIGTERM # Send the signal only to the JVM rather than its control group KillMode=process # Java process is never killed SendSIGKILL=no # When a JVM receives a SIGTERM signal it exits with code 143 SuccessExitStatus=143 [Install] WantedBy=multi-user.target # Built for distribution-5.6.3 (distribution) Systemctl reload after change
systemctl daemon-reload Edit the /etc/elasticsearch/jvm.options file
nano /etc/elasticsearch/jvm.options We give half of RAM - I have 12 gigabytes on the VM - in the heap space I put 6g, according to the recommendations of the elasticsearch developers.
# Xms represents the initial size of total heap space # Xmx represents the maximum size of total heap space -Xms6g -Xmx6g We edit the config elasticsearch on our main server. Lead to mind
nano /etc/elasticsearch/elasticsearch.yml network.host: 0.0.0.0 cluster.name: "production" node.name: elasticnode1 discovery.zen.ping.unicast.hosts: ["elasticnode1", "elasticnode2", "elasticnode3","elasticnode4","elasticnode5","elasticnode6","elasticnode7","elasticnode8","elasticnode9"] # avoid swapping the Elasticsearch bootstrap.memory_lock: true ###Make node master - non data node.master: true node.data: false # minimum_master_nodes need to be explicitly set when bound on a public IP discovery.zen.minimum_master_nodes: 1 path.data: /elasticsearchdata/ Here we changed the path for the data, set the name of the cluster, indicated that it is the master node (controls the distribution of data in the cluster), is not the date node (does not store data), indicated the list of all cluster nodes, turned off the swap for elasticsearch (bootstrap. memory_lock: true), indicated the minimum number of master nodes for our cluster - 1 (we do not do HA here).
We start the elasticsearch cluster, having previously cleaned the old date directory.
rm -rf /var/lib/elasticsearch/* && /etc/init.d/elasticsearch restart See the health of the cluster from the console
curl -XGET 'http://elastinode1:9200/_cluster/state?pretty' curl http://elastinode1:9200/_nodes/process?pretty Customize datas elasticsearch - elasticnode2-9
Manage the / etc / hosts file as above
Install elasticsearch (do not forget about /usr/lib/systemd/system/elasticsearch.service and /etc/elasticsearch/jvm.options) and tune the system in the same way as the master. Important - there must be the same version of elasticsearch on all nodes.
Config elasticsearch on danododa.
nano /etc/elasticsearch/elasticsearch.yml network.host: 0.0.0.0 cluster.name: "production" node.name: elasticnode2 discovery.zen.ping.unicast.hosts: ["elasticnode1", "elasticnode2", "elasticnode3", "elasticnode4", "elasticnode5", "elasticnode6", "elasticnode7", "elasticnode8", "elasticnode9"] # avoid swapping the Elasticsearch bootstrap.memory_lock: true ###Make node master - non data node.master: false node.data: true # minimum_master_nodes need to be explicitly set when bound on a public IP discovery.zen.minimum_master_nodes: 1 path.data: /elasticsearchdata/ Here the config is similar to the master - we changed the path for the data, set the name of the cluster, indicated that it is datanyad (stores data), specified a list of all nodes of the cluster, turned off swap for elasticsearch (bootstrap.memory_lock: true), indicated the minimum number of masternotes for our cluster - 1.
We start the nodes, after erasing the / var / lib / elasticsearch /, otherwise it will generate an error, since we changed the data storage path.
rm -rf /var/lib/elasticsearch/* && /etc/init.d/elasticsearch restart We will immediately determine how to add a new data point and rebalance the cluster.
We simply add a new node to the configs for all the nodes of the cluster in the discovery.zen.ping.unicast.hosts line, while restarting elasticsearch in the current cluster is not necessary.
We start the rebalancing process on the main server using the query via the command line
curl -XPUT http://elasticnode1:9200/_cluster/settings -d '{ "transient" : { "cluster.routing.allocation.enable" : "all" } }' Just right, let's just one more thing cluster.routing.allocation.disk.watermark.
curl -XPUT http://elasticnode1:9200/_cluster/settings -d '{ "transient": { "cluster.routing.allocation.disk.watermark.low": "90%", "cluster.routing.allocation.disk.watermark.high": "10gb", "cluster.info.update.interval": "1m" } }' For 6 elasticsearch
curl -H "Content-Type: application/json" -XPUT http://elasticnode1:9200/_cluster/settings -d '{ "transient": { "cluster.routing.allocation.disk.watermark.low": "93%", "cluster.routing.allocation.disk.watermark.high": "95%", "cluster.info.update.interval": "1m" } }' Here we determine the minimum available place for the cluster to work, having overcome this threshold, it will stop working - to accept data.
Installing kibana and grafana on the head server.
Kibana and grafana can be safely launched via docker-compose, which we will do below. In principle, the whole system can be raised through docker-compose. Below I will post a link to the repository where everything can be raised with a single command, which in principle is quite acceptable for small systems and for testing. Docker is our everything.
We put docker and docker-compose on ubuntu 16.04
apt-get install \ apt-transport-https \ ca-certificates \ curl \ software-properties-common -y curl -fsSL https://download.docker.com/linux/ubuntu/gpg | apt-key add - add-apt-repository \ "deb [arch=amd64] https://download.docker.com/linux/ubuntu \ $(lsb_release -cs) \ stable" apt-get update && apt-get install docker-ce -y curl -L https://github.com/docker/compose/releases/download/1.18.0/docker-compose-`uname -s`-`uname -m` -o /usr/local/bin/docker-compose chmod +x /usr/local/bin/docker-compose Create a docker-compose.yml file with this content. Pay attention to the enviroment kibana.local prescribed
"ELASTICSEARCH_URL=http://elasticnode1:9200" - elasticsearch Docker-compose.yml content
version: '3.3' services: kibana.local: image: kibana:5.6.3 container_name: kibana.local hostname: kibana.local ports: - "5601:5601" networks: - local-network tty: true privileged: true restart: always extra_hosts: - "elasticnode1:10.10.10.210" environment: - "TZ=Asia/Yekaterinburg" - "ELASTICSEARCH_URL=http://elasticnode1:9200" grafana.local: image: grafana/grafana container_name: grafana.local hostname: grafana.local volumes: - ./configs/grafana/:/etc/grafana/ - ./data/grafana/:/var/lib/grafana/ - ./data/grafana/:/var/log/grafana/ ports: - "13000:3000" networks: - local-network tty: true privileged: true restart: always environment: - "TZ=Asia/Yekaterinburg" - "GF_INSTALL_PLUGINS=grafana-clock-panel,grafana-simple-json-datasource,vonage-status-panel,grafana-piechart-panel,grafana-worldmap-panel" networks: local-network: driver: bridge Run docker-compose
docker-compose up -d In grafana, the default username and password are admin admin.
We go in kibana - we see that everything is ok.
We go further.
Configure reception of syslog-ng system logs, their processing and sending to kibana.
We immediately download the geoip2 maxmind database to build further geoip maps. The analyzer (parser) geoip2 syslog-ng 2 uses the maxminddb library to search for geographic information. According to the developers, it is much faster than its predecessor, and also provides more detailed information.
Download and unpack.
cd /usr/local/etc wget http://geolite.maxmind.com/download/geoip/database/GeoLite2-City.mmdb.gz gunzip GeoLite2-City.mmdb.gz Immediately check for an example.
mmdblookup --file GeoLite2-City.mmdb --ip 1.2.3.4 { "city": { "geoname_id": 3054643 <uint32> "names": { "de": "Budapest" <utf8_string> "en": "Budapest" <utf8_string> "es": "Budapest" <utf8_string> "fr": "Budapest" <utf8_string> "ja": "ブダペスト" <utf8_string> "pt-BR": "Budapeste" <utf8_string> "ru": "" <utf8_string> "zh-CN": "布达佩斯" <utf8_string> } } [...] "location": { "accuracy_radius": 100 <uint16> "latitude": 47.500000 <double> "longitude": 19.083300 <double> "time_zone": "Europe/Budapest" <utf8_string> } [...] Okay. We go further.
Create a symlink of the directory in which we installed syslog-ng in / etc / syslog-ng - this is more convenient for those who are used to the standard location of the syslog-ng configs.
ln -s /usr/local/etc /etc/syslog-ng Let's edit the main config - let's bring it to this view:
nano /usr/local/etc/syslog-ng.conf @version: 3.13 @include "scl.conf" @module mod-java # options { sync (5000); time_reopen (10); time_reap(5); long_hostnames (off); use_dns (no); use_fqdn (no); create_dirs (no); keep_hostname (yes); log_fifo_size (536870912); stats_freq(60); flush_lines(500); flush_timeout(10000); bad_hostname("^gconfd$"); }; @include "/usr/local/etc/conf.d/*.conf" Create a directory in which we will include all configs for convenience.
mkdir -p /usr/local/etc/conf.d Now we will insert configs on reception of system logs from other machines and sending them to elasticsearch with splitting into indices.
nano /usr/local/etc/conf.d/input.conf ### udp 514 source udp-remote-system-logs { udp(port(514) log_iw_size(1000) log_fetch_limit(1000000));}; ######################## # ######################## filter f_dbg { level(debug); }; filter f_info { level(info); }; filter f_notice { level(notice); }; filter f_warn { level(warn); }; filter f_err { level(err); }; filter f_crit { level(crit .. emerg); }; filter f_debug { level(debug) and not facility(auth, authpriv, news, mail); }; filter f_error { level(err .. emerg) ; }; filter f_messages { level(info,notice,warn) and not facility(auth,authpriv,cron,daemon,mail,news); }; filter f_auth { facility(auth, authpriv) and not filter(f_debug); }; filter f_cron { facility(cron) and not filter(f_debug); }; filter f_daemon { facility(daemon) and not filter(f_debug); }; filter f_kern { facility(kern) and not filter(f_debug); }; filter f_lpr { facility(lpr) and not filter(f_debug); }; filter f_local { facility(local0, local1, local3, local4, local5, local6, local7) and not filter(f_debug); }; filter f_mail { facility(mail) and not filter(f_debug); }; filter f_news { facility(news) and not filter(f_debug); }; filter f_syslog3 { not facility(auth, authpriv, mail) and not filter(f_debug); }; filter f_user { facility(user) and not filter(f_debug); }; filter f_uucp { facility(uucp) and not filter(f_debug); }; filter f_cnews { level(notice, err, crit) and facility(news); }; filter f_cother { level(debug, info, notice, warn) or facility(daemon, mail); }; filter f_ppp { facility(local2) and not filter(f_debug); }; filter f_console { level(warn .. emerg); }; ### - elasticsearch ### , ######################## # auth logs ######################## destination d_elastic_auth { elasticsearch2( index("auth-${YEAR}.${MONTH}.${DAY}") type("test") time-zone("UTC") client_mode("http") flush-limit("10000") cluster_url("http://elasticnode1:9200") custom_id("${UNIQID}") template("$(format_json --scope nv_pairs --key ISODATE @timestamp=${ISODATE})") ); }; log { source(udp-remote-system-logs);filter(f_auth); destination(d_elastic_auth); }; ######################## # crons logs ######################## destination d_elastic_crons { elasticsearch2( index("crons-${YEAR}.${MONTH}.${DAY}") type("test") time-zone("UTC") client_mode("http") flush-limit("10000") cluster_url("http://elasticnode1:9200") custom_id("${UNIQID}") template("$(format_json --scope nv_pairs --key ISODATE @timestamp=${ISODATE})") ); }; log { source(udp-remote-system-logs); filter(f_cron); destination(d_elastic_crons); }; ######################## # kern logs ######################## destination d_elastic_kern { elasticsearch2( index("kern-${YEAR}.${MONTH}.${DAY}") type("test") time-zone("UTC") client_mode("http") flush-limit("10000") cluster_url("http://elasticnode1:9200") custom_id("${UNIQID}") template("$(format_json --scope nv_pairs --key ISODATE @timestamp=${ISODATE})") ); }; log { source(udp-remote-system-logs ); filter(f_kern); destination(d_elastic_kern); }; ######################## # daemon logs ######################## destination d_elastic_daemon { elasticsearch2( index("daemon-${YEAR}.${MONTH}.${DAY}") type("test") time-zone("UTC") client_mode("http") flush-limit("10000") cluster_url("http://elasticnode1:9200") custom_id("${UNIQID}") template("$(format_json --scope nv_pairs --key ISODATE @timestamp=${ISODATE})") ); }; log { source(udp-remote-system-logs); filter(f_daemon); destination(d_elastic_daemon); }; ######################## # user logs ######################## destination d_elastic_user { elasticsearch2( index("user-${YEAR}.${MONTH}.${DAY}") type("test") time-zone("UTC") client_mode("http") flush-limit("10000") cluster_url("http://elasticnode1:9200") custom_id("${UNIQID}") template("$(format_json --scope nv_pairs --key ISODATE @timestamp=${ISODATE})") ); }; log { source(udp-remote-system-logs); filter(f_user); destination(d_elastic_user); }; ######################## # lpr logs ######################## destination d_elastic_lpr { elasticsearch2( index("lpr-${YEAR}.${MONTH}.${DAY}") type("test") time-zone("UTC") client_mode("http") flush-limit("10000") cluster_url("http://elasticnode1:9200") custom_id("${UNIQID}") template("$(format_json --scope nv_pairs --key ISODATE @timestamp=${ISODATE})") ); }; log { source(udp-remote-system-logs); filter(f_lpr); destination(d_elastic_lpr); }; ######################## # syslog logs ######################## destination d_elastic_syslog { elasticsearch2( index("syslog-${YEAR}.${MONTH}.${DAY}") type("test") time-zone("UTC") client_mode("http") flush-limit("10000") cluster_url("http://elasticnode1:9200") custom_id("${UNIQID}") template("$(format_json --scope nv_pairs --key ISODATE @timestamp=${ISODATE})") ); }; log { source(udp-remote-system-logs); filter(f_syslog3);destination(d_elastic_syslog); }; ######################## # uucp logs ######################## destination d_elastic_uucp { elasticsearch2( index("uucp-${YEAR}.${MONTH}.${DAY}") type("test") time-zone("UTC") client_mode("http") flush-limit("10000") cluster_url("http://elasticnode1:9200") custom_id("${UNIQID}") template("$(format_json --scope nv_pairs --key ISODATE @timestamp=${ISODATE})") ); }; log { source(udp-remote-system-logs); filter(f_uucp); destination(d_elastic_uucp); }; ######################## # mail logs ######################## destination d_elastic_mail { elasticsearch2( index("mail-${YEAR}.${MONTH}.${DAY}") type("test") time-zone("UTC") client_mode("http") flush-limit("10000") cluster_url("http://elasticnode1:9200") custom_id("${UNIQID}") template("$(format_json --scope nv_pairs --key ISODATE @timestamp=${ISODATE})") ); }; log { source(udp-remote-system-logs); filter(f_mail);destination(d_elastic_mail); }; ######################## # messages logs ######################## destination d_elastic_messages { elasticsearch2( index("messages-${YEAR}.${MONTH}.${DAY}") type("test") time-zone("UTC") client_mode("http") flush-limit("10000") cluster_url("http://elasticnode1:9200") custom_id("${UNIQID}") template("$(format_json --scope nv_pairs --key ISODATE @timestamp=${ISODATE})") ); }; log { source(udp-remote-system-logs); filter(f_messages); destination(d_elastic_messages); }; ######################## # debug logs ######################## destination d_elastic_debug { elasticsearch2( index("debug-${YEAR}.${MONTH}.${DAY}") type("test") time-zone("UTC") client_mode("http") flush-limit("10000") cluster_url("http://elasticnode1:9200") custom_id("${UNIQID}") template("$(format_json --scope nv_pairs --key ISODATE @timestamp=${ISODATE})") ); }; log { source(udp-remote-system-logs); filter(f_debug); destination(d_elastic_debug); }; ######################## # error logs ######################## destination d_elastic_error { elasticsearch2( index("error-${YEAR}.${MONTH}.${DAY}") type("test") time-zone("UTC") client_mode("http") flush-limit("10000") cluster_url("http://elasticnode1:9200") custom_id("${UNIQID}") template("$(format_json --scope nv_pairs --key ISODATE @timestamp=${ISODATE})") ); }; log { source(udp-remote-system-logs); filter(f_error);destination(d_elastic_error); }; ######################## # info logs ######################## destination d_elastic_info { elasticsearch2( index("info-${YEAR}.${MONTH}.${DAY}") type("test") time-zone("UTC") client_mode("http") flush-limit("10000") cluster_url("http://elasticnode1:9200") custom_id("${UNIQID}") template("$(format_json --scope nv_pairs --key ISODATE @timestamp=${ISODATE})") ); }; log { source(udp-remote-system-logs); filter(f_info); destination(d_elastic_info); }; syslog-ng . .
— nginx access error(php errors error.log), nodejs.
nano /usr/local/etc/conf.d/input-web.conf # nginx, , , "|" #log_format full_format '"$time_iso8601"|"$http_host"|"$remote_addr"|"$http_x_forwarded_for"|"$request_method"|"$request"|"$status"|"$body_bytes_sent"|"$http_referer"|"$request_time"|"$upstream_http_x_cache"|"$uri"|"$upstream_addr"|"$host"|"$upstream_response_length"|"$upstream_status"|"$server_name"|"$http_host"|"$upstream_response_time"|"$upstream_cache_status"|"$http_user_agent"|"$scheme://$host$request_uri"|"$cookie_bar"'; #access_log /var/log/nginx/access.log full_format; #error_log /var/log/nginx/error.log; # nginx + libressl + syslog-ng + nodejs - https://github.com/galushkoav/nginx-php-nodejs ## nginx access 25230 udp source udp-nginx-acessfull { udp(port(25230) log_iw_size(1000) log_fetch_limit(1000000)) ; }; ## nginx access 25230 tcp, - source tcp-nginx-acessfull { tcp(port(25230) so_rcvbuf(67108864) log_iw_size(100000) log_fetch_limit(1000000) max-connections(200)); }; ### nginx, , , "|" parser p-nginx-acessfull-mapped { csv-parser(columns("nginx.time","nginx.host", "nginx.http_host", "nginx.remote_addr", "nginx.http_x_forwarded_for", "nginx.request_method", "nginx.request","nginx.status", "nginx.upstream_status","nginx.body_bytes_sent", "nginx.http_referer", "nginx.request_time","nginx.upstream_response_time", "nginx.upstream_http_x_cache", "nginx.uri", "nginx.upstream_addr", "nginx.upstream_response_length", "nginx.server_name","nginx.upstream_cache_status", "nginx.user_agent","nginx.request_uri","nginx.cookie_bar" ) flags(escape-double-char,strip-whitespace) delimiters("|") quote-pairs('""[]') ); }; ### ip nginx - "nginx.remote_addr" maxmidn geoip2 parser p_geoip2 { geoip2( "${nginx.remote_addr}", prefix( "geoip2." ) database( "/usr/local/etc/GEO/GeoLite2-City_20171205/GeoLite2-City.mmdb" ) ); }; ##Rewrite , , Elasticsearch. , GeoIP, . rewrite r_geoip2 { set( "${geoip2.location.latitude},${geoip2.location.longitude}", value( "geoip2.location2" ), condition(not "${geoip2.location.latitude}" == "") ); }; ### nginx_access elasticsearch - nginx-access-geo-* destination d_elastic-nginx-acessfull { elasticsearch2( index("nginx-access-geo-${YEAR}.${MONTH}.${DAY}") type("_doc") client_mode("http") flush-limit("100") cluster_url("http://elasticnode1:9200") custom_id("${UNIQID}") template("$(format-json --scope rfc5424 --scope nv-pairs --exclude DATE --key ISODATE)") persist-name(elasticsearch-nginx) ); }; log {source (udp-nginx-acessfull); parser(p-nginx-acessfull-mapped); rewrite(r_geoip2); parser(p_geoip2); destination(d_elastic-nginx-acessfull);}; ## nginx error 25231 udp source udp-nginx-error { udp(port(25231) log_iw_size(1000) log_fetch_limit(1000000)); }; destination d_elastic-nginxerror { elasticsearch2( index("nginxerror-${YEAR}.${MONTH}.${DAY}") type("test") time-zone("UTC") client_mode("http") flush-limit("10000") cluster_url("http://elasticnode1:9200") custom_id("${UNIQID}") template("$(format_json --scope nv_pairs --key ISODATE @timestamp=${ISODATE})") ); }; ########### - unlink filter f_tail_nginx_error_unlink {not match ("unlink") ;}; log {source(udp-nginx-error); filter(f_tail_nginx_error_unlink); destination(d_elastic-nginxerror); }; Persist.
, index elasticsearch — "-.", nginx-access-geo-2018.01. , — nginx-access-geo-${YEAR}.${MONTH}.${DAY}.
elasticsearch nginx access — mapping nginx-access-geo-2018.01:
- nginx.upstream_response_time nginx.request_time float string, upstreams;
- mapping elasticsearch geoip, .
Important. nginx-access-geo-* .
elasticsearch.
curl -XPUT "http://127.0.0.1:9200/_template/nginxaccess_per_index" -d \ ' { "template" : "nginx-access-geo-*", "mappings" : { "_default_" : { "properties" : { "nginx" : { "properties" : { "request_time": {"type": "integer","ignore_malformed": true}, "upstream_response_time": {"type": "integer","ignore_malformed": true}, "remote_addr": {"type": "ip"}, "status": {"type": "integer","ignore_malformed": true}, "body_bytes_sent": {"type": "integer","ignore_malformed": true}, "upstream_response_length": {"type": "integer","ignore_malformed": true}, "request_uri": {"type": "text","fields": {"keyword": {"type": "keyword"} } } } }, "geoip2" : { "properties" : { "location2" : {"type" : "geo_point"} } } } } } } } ' Mapping elasticsearch6
curl -H "Content-Type: application/json" -XPUT "http://127.0.0.1:9200/_template/nginxaccess_per_index" -d \ ' { "template" : "nginx-access-geo-*", "mappings" : { "_default_" : { "properties" : { "nginx" : { "properties" : { "request_time": {"type": "integer","ignore_malformed": true}, "upstream_response_time": {"type": "integer","ignore_malformed": true}, "remote_addr": {"type": "ip"}, "status": {"type": "integer","ignore_malformed": true}, "body_bytes_sent": {"type": "integer","ignore_malformed": true}, "upstream_response_length": {"type": "integer","ignore_malformed": true}, "request_uri": {"type": "text","fields": {"keyword": {"type": "keyword"} } } } }, "geoip2" : { "properties" : { "location2" : {"type" : "geo_point"} } } } } } } } ' . . ```bash curl -X GET 'http://elasticnode1:9200/nginx-access-geo-2018.01' .
syslog-ng,
syslog-ng -Fvde —
/etc/init.d/syslog-ng start — elasticsearch .
elasticsearch " -*" , , :
curl 'http://elasticnode1:9200/_cat/indices?v' | awk '{ print $3 }' | sed -e '1d' | cut -d"-" -f1 | awk '{print $0"-*"}' Conclusion
root@human-K73SM:/etc/systemd/system# curl 'http://elasticnode1:9200/_cat/indices?v' | awk '{ print $3 }' | sed -e '1d' | cut -d"-" -f1 | awk '{print $0"-*"}' % Total % Received % Xferd Average Speed Time Time Time Current Dload Upload Total Spent Left Speed 100 3000 100 3000 0 0 11749 0 --:--:-- --:--:-- --:--:-- 11764 nginxerror-* mail-* nginxerror-* kern-* messages-* nginxerror-* nginx-* syslog-* .kibana-* error-* nginxerror-* nginx-* nginxerror-* nodejs-* syslog-* elastalert_status-* debug-* crons-* user-* auth-* daemon-* nginxerror-* info-* auth-* , .kibana, elasticalert.
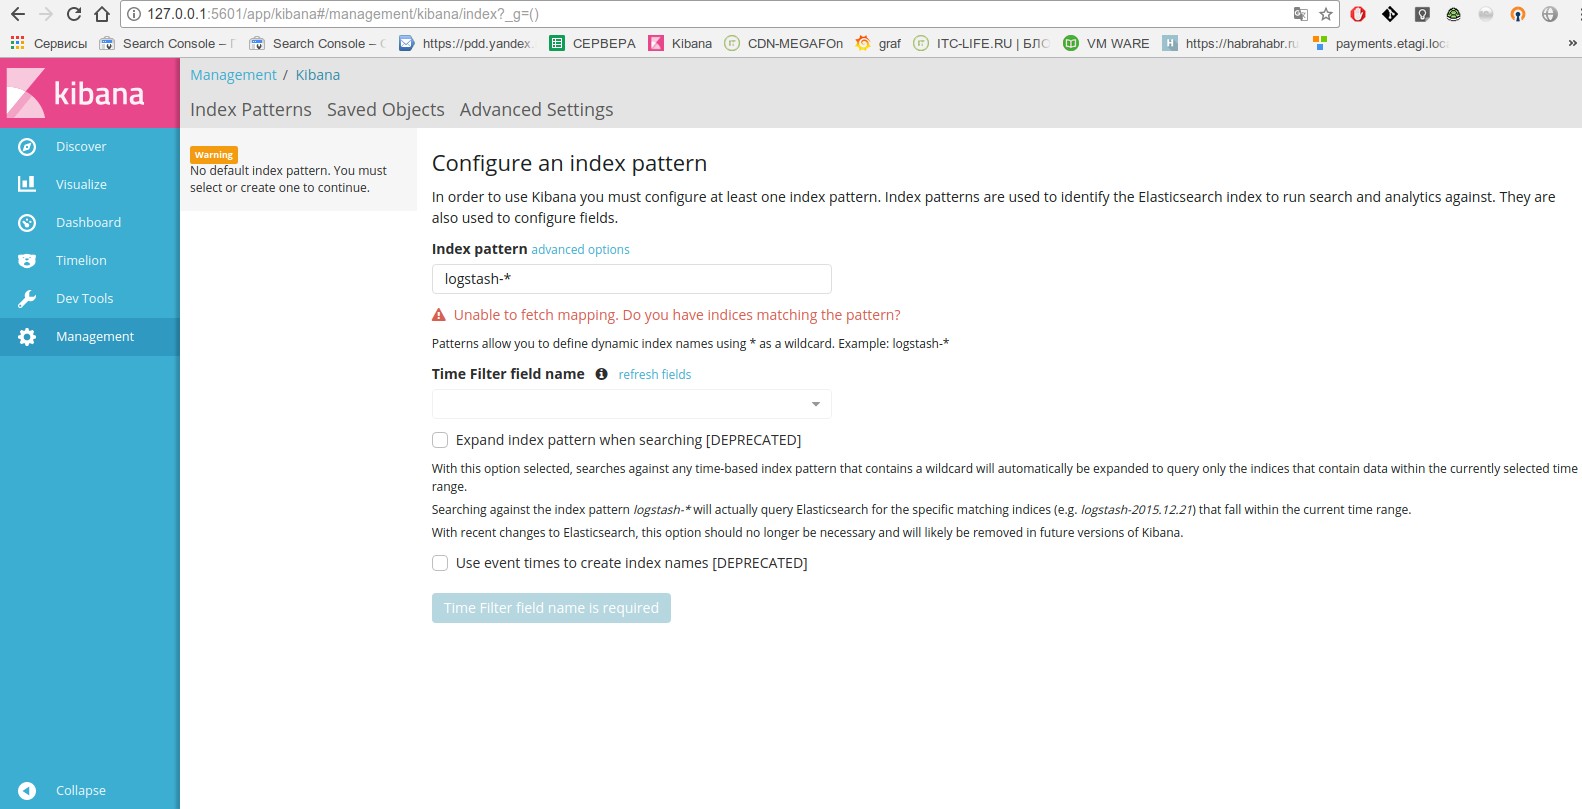
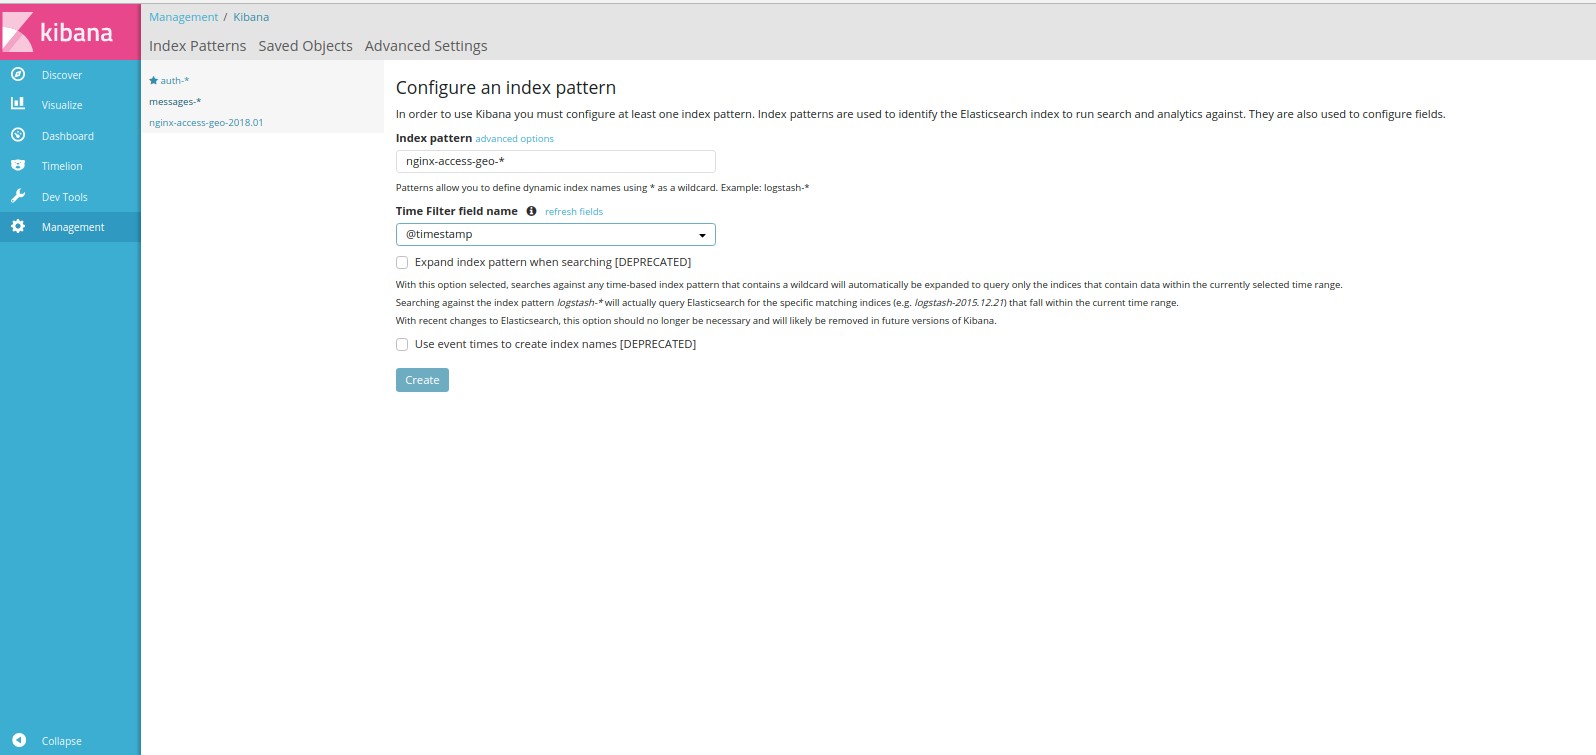
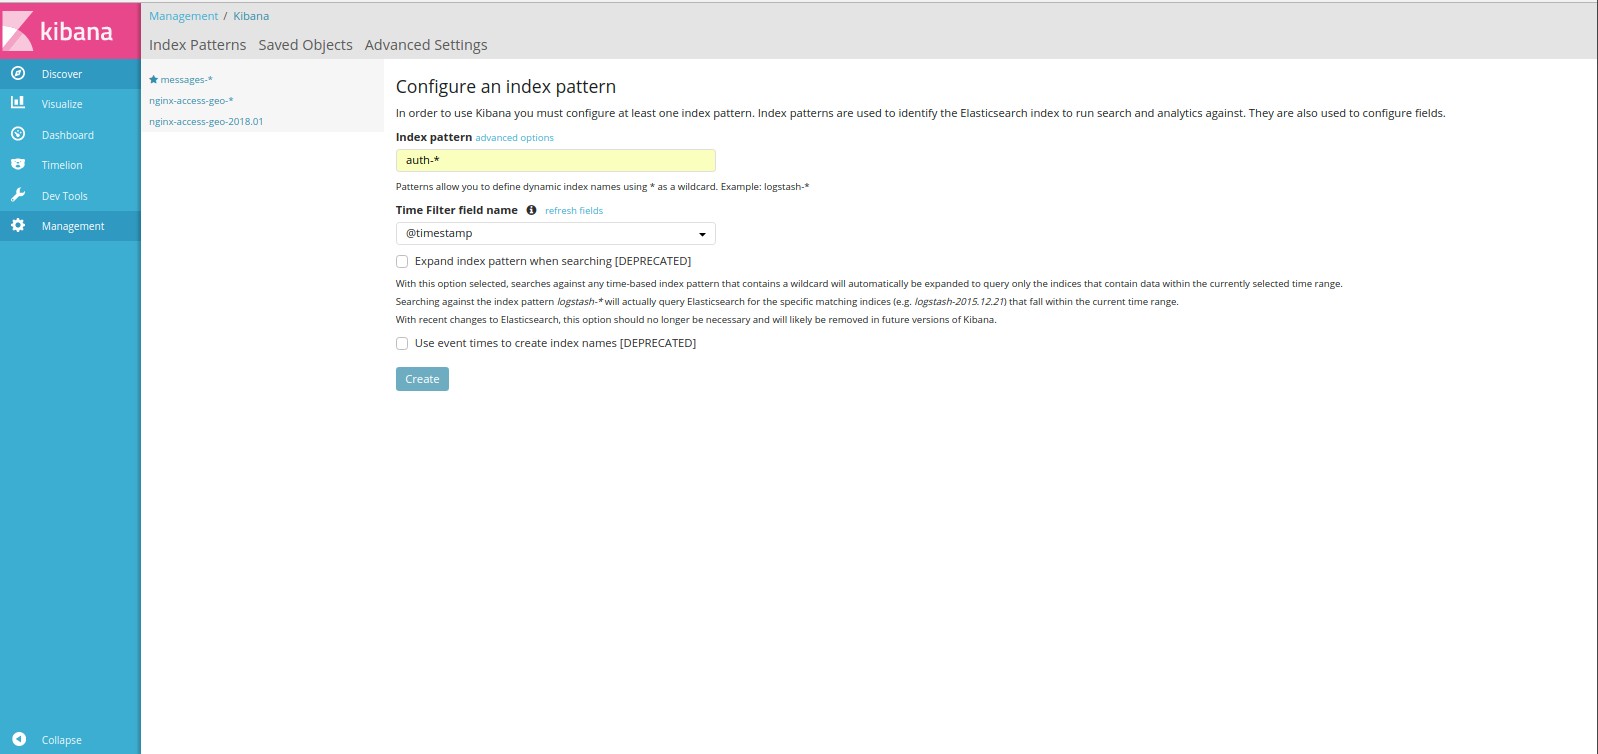
kibana , . elasticsearch 5.6.3 :
curl -XPOST "http://elasticnode1:9200/.kibana/index-pattern/kern-*" -H 'Content- Type: application/json' -d' { "title" : "kern-*", "timeFieldName" : "ISODATE" }' 6-
curl -XPOST "http://127.0.0.1:9200/.kibana/doc/index-pattern:auth-*" -H "Content-Type: application/json" -d \ ' { "type" : "index-pattern", "index-pattern" : { "title": "auth-*", "timeFieldName": "@timestamp" } }' kern, wildcard, .. .
pm2 c syslog-ng.
Pm2 .
--merge-logs --log-type=json --log-date-format="YYYY-MM-DD HH:mm Z" . .
#### nodejs destination d_server_pm2logs { udp("elasticnode1" port(25216)); }; source s_tail_pm2 { file( "/root/.pm2/logs/server-error.log" follow_freq(1) flags(no-parse) ); }; ### - . log {source(s_tail_pm2); destination(d_server_pm2logs);} elasticsearch.
## nodejs source remote_log_host_nodejs { udp(port(25216) log_iw_size(1000) log_fetch_limit(1000000) flags(no-parse)); }; ### nodejs elasticsearch destination d_elastic_pm2logs { elasticsearch2( #client-lib-dir("/usr/share/elasticsearch/lib/") index("pm2logs-${YEAR}.${MONTH}.${DAY}") type("test") time-zone("UTC") client_mode("http") flush-limit("10000") cluster_url("http://elasticnode1:9200") custom_id("${UNIQID}") template("$(format_json --scope nv_pairs --key ISODATE @timestamp=${ISODATE})") ); }; log { source(remote_log_host_nodejs); destination(d_elastic_pm2logs); }; syslog-ng kibana.
syslog-ng .
kibana .
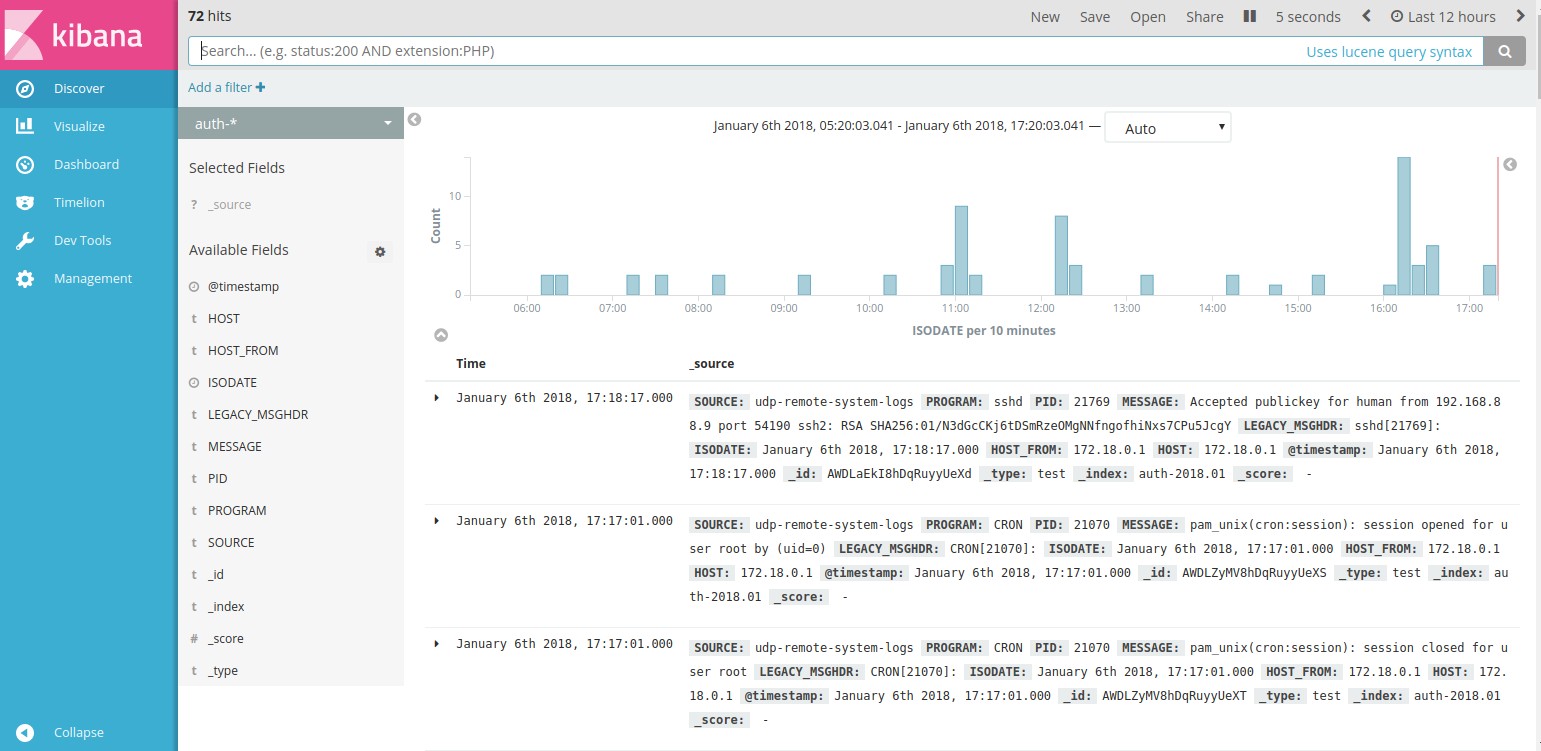
nginx, c 2 , nginx.request_time: [2 TO *].
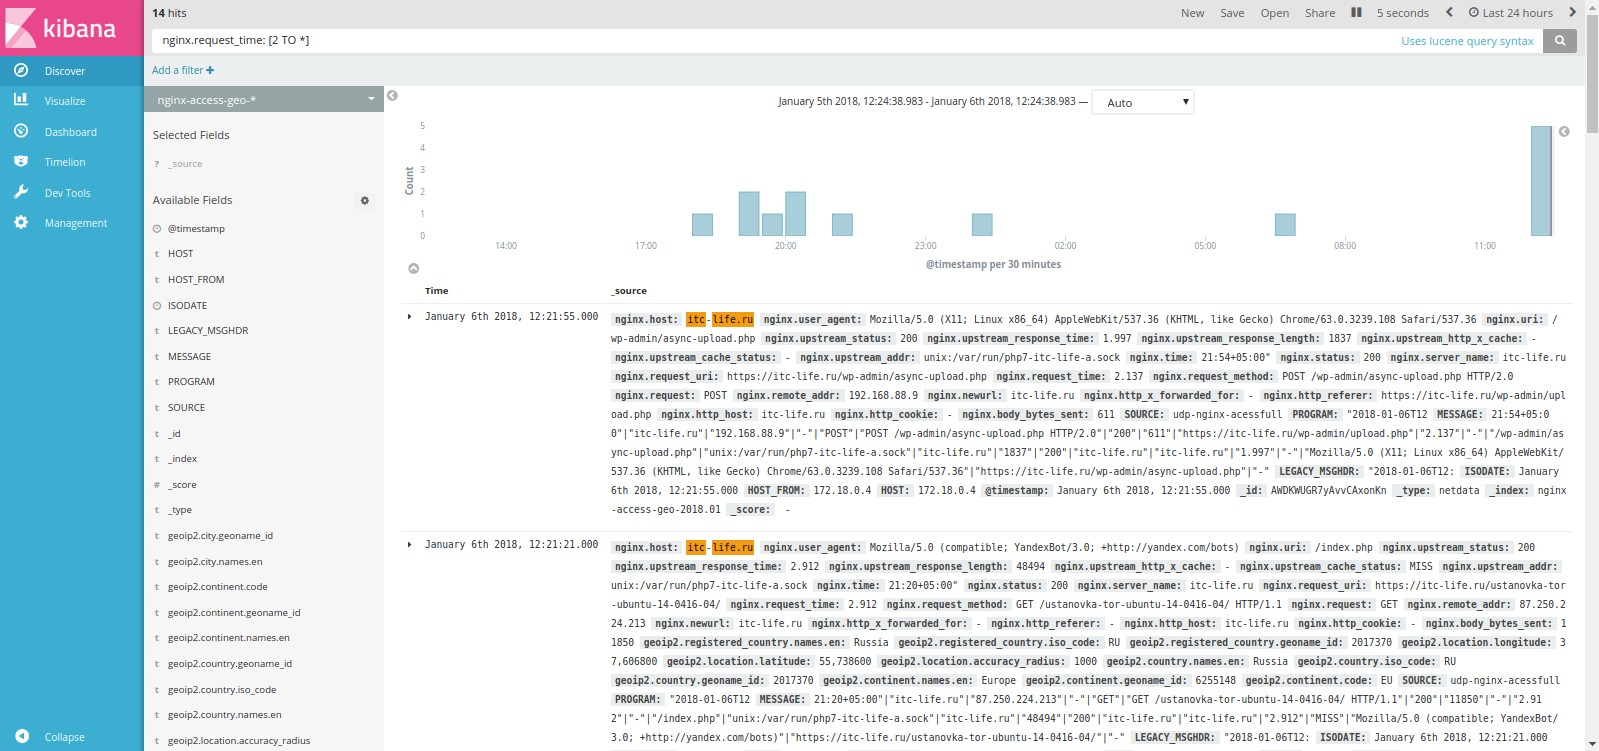
. 24 30 .
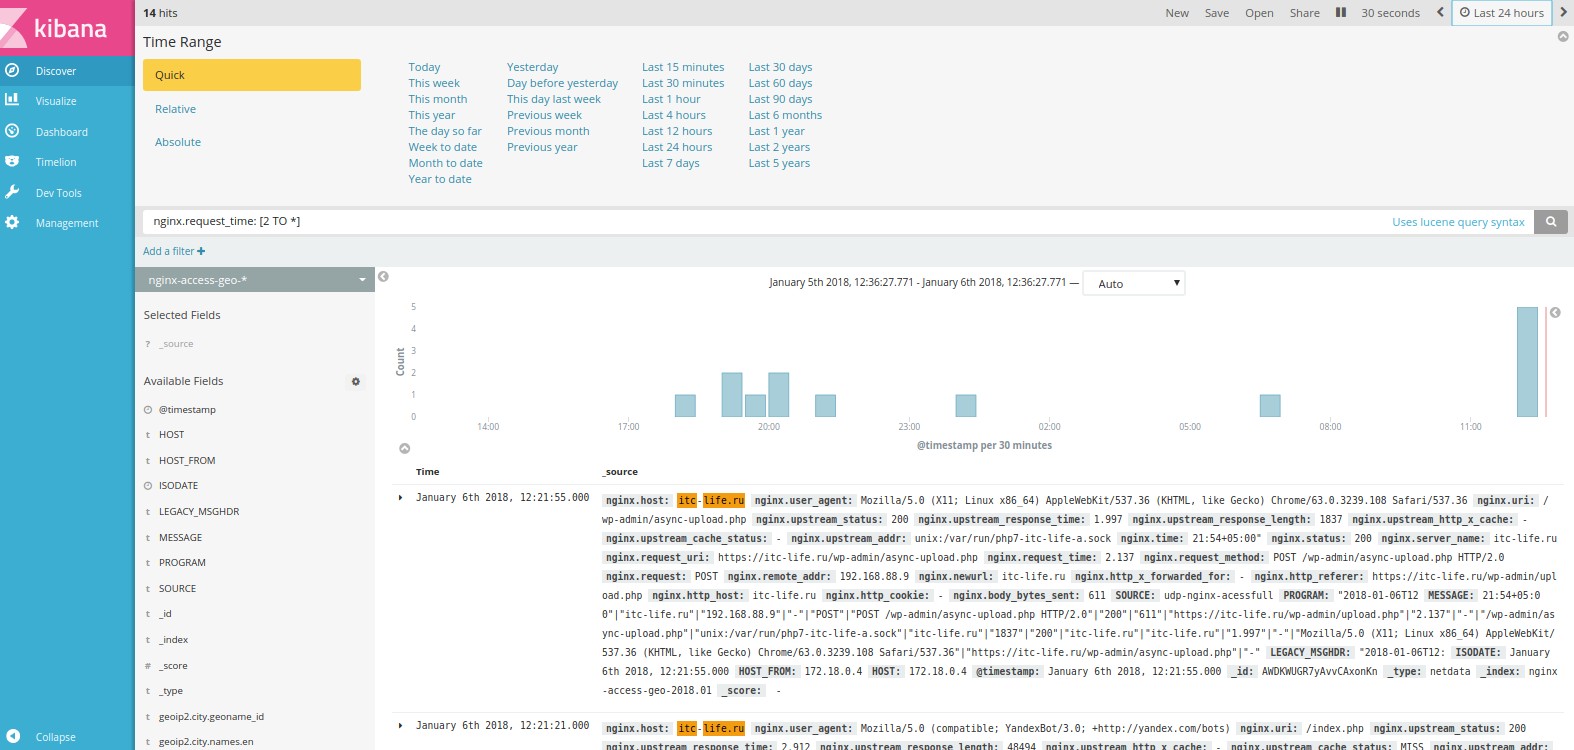
14 (hits).
. json .
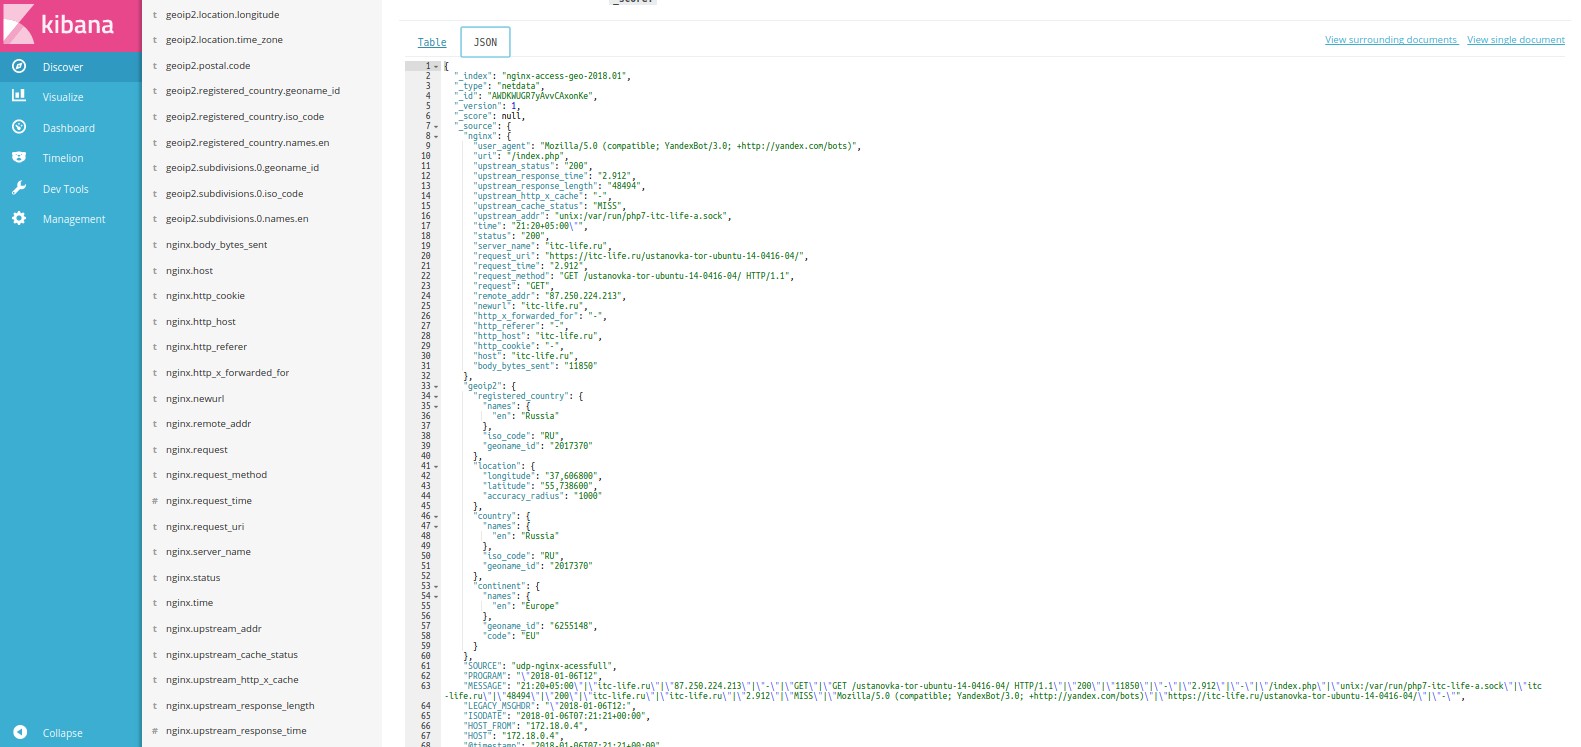
, ( ). :
curl 'http://elasticnode1:9200/_cat/indices?v' :
health status index uuid pri rep docs.count docs.deleted store.size pri.store.size yellow open nginxerror-2018.01.03 jQVq1YWrSayxJ-zAeOeNKA 5 1 24 0 165.1kb 165.1kb yellow open nginxerror-2018.01.05 dJ0D2ronQWiGcCjj_jVNHg 5 1 96 0 183.9kb 183.9kb yellow open kern-2018.01 URAOk3_GRX6MMZfW8hLPbA 5 1 4196 0 1.5mb 1.5mb yellow open messages-2018.01 DiU8IEV2RseZ2mQNx2CJxA 5 1 4332 0 1.5mb 1.5mb yellow open syslog-2018.01 de2SOs8KRBGNkfd1ja4Mmg 5 1 38783 0 26.1mb 26.1mb yellow open .kibana jLUuELr-TRGSVr5JzPX52w 1 1 5 0 44.6kb 44.6kb yellow open error-2018.01 cnD8VeGkQa2n8HRTnC74SQ 5 1 671 0 438.6kb 438.6kb yellow open nginxerror-2018.01.06 z1eT1JC1QLC0AqyIQoj9ng 5 1 47 0 214.6kb 214.6kb yellow open nginx-access-geo 41WmT6BARUiQNjuahFhe1g 5 1 8583 0 14mb 14mb yellow open syslog-ng hE37Hu2JRd-lyJaq7nDh-A 5 1 52 0 197.2kb 197.2kb yellow open nginx-access-geo-2018.01 MfinD9z7SB-vIMRZcXJevw 5 1 2676 0 6mb 6mb yellow open debug-2018.01 SwxEA6sSQjGSMBm6FcyAww 5 1 507 0 362.3kb 362.3kb yellow open crons-2018.01 MOJetHGjQs-Gd3Vmg5kxHw 5 1 111 0 149.7kb 149.7kb yellow open user-2018.01 zbRxNpGsShWwz43LXjPaAw 5 1 571 0 392kb 392kb yellow open auth-2018.01 shHvBE8GSdCi2CIjTxNovg 5 1 468 0 370.8kb 370.8kb yellow open daemon-2018.01 p97FQLBHTbyy-sM23oJpWQ 5 1 33754 0 25.1mb 25.1mb yellow open nginxerror-2018.01.04 dJ-bnpNIQ328iudAVTg43A 5 1 109 0 170.5kb 170.5kb yellow open info-2018.01 bQp1i6YwQoGOvv1aJCjudA 5 1 36267 0 26.7mb 26.7mb auth-*, , sudo .
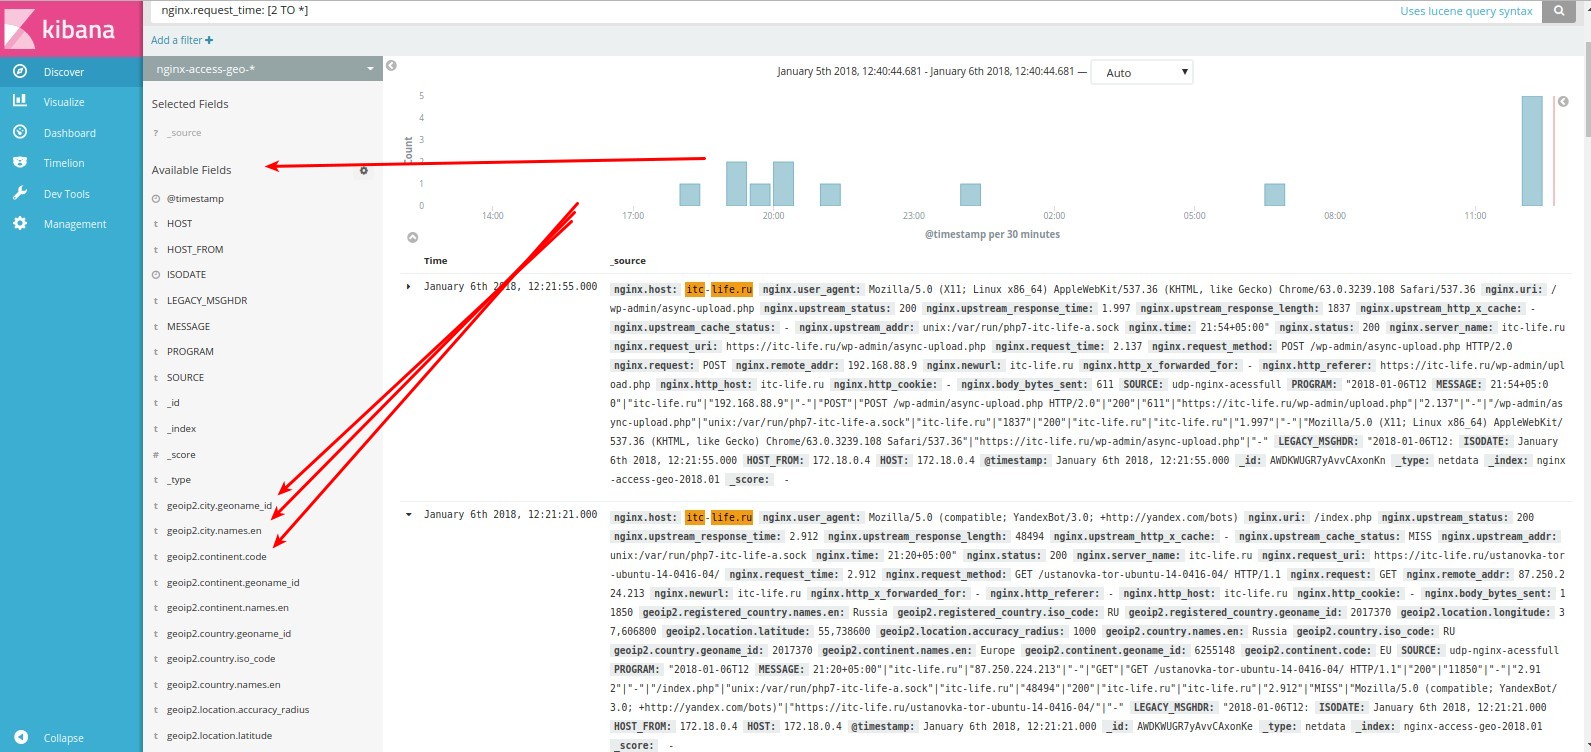
, .
.
kibana .
kibana nginx, .
visualize >> new >> line index nginx-access-geo-*
:
- "Metrics" — Y-Axis "Aggregation" >> "Average" "Field" >> "nginx.request_time";
- "Buckets" — X-Axis Aggregation >> Date Histogram Field >> timestamp ;
- "Split series" "Sub Aggregation" >> "Terms" "Field" >> "nginx.http_host.keyword" "Order by ">> "metric: Average nginx.request_time".
"Apply Changes"
.
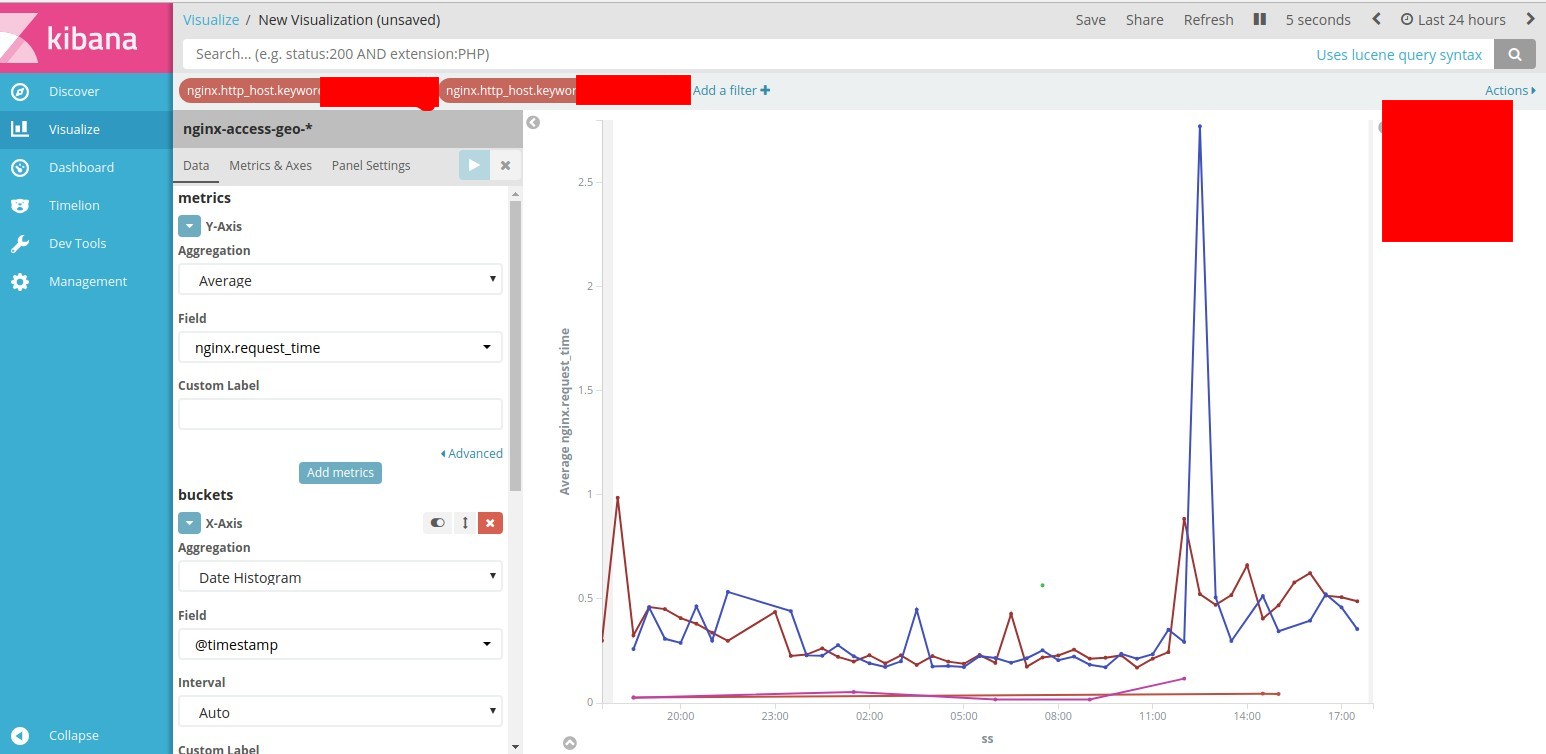
. .
elasticalert .
elasticalert, .
pip install elastalert pip install "elasticsearch>=5.0.0" mkdir -p /etc/elasticalert nano /etc/elasticalert/config.yaml #elastalert-create-index # This is the folder that contains the rule yaml files # Any .yaml file will be loaded as a rule rules_folder: rules # How often ElastAlert will query Elasticsearch # The unit can be anything from weeks to seconds run_every: minutes: 1 # ElastAlert will buffer results from the most recent # period of time, in case some log sources are not in real time buffer_time: minutes: 15 # The Elasticsearch hostname for metadata writeback # Note that every rule can have its own Elasticsearch host es_host: elasticnode1 # The Elasticsearch port es_port: 9200 # The AWS region to use. Set this when using AWS-managed elasticsearch #aws_region: us-east-1 # The AWS profile to use. Use this if you are using an aws-cli profile. # See http://docs.aws.amazon.com/cli/latest/userguide/cli-chap-getting-started.html # for details #profile: test # Optional URL prefix for Elasticsearch #es_url_prefix: elasticsearch # Connect with TLS to Elasticsearch #use_ssl: True timestamp_field: "@timestamp" #timestamp_field: timestamp # Verify TLS certificates #verify_certs: True # GET request with body is the default option for Elasticsearch. # If it fails for some reason, you can pass 'GET', 'POST' or 'source'. # See http://elasticsearch-py.readthedocs.io/en/master/connection.html?highlight=send_get_body_as#transport # for details #es_send_get_body_as: GET # Option basic-auth username and password for Elasticsearch #es_username: someusername #es_password: somepassword # Use SSL authentication with client certificates client_cert must be # a pem file containing both cert and key for client #verify_certs: True #ca_certs: /path/to/cacert.pem #client_cert: /path/to/client_cert.pem #client_key: /path/to/client_key.key # The index on es_host which is used for metadata storage # This can be a unmapped index, but it is recommended that you run # elastalert-create-index to set a mapping writeback_index: elastalert_status # If an alert fails for some reason, ElastAlert will retry # sending the alert until this time period has elapsed alert_time_limit: days: 2 telegram_bot_token: ___ elastalert-create-index, .
elastalert-create-index mkdir -p /etc/elastalert/rules nano /etc/elastalert/rules/example_frequency.yaml name: status_502 # Type of alert. type: frequency # Index to search, wildcard supported index: nginx-access-geo-* # Alert when this many documents matching the query occur within a timeframe num_events: 20 # num_events must occur within this amount of time to trigger an alert timeframe: minutes: 2 # (Required) # A list of Elasticsearch filters used for find events # These filters are joined with AND and nested in a filtered query # For more info: http://www.elasticsearch.org/guide/en/elasticsearch/reference/current/query-dsl.html timestamp_field: ISODATE filter: #- term: # status: "200" - query: query_string: query: "HOST_FROM: \"10.12.1.39\" AND nginx.status: 502 AND nginx.request_method: GET" #realert which is the minimum time between two alerts for the same rule. realert: minutes: 0 #You can also prevent duplicates based on a certain field by using query_key. #realert: #hours: 8 #query_key: user # The alert is use when a match is found alert: - "telegram" telegram_room_id: "__id" nginx-access-geo-*, nginx.status 502 10.12.1.39 GET 20 2 .
We try.
elasticalert
cd /etc/elastalert/ && python -m elastalert.elastalert --verbose 502 :
INFO:elastalert:Ran status_502 from 2018-01-06 20:26 Asia to 2018-01-06 20:29 Asia: 22 query hits (10 already seen), 1 matches, 1 alerts sent INFO:elastalert:Sleeping for 58.142215 seconds .
name: Hight-response-time-site-check type: metric_aggregation index: nginxaccessgeoip2-* timestamp_field: ISODATE doc_type: nginxaccess max_threshold: 20 run_every: minutes: 1 buffer_time: minutes: 1 aggregation: minutes: 1 bucket_interval: minutes: 1 metric_agg_key: nginx.upstream_response_time metric_agg_type: avg filter: - query: query_string: query: "HOST_FROM: \"10.9.3.6\" AND nginx.http_host: \"itc-life.ru\" AND nginx.status: 200 AND nginx.request_method: GET" #filter: #- term: #truncated: true ### max_threshold: 0.2 ### alert: - "email" - "telegram" email: - "_" telegram_room_id: "-__" Check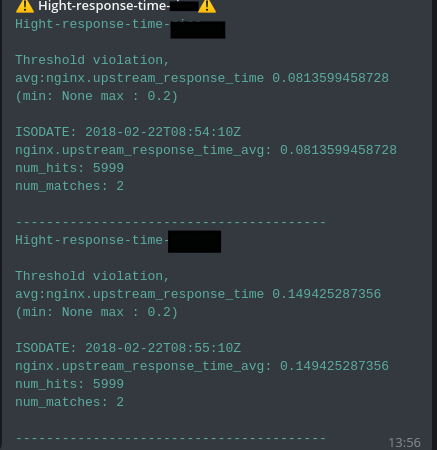
Everything is working.
elasticalert :
https://github.com/Yelp/elastalert
.
— docker-compose
https://github.com/galushkoav/ESKG
elasticsearch.
elasticsearch
curl 'http://elasticnode1:9200/_cat/indices?v' elasticsearch
curl -X DELETE 'http://elasticnode1:9200/nginx-access-geo-2018.01' wildcard elasticsearch
curl -X DELETE 'http://elasticnode1:9200/nginx-access-geo-*' elasticsearch
curl -X GET 'http://elasticnode1:9200/nginx-access-geo-2018.01' elasticsearch. , . eildcard nginx-access-geo-*
curl -XPUT "http://127.0.0.1:9200/_template/nginxaccess_per_index" -d \ ' { "template" : "nginx-access-geo-*", "mappings" : { "_default_" : { "properties" : { "nginx" : { "properties" : { "request_time": {"type": "integer","ignore_malformed": true}, "upstream_response_time": {"type": "integer","ignore_malformed": true}, "remote_addr": {"type": "ip"}, "status": {"type": "integer","ignore_malformed": true}, "body_bytes_sent": {"type": "integer","ignore_malformed": true}, "upstream_response_length": {"type": "integer","ignore_malformed": true}, "request_uri": {"type": "text","fields": {"keyword": {"type": "keyword"} } } } }, "geoip2" : { "properties" : { "location2" : {"type" : "geo_point"} } } } } } } } ' elasticsearch6
curl -H "Content-Type: application/json" -XPUT "http://127.0.0.1:9200/_template/nginxaccess_per_index" -d \ ' { "template" : "nginxaccess-*", "mappings" : { "_doc" : { "properties" : { "nginx" : { "properties" : { "request_time": {"type": "integer","ignore_malformed": true}, "upstream_response_time": {"type": "integer","ignore_malformed": true}, "http_x_forwarded_for": {"type": "ip"}, "remote_addr": {"type": "ip"}, "status": {"type": "integer","ignore_malformed": true}, "body_bytes_sent": {"type": "integer","ignore_malformed": true}, "upstream_response_length": {"type": "integer","ignore_malformed": true}, "request_uri": {"type": "text","fields": {"keyword": {"type": "keyword"} } } } }, "geoip2" : { "properties" : { "location2" : {"type" : "geo_point"} } } } } } } } ' https://www.balabit.com/documents/syslog-ng-ose-latest-guides/en/syslog-ng-ose-guide-admin/html/geoip2-parser.html
https://itc-life.ru/centralizovannyj-sbor-i-analiz-logovo-s-pomoshhyu-syslog-ngtd-agentelasticsearchkibanagrafanaelasticalert/
https://www.balabit.com/documents/syslog-ng-ose-latest-guides/en/syslog-ng-ose-guide-admin/html/ch15s03s02.html
')
Source: https://habr.com/ru/post/345968/
All Articles