Simple system monitor on Flask
Hi, Habr!
Recently there was a need to make a simple and extensible system usage monitor for a Debian server. I wanted to build charts and observe in real time the use of memory, disks and so on. I found a lot of ready-made solutions, but in the end I made a python + Flask + psutil script. It turned out very simple and functional. You can easily add new modules.
')
UPDATE: the article is corrected and supplemented with comments in the comments.
First make a small configuration file for configuration.
Let's write a monitor that will collect the data we need on a timer.
In the example - free disk space and available memory.
And the model itself, which implements the modules. Any functionality can be added here, later I added the availability of services to the intranet (ping).
To build time schedules, we take data from the monitor (see above).
We proceed to the creation of a web server and make a template for displaying a page that will use data from the model.
Finally, add the server startup script to Flask at the address from the settings.
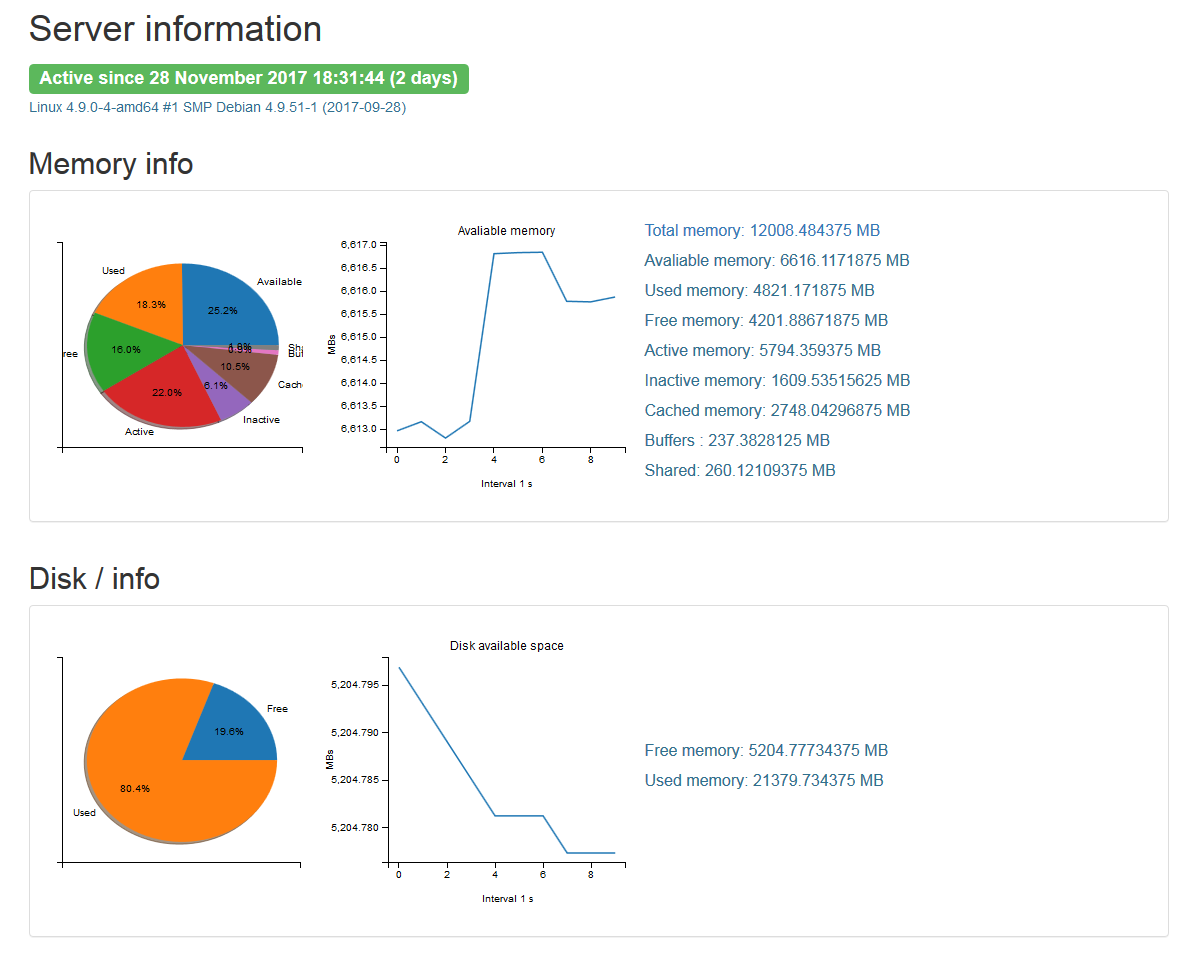
That's all. Running the script, you can see the graphs and charts.
All code, as usual, on github .
Tested on windows and linux.
Any improvements and suggestions are welcome.
Recently there was a need to make a simple and extensible system usage monitor for a Debian server. I wanted to build charts and observe in real time the use of memory, disks and so on. I found a lot of ready-made solutions, but in the end I made a python + Flask + psutil script. It turned out very simple and functional. You can easily add new modules.
')
UPDATE: the article is corrected and supplemented with comments in the comments.
First make a small configuration file for configuration.
Several settings for the monitor
# configuration for server monitor #general info version = 1.0 # web server info server_name = "monitor" server_port = 10000 server_host = "localhost" #monitoring time_step = 1 #s max_items_count = 100 #display fig_hw = 3 Let's write a monitor that will collect the data we need on a timer.
In the example - free disk space and available memory.
import threading import time import psutil from conf import config as cfg import datetime mem_info = list() disk_usage = list() def timer_thread(): while True: time.sleep(cfg.time_step) mi = psutil.virtual_memory() if mem_info.__len__() >= cfg.max_items_count: mem_info.pop(0) if disk_usage.__len__() >= cfg.max_items_count: disk_usage.pop(0) di = list() for dp in psutil.disk_partitions(): try: du = psutil.disk_usage(dp.mountpoint) except: continue di.append(du.free / 1024 / 1024) mem_info.append([mi.available / 1024 / 1024]) disk_usage.append(di) def start(): t = threading.Thread(target=timer_thread, name="Monitor", args=(), daemon=True) t.start() And the model itself, which implements the modules. Any functionality can be added here, later I added the availability of services to the intranet (ping).
To build time schedules, we take data from the monitor (see above).
Display modules on the page
import matplotlib matplotlib.use('agg') import psutil, datetime import mpld3 from jinja2 import Markup from conf import config as cfg import platform from matplotlib import pyplot as plt import numpy from lib import timemon from operator import itemgetter def get_blocks(): blocks = list() get_mem_info(blocks) get_disks_usage(blocks) return blocks def get_mem_info(blocks): fig = plt.figure(figsize=(2 * cfg.fig_hw, cfg.fig_hw)) plt.subplot(121) mem = psutil.virtual_memory() labels = ['Available', 'Used', 'Free'] fracs = [mem.available, mem.used, mem.free] lines = list() lines.append(str.format('Avaliable memory: {0} MB',mem.available)) lines.append(str.format('Used memory: {0} MB', mem.used)) lines.append( str.format('Free memory: {0} MB', mem.free)) if psutil.LINUX: labels = numpy.hstack((labels, ['Active', 'Inactive', 'Cached', 'Buffers', 'Shared'])) fracs = numpy.hstack((fracs, [mem.active, mem.inactive, mem.cached, mem.buffers, mem.shared])) lines.append(str.format('Active memory: {0} MB', mem.active)) lines.append(str.format('Inactive memory: {0} MB', mem.inactive)) lines.append(str.format('Cached memory: {0} MB', mem.cached)) lines.append(str.format('Buffers memory: {0} MB', mem.buffers)) lines.append(str.format('Shared memory: {0} MB', mem.shared)) plt.pie(fracs, labels=labels, shadow=True, autopct='%1.1f%%') plt.subplot(122) plt.plot(timemon.mem_info) plt.ylabel('MBs') plt.xlabel(str.format('Interval {0} s', cfg.time_step)) plt.title('Avaliable memory') plt.tight_layout() graph = mpld3.fig_to_html(fig) blocks.append({ 'title': 'Memory info', 'graph': Markup(graph), 'data': { 'primary' : str.format("Total memory: {0} MB", mem.total / 1024 / 1024), 'lines' : lines } }) print( blocks) def get_disks_usage(blocks): num = 0 for dp in psutil.disk_partitions(): fig = plt.figure(figsize=(2 * cfg.fig_hw, cfg.fig_hw)) plt.subplot(121) try: di = psutil.disk_usage(dp.mountpoint) # gets error on Windows, just continue anyway except: continue labels = ['Free', 'Used', ] fracs = [di.free, di.used] plt.pie(fracs, labels=labels, shadow=True, autopct='%1.1f%%') plt.subplot(122) plt.plot(list(map(itemgetter(num), timemon.disk_usage))) plt.ylabel('MBs') plt.xlabel(str.format('Interval {0} s', cfg.time_step)) plt.title('Disk available space') plt.tight_layout() graph = mpld3.fig_to_html(fig) blocks.append({ 'title': str.format('Disk {0} info', dp.mountpoint), 'graph': Markup(graph), 'data': { 'primary': '', 'lines': [ str.format('Free memory: {0} MB', di.free / 1024 / 1024), str.format('Used memory: {0} MB', di.used / 1024 / 1024) ] } }) num = num + 1 We proceed to the creation of a web server and make a template for displaying a page that will use data from the model.
<!DOCTYPE html> <html lang="en"> <head> <meta charset="UTF-8"> <link rel="stylesheet" href="https://maxcdn.bootstrapcdn.com/bootstrap/3.3.7/css/bootstrap.min.css"> <title> Server monitor v. {{ script_version }} </title> </head> <body> <div class="container"> <H1> Server information </H1> <H3> <span class="label label-success"> Active since {{ active_since }} ({{ days_active }} days) </span> </H3> <p class="text-info"> {{ system }} {{ release }} {{ version }} </p> </div> {% for block in blocks %} <div class="container"> <H2> {{ block.title }} </H2> <div class="panel panel-default"> <div class="panel-body"> <table> <tr> <td> {{ block.graph }} </td> <td> <div class = "container"> <p class="text-primary"> {{ block.data.primary }} </p> {% for line in block.data.lines %} <p class="text-info"> {{ line }} </p> {% endfor %} </div> </td> </tr> </table> </div> </div> </div> {% endfor %} </body> </html> Finally, add the server startup script to Flask at the address from the settings.
#!/usr/bin/python3 from flask import * from conf import config as cfg from lib import timemon as tm from lib import info import psutil import datetime import platform # server health monitoring tool app = Flask(cfg.server_name) @app.route('/') def index(): active_since = datetime.datetime.fromtimestamp(psutil.boot_time()) return render_template("index.html", script_version=cfg.version, active_since=active_since, days_active=(datetime.datetime.now() - active_since).days, system=platform.system(), release=platform.release(), version=platform.version(), blocks=info.get_blocks()) print("Starting time monitor for", cfg.time_step, "s period") tm.start() print("Starting web server", cfg.server_name, "at", cfg.server_host, ":", cfg.server_port) app.run(port=cfg.server_port, host=cfg.server_host) That's all. Running the script, you can see the graphs and charts.
All code, as usual, on github .
Tested on windows and linux.
Any improvements and suggestions are welcome.
Source: https://habr.com/ru/post/345848/
All Articles