Machine training in sewers (in a good way)
Sewage ... It would seem that there may be related to technology. Well, maybe some kind of pollution sensor. But it turns out, no. Everything is much more interesting. Indeed, machine learning helps to identify anomalies and deviations in the wastewater control system. Details under the cut!

The following code example presents an innovative method for detecting anomalies and expected deviations using the Microsoft Anomaly Detection API and binary classification that supports filtering of time series.
')
Carl Data Solutions develops Flow Works software tools used by municipal organizations to monitor wastewater infrastructure. These tools receive data from a variety of sensors that measure indicators such as water consumption, speed and depth.
Sensors sometimes fail or behave in an unpredictable manner, which causes deviations of the indicators. Since prognostic models are created on the basis of readings obtained from sensors, their deviations can reduce the accuracy of the model. Currently, municipal organizations using Carl Data Flow Works tools resort to the services of consultants who manually check data from all sensors and change the values that appear to be erroneous to eliminate such inaccuracies.
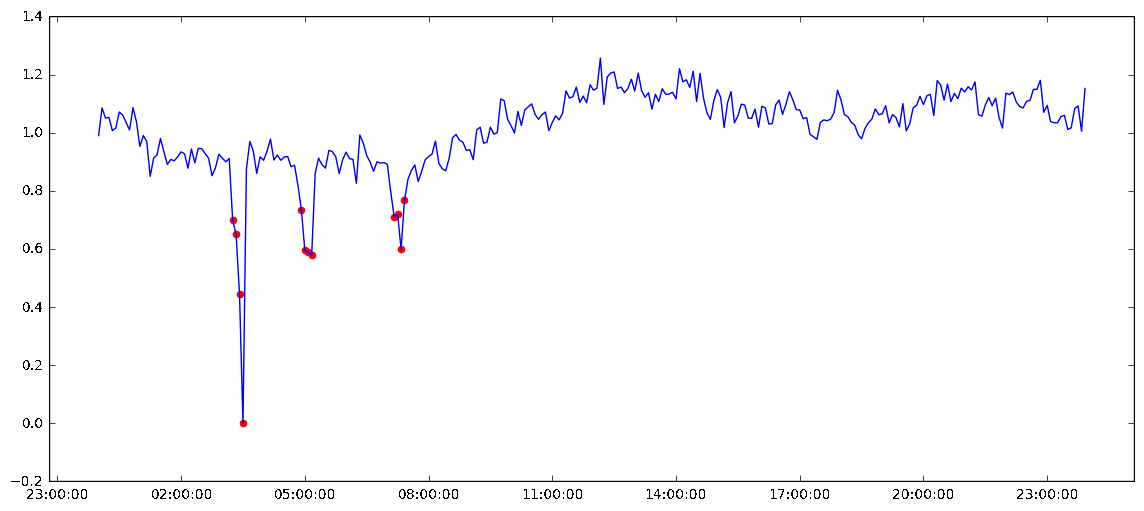
Sample daily meter readings with marked anomalies
To avoid additional time and cost, Carl Data decided to create an anomaly detection model that would automate the detection of such errors.
Since sensor errors occur infrequently, the training sets that are based on the logs selected by Carl Data contained much more “accurate” values than “inaccurate” ones. In case of uneven distribution of training samples, traditional binary classifiers in some cases may not detect sensor errors due to the large number of positive examples. Often, uncontrolled algorithms for detecting deviations of dynamic series are used to detect irregular flow.
However, uncontrolled deviation detection systems such as the Twitter Anomaly Detection Package or Microsoft Anomaly Detection API , although coping with the task of detecting irregular flows, still cannot distinguish the expected deviations in behavior (for example, peak values in the event of flooding) from sensor errors. In addition, these APIs only perform batch classification, which takes too much time to work effectively in real time.
Microsoft is helping Carl Data develop an anomaly detection model that can identify various types of abnormalities and transfer it to the production environment via event concentrators and PowerBI.
Model 1. Deviation detection (unsupervised algorithm)
Model 2. Binary Classifier (Controlled)
Model 3. Hybrid classifier (differentiation of anomalies and deviations)

In the process of interaction, we created three models, combining the Microsoft Anomaly Detection API with a set of random forests and logistic regression to reveal a sensor error.
Although the Anomaly Detection API reveals identifier deviations in order to classify anomalies, in the Carl Data dataset the difference between anomalies and a regular flow was linearly differentiable enough to obtain a comparable qualitative result when using a binary random forest classifier, and in combination with the Anomaly Detection API .
In some cases, analysts can manually tag as abnormal values within the abnormal peak of the sensor. Anomaly Detection API cannot correctly label such values. However, if the sensor error is presented more clearly and the anomalies are not sufficiently linearly differentiable, the hybrid method gives more generalized results than using only the binary classifier.
The selected model has the following performance characteristics with a high degree of accuracy (99%) and full return (100%):
Measuring model performance using the SciKit performance test module

For source code and notes on using the described method, see GitHub .
The technique outlined in this code example is important from the point of view of the application of machine learning of time series in such sparsely covered areas as wastewater control.
In addition, as the Internet of Things develops and the transition from data aggregation to predictive analytics, it becomes increasingly important to distinguish between anomalies caused by sensor errors and anomalies representing expected deviations. The approach outlined in this code example is recommended in these cases.
Overview
The following code example presents an innovative method for detecting anomalies and expected deviations using the Microsoft Anomaly Detection API and binary classification that supports filtering of time series.
')
Situation
Carl Data Solutions develops Flow Works software tools used by municipal organizations to monitor wastewater infrastructure. These tools receive data from a variety of sensors that measure indicators such as water consumption, speed and depth.
Sensors sometimes fail or behave in an unpredictable manner, which causes deviations of the indicators. Since prognostic models are created on the basis of readings obtained from sensors, their deviations can reduce the accuracy of the model. Currently, municipal organizations using Carl Data Flow Works tools resort to the services of consultants who manually check data from all sensors and change the values that appear to be erroneous to eliminate such inaccuracies.
Sample daily meter readings with marked anomalies
To avoid additional time and cost, Carl Data decided to create an anomaly detection model that would automate the detection of such errors.
Problem
Since sensor errors occur infrequently, the training sets that are based on the logs selected by Carl Data contained much more “accurate” values than “inaccurate” ones. In case of uneven distribution of training samples, traditional binary classifiers in some cases may not detect sensor errors due to the large number of positive examples. Often, uncontrolled algorithms for detecting deviations of dynamic series are used to detect irregular flow.
However, uncontrolled deviation detection systems such as the Twitter Anomaly Detection Package or Microsoft Anomaly Detection API , although coping with the task of detecting irregular flows, still cannot distinguish the expected deviations in behavior (for example, peak values in the event of flooding) from sensor errors. In addition, these APIs only perform batch classification, which takes too much time to work effectively in real time.
Interaction
Microsoft is helping Carl Data develop an anomaly detection model that can identify various types of abnormalities and transfer it to the production environment via event concentrators and PowerBI.
Anomaly detection method of machine learning
Model 1. Deviation detection (unsupervised algorithm)
- Read the raw statistics from the speed sensor.
- Read the tagged anomalies from the selected data for the speed sensor.
- Send the raw data to the Microsoft Anomaly Detection API to mark deviations.
- Evaluate the deviation model based on the results of the Anomaly Detection API, comparing the results obtained with its help with “manual anomalies”.
Model 2. Binary Classifier (Controlled)
- Read the raw statistics from the speed sensor.
- Read and merge the tagged anomalies from the selected data for the speed sensor.
- Create a history window for the previous four readings based on data from the speed sensor at each point in time.
- Create a training and test set by randomly separating data in the history windows.
- Teach a random forest classifier using training data.
- Measure the performance of a random forest based on test data.
Model 3. Hybrid classifier (differentiation of anomalies and deviations)
- Read the raw statistics from the speed sensor.
- Read the tagged anomalies from the selected data for the speed sensor.
- Send the raw data to the Microsoft Anomaly Detection API to mark deviations.
- Create a history window for the four previous values of the readings obtained from the speed sensor for each moment in time, using only the values marked as deviations.
- Create a training and test set by randomly separating data in the history windows.
- Teach a random forest classifier using training data.
- Measure the performance of a random forest based on test data.
- Measure the performance of a random forest for the entire dynamic speed range except for the training set.
Integration method
- Transfer data from the channel to the Anomaly Detection event hub by setting the window size to n.
- Mark new events as “anomaly” or “not anomaly” using the model described in the last section.
- Transfer the tagged channel data to the visualization event hub.
- Use stream analytics to process data from a visualization event hub.
- Import stream analytics data into PowerBI to visualize the tagged anomalies.
results
In the process of interaction, we created three models, combining the Microsoft Anomaly Detection API with a set of random forests and logistic regression to reveal a sensor error.
Although the Anomaly Detection API reveals identifier deviations in order to classify anomalies, in the Carl Data dataset the difference between anomalies and a regular flow was linearly differentiable enough to obtain a comparable qualitative result when using a binary random forest classifier, and in combination with the Anomaly Detection API .
In some cases, analysts can manually tag as abnormal values within the abnormal peak of the sensor. Anomaly Detection API cannot correctly label such values. However, if the sensor error is presented more clearly and the anomalies are not sufficiently linearly differentiable, the hybrid method gives more generalized results than using only the binary classifier.
The selected model has the following performance characteristics with a high degree of accuracy (99%) and full return (100%):
Measuring model performance using the SciKit performance test module
Code
For source code and notes on using the described method, see GitHub .
Use cases
The technique outlined in this code example is important from the point of view of the application of machine learning of time series in such sparsely covered areas as wastewater control.
In addition, as the Internet of Things develops and the transition from data aggregation to predictive analytics, it becomes increasingly important to distinguish between anomalies caused by sensor errors and anomalies representing expected deviations. The approach outlined in this code example is recommended in these cases.
Source: https://habr.com/ru/post/345442/
All Articles