Analyzing access logs using Splunk
If you have an Access Control System or, in other words, an ACS, but you do not know how you can get useful information from the data that this system generates, then this article will be useful to you.

Today we will talk about how with the help of Splunk, which we talked about earlier , you can get analytics on the results of ACS activities, and also why it is needed.
First, we will make a few comments on what the ACS is and where we are meeting with it. ACS is a system for limiting and registering people’s entry and exit or transportation in a given area through all “points of passage”, for example, doors, gates, turnstiles, checkpoints, and so on.
')
As a result of each “passage”, the system is left with a record of who, when, where and where it went from. We will load and process this data in Splunk.
Some ACSs write a fairly unstructured log, and with the help of Splunk it is possible even to sort such a log in automatic mode. In addition, Splunk automatically collects and stores data, and also allows you to quickly get analytics in a mode close to real time.
First, we will look at the visualization of the results, and then we will go deeper into how it was received and consider several queries.
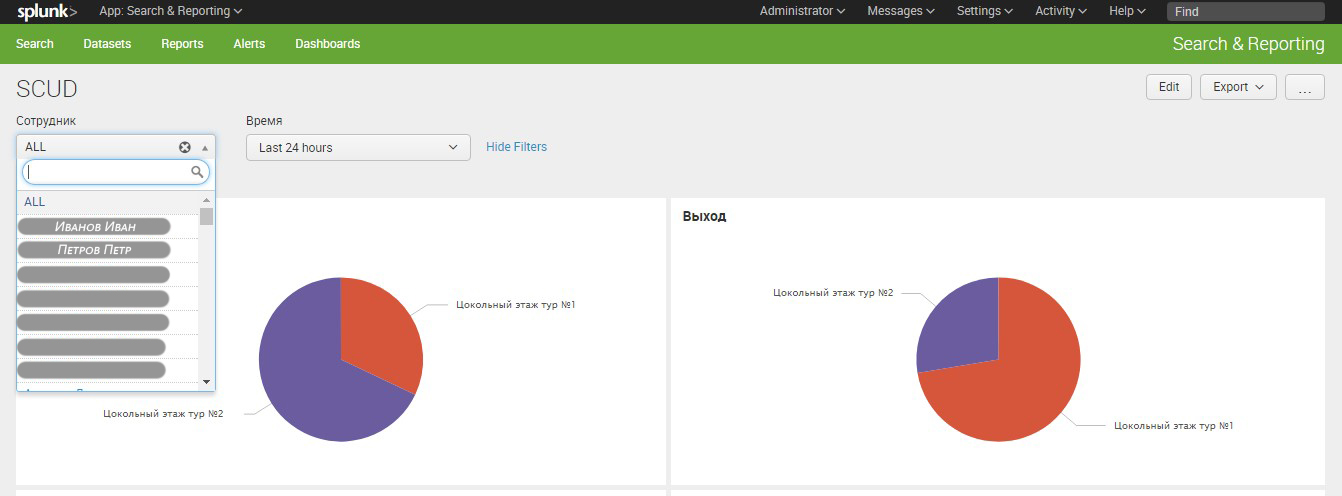
You can provide visualization in the context of the entire organization or in the context of each employee.
This figure shows pie charts showing through which access points employees enter and exit.
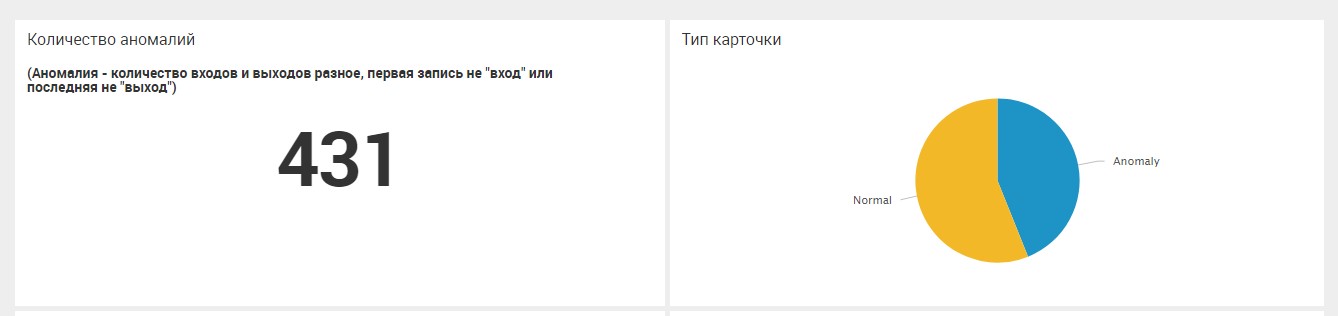
Also, you can notice the anomalous behavior of employees, when in one day, one pass makes more inputs than exits or vice versa.
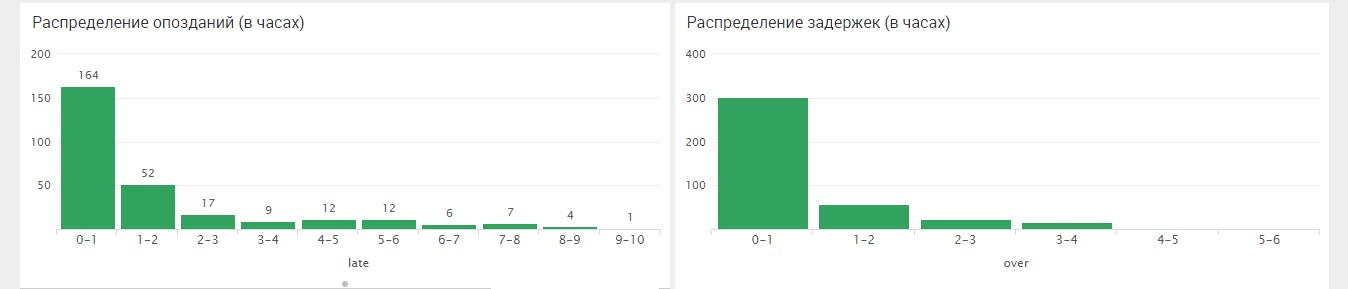
It is possible to build histograms of lateness and work beyond the schedule, i.e. how many times the staff were late / processed a day in less than an hour, from an hour to two hours, from two to three, etc.
The figure below shows the statistics for the departments: the average lateness of the staff of the department, the average time spent outside working hours. As well as the duration (if the statistics for one day) or the average duration of each employee.


In general, it is possible to get a lot of useful information from the ACS data; what was presented above is just an example that can be customized to fit everyone’s needs. As for the license for Splunk, since the amount of data per day is small, you can get by with a free license.
We are happy to answer all your questions and comments on this topic. Also, if you are interested in something specifically in this area, or in the field of machine data analysis in general, we are ready to refine the existing solutions for you, for your specific task. To do this, you can write about it in the comments or simply send us a request through the form on our website .
On June 28, 2018, “ Splunk Getting Started ” will be taught in Moscow , where in 6 hours the participants will receive a theoretical base and practical skills for working in Splunk. Learn more about learning and register at this link .
Today we will talk about how with the help of Splunk, which we talked about earlier , you can get analytics on the results of ACS activities, and also why it is needed.
First, we will make a few comments on what the ACS is and where we are meeting with it. ACS is a system for limiting and registering people’s entry and exit or transportation in a given area through all “points of passage”, for example, doors, gates, turnstiles, checkpoints, and so on.
')
As a result of each “passage”, the system is left with a record of who, when, where and where it went from. We will load and process this data in Splunk.
Why Splunk?
Some ACSs write a fairly unstructured log, and with the help of Splunk it is possible even to sort such a log in automatic mode. In addition, Splunk automatically collects and stores data, and also allows you to quickly get analytics in a mode close to real time.
Implementation
First, we will look at the visualization of the results, and then we will go deeper into how it was received and consider several queries.
Visualization
You can provide visualization in the context of the entire organization or in the context of each employee.
This figure shows pie charts showing through which access points employees enter and exit.
Also, you can notice the anomalous behavior of employees, when in one day, one pass makes more inputs than exits or vice versa.
It is possible to build histograms of lateness and work beyond the schedule, i.e. how many times the staff were late / processed a day in less than an hour, from an hour to two hours, from two to three, etc.
The figure below shows the statistics for the departments: the average lateness of the staff of the department, the average time spent outside working hours. As well as the duration (if the statistics for one day) or the average duration of each employee.
Requests
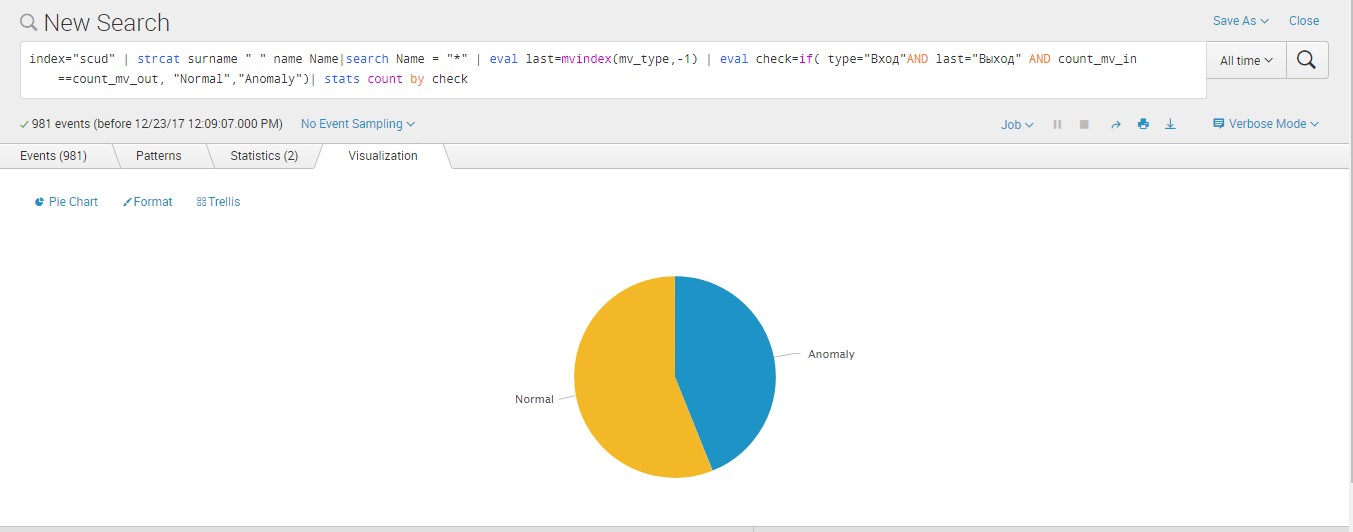
Counting Abnormal Cards
index="scud" | strcat surname " " name Name|search Name = "*" | eval last=mvindex(mv_type,-1) | eval check=if( type=""AND last="" AND count_mv_in==count_mv_out, "Normal","Anomaly")| stats count by checkCalculation of the duration of the working day of each employee
index="scud" | strcat surname " " name Name|search Name = "*"
| eval check=if( type=""AND mvindex(mv_type,-1)="" AND count_mv_in==count_mv_out, "Normal","Anomaly")
| search check=Normal
| eval sec_in=tonumber(substr(in,12,2))*3600 + tonumber(substr(in,15,2))*60+tonumber(substr(in,18,2))
|eval sec_out=tonumber(substr(mvindex(mv_out,-1),12,2))*3600 + tonumber(substr(mvindex(mv_out,-1),15,2))*60+tonumber(substr(mvindex(mv_out,-1),18,2))
| eval duration=round((sec_out-sec_in)/3600,2)| eval h=floor(duration)| eval m=(duration-h)*60| strcat h " " m " " Duration | strcat surname " " name Name|
table Name Duration | sort - Duration
Conclusion
In general, it is possible to get a lot of useful information from the ACS data; what was presented above is just an example that can be customized to fit everyone’s needs. As for the license for Splunk, since the amount of data per day is small, you can get by with a free license.
We are happy to answer all your questions and comments on this topic. Also, if you are interested in something specifically in this area, or in the field of machine data analysis in general, we are ready to refine the existing solutions for you, for your specific task. To do this, you can write about it in the comments or simply send us a request through the form on our website .
PS
On June 28, 2018, “ Splunk Getting Started ” will be taught in Moscow , where in 6 hours the participants will receive a theoretical base and practical skills for working in Splunk. Learn more about learning and register at this link .
Source: https://habr.com/ru/post/345412/
All Articles