Predict outflow using neural network

The problem of predicting customer churn is one of the most widespread in Data Science practice (this is how the use of statistics and machine learning to business problems is now called, do everyone already know?). The problem is quite universal: it is relevant for many industries - telecom, banks, games, streaming services, retail, etc. The need to solve it is quite easy to justify from an economic point of view: there are a lot of articles in business magazines that attract a new client to N times more expensive than keeping old. And its basic formulation is easy to understand so that its example often explains the basics of machine learning.
For us in Plarium-South, as well as for any gaming company, this problem is also relevant. We went a long way through different productions and models and came to a rather original, in our opinion, solution. Is everything as simple as it seems, how to correctly determine the outflow, and why is there a neural network, we will tell under the cat.
')
Outflow? No, have not heard...
We begin, as it should, with the definitions. There is a base of clients who use some services, buy some goods, in our case they play games. At some point, individual customers no longer use the service, leave. This is the outflow. It is assumed that at the moment when the client gives the first signs of care, you can still convince him: hug, tell him how important he is, offer a discount, make a gift. Thus, the primary task is to correctly and timely predict that the client is going to leave.
It may seem that there are two possible values of the target variable: the patient is either alive or dead. Indeed, we are looking for outflow prediction competitions ( cracks , packs , fax ) and everywhere we see the problem of binary classification: objects are users, the target variable is binary. Here you can clearly see the difference between sports data analysis and practical one. In practical analysis, before you solve a problem, you have to set it up, so much so that you can make a profit from its solution. What we do.
Outflow outflow discord
On closer examination, we learn that there are two types of outflows - contractual (non-contractual) and non-contractual. In the first case, the client explicitly says that he is tired and he is leaving. Often this is accompanied by formal actions to terminate the contract, etc. In this case, indeed, it is possible to clearly define when the person is your client, when not. In the non-contractual case, the client does not say anything, does not notify in any way and simply stops using your service, the service, play your game and buy your goods. And, as you may have guessed, the second case is much more common.
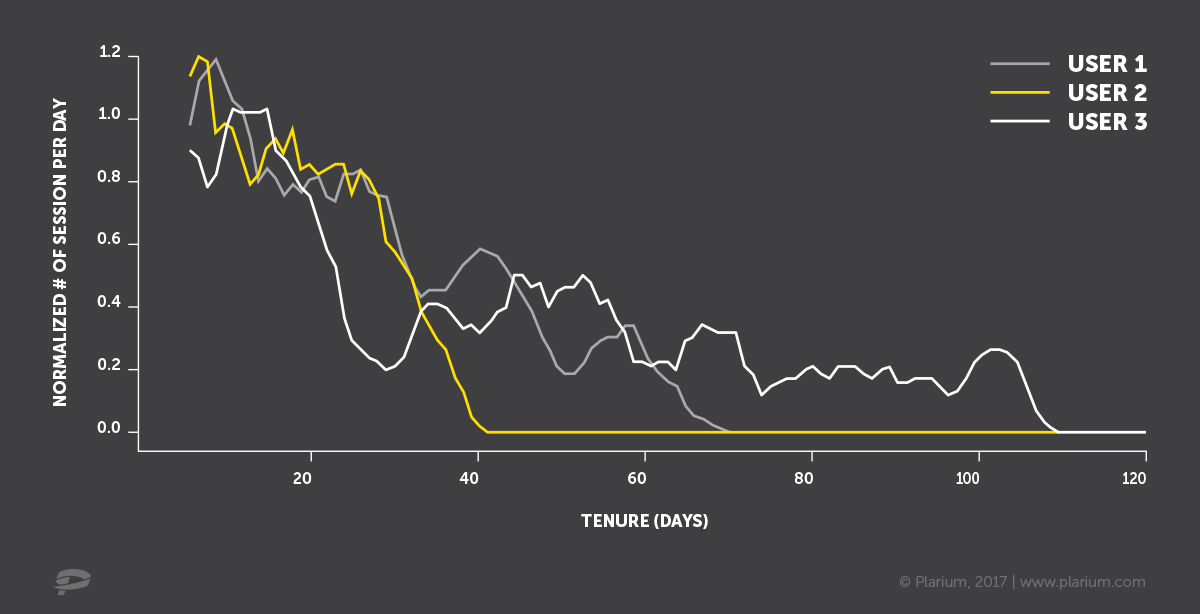
That is, you have in the CRM / database a certain user activity (purchases, visits to the site, calls in the cellular network), which at some point decreases. Notice does not necessarily stop, but changes the intensity significantly.
One size fits all
We represent the days of visits of three hypothetical customers with blue crosses on the time axis. The first thought is to fix a certain period (here it is called Target definition). A certain activity during this period will be considered a manifestation of life, and the lack thereof will be considered a withdrawal. Then, as input for the outflow prediction model, you can take data for the period before the input one.

It may also be prudent to leave a certain buffer between these two periods, for example, 1-2 weeks, in order to learn how to predict outflow in advance, in order to have time to take certain actions to
What is wrong with this approach? It is not clear how to set the parameters correctly. What period to take to determine the target variable. For one client, a three-day absence is an unconditional care, for another - a standard behavior. You say: “Let's take a big interval - a month, a year, two, then exactly everyone will fall”. There may be a problem with historical data, because not all of them are stored for so long. In addition, if we build a model based on data a year ago, it may not be suitable for the current situation. And, besides, to check the result of our model on current data, we have to wait a year. Is it possible not to go deep into history, and even better to do without equalization?
50/50 probability - either gone or not.
If we know the user’s history of visits: how did he behave on average before that, and how long has he been absent now? Can we find the correct statistical distributions and calculate the probability that the user is alive at the moment? It is possible, and it was already done in the Pareto / NBD model as early as 1987, where the time before departure was described by the Pareto distribution (a mixture of exponents with gamma weights), and the distribution of visits / purchases was negative binomial. In 2003, the idea arose to use the beta-geometric instead of the Pareto distribution, and the BG / NBD model appeared, which works faster and often without loss of quality. Both models are worthy of attention, and there are good implementations of both in Python and R. At the entrance, these models take only three values for each user: the number of visits / purchases, the age of the client (time elapsed from the first purchase to the current moment) and time elapsed since the last purchase. With such a poor set of input data, the models work very decently, which means that it is too early to forget teverver, you can still use it in the intervals between how to " stack xgboost ".
And there is still room for improvement. For example, there is seasonality, promotions that affect the statistics of calls - they do not take these models into account. There are other user activity data that may indicate proximity to care. So, at the end a user who was disappointed in the game can waste resources (do not lose the good), disband the army. Data on such behavior can help distinguish a real departure from a temporary absence (vacation in the jungle without the Internet). All these data cannot be “fed” to the probabilistic models described above (although there are respected people who are trying to do this ).
Call neural network
And what if we take and build a neural network, the output of which will be the parameters of distributions? About this there is a master's thesis of a graduate of Gothenburg University and written within it, and a beautifully illustrated package in Python - WTTE-RNN .
The author decided to predict the time until the next call (time to event) using the Weibull distribution and all the power of recurrent neural networks. In addition to the theoretical beauty of the approach, there is also an important practical point: when using recurrent neural networks, there is no need to make a garden with building signs from time series (aggregate the set of series by a set of functions by the set of periods and set of lags) to present the data in the form of a flat table (objects - signs). You can submit time series to the input of the network as is. More on this, we recently talked about during the PiterPy report . This seriously saves computing and time resources. In addition to rows of the same type (for example, by day), you can also submit to the entrance and rows of a different type or length (for example, hourly for the last day), and static user characteristics (gender, country), even though a picture of his portrait (suddenly bald ones leave more often?), neural networks and such are able .
However, it turned out that the learning loss function constructed from Weibull often goes to NaN. In addition, the time until the next call is not so easy to operate. Knowing him does not obviate the need to answer questions, what time before entry to be considered too large, how to calculate thresholds for each user individually and taking into account every seasonality, how to weed out temporary interruptions in activity, etc.
What to do?
Without pretending to the unequivocal correctness of the decision, we will tell you which path we ultimately chose in Plarium-South. We returned to the binary target, calculated it in a tricky way, and took RNN as a model.
Why to binary?
- Because in the end, the business needs him: you need to know when to undertake activity on retention, and when not.
- Because the binary classification metrics (precision, recall, accuracy) are easier to use to explain the results.
- Knowing the cost of retention and the potential profit from the returned client, you can choose a cut-off threshold in terms of maximizing the total profit from the retention campaign.
How do we calculate the target?
- We build a normalized indicator of user activity taking into account his average activity, we cut out the initial periods of inactivity specific to the gaming industry (when I went through advertising, poked a little, and began to actively play after a few weeks), etc.
- We choose the binarization threshold and normalization parameters, maximizing the coincidence with the long-term outflow, that is, the result of binarization most closely corresponds to the absence of activity, for example, in the next year.
- We carry out the periods for training and for calculating the target in order to look a little into the future.
- So we get a binary target, but free from the previously voiced flaws (there is no fixed and uniform for all period, different types of games and other specific features are taken into account).
Why RNN?
- Because it is easier to work with signs based on time series.
- Because the accuracy is very good (ROC-AUC about 0.97).
If the post causes interest, in the next series we will tell more about the model, its architecture, data preparation and technologies that we use.
One more thing
And by the way, whoever is interested in doing such things, we are looking for specialists in the position of Data Scientist and Data Engineer in the Krasnodar office. In addition to the outflow, we also have other interesting tasks (antifraud, recommenders, social graph), a lot of data, resources for everything. And living in Krasnodar is warm and pleasant. :) Please send your CV to hr.team@plarium.com .
Source: https://habr.com/ru/post/345310/
All Articles