How to make an internal product external. Experience team Yandeks.Trekera
Recently, we have opened for external users Yandex.Tracker - our system for managing tasks and processes. In Yandex, it is used not only to create services, but even to purchase cookies in the kitchen.
As you know, the smaller the company, the simpler tools it can use. If you can greet each employee personally in the morning, then even a chat in Telegram is enough for you to work. When individual teams appear, not only will you not be able to greet everyone personally, but you can also get confused in task statuses.

Word cloud in ticket headers in the internal Yandex.Tracker
At this stage, it is important to preserve the transparency of the processes: all parties should have the opportunity at any time to find out about the progress of the task or, for example, leave a comment that does not disappear in the flow of the working chat. For small teams, a tracker is a kind of news feed with the latest news from the life of their company.
Today we will tell Habrahabr readers why Yandex decided to create its own tracker, how it works inside, and what difficulties we had to face when opening it outside.
More than six thousand people are currently working in Yandex. Despite the fact that many of its parts are arranged as independent start-ups with their teams of different sizes, there’s always a need to understand what is happening in the people on the next floor - their work may overlap with yours, their improvements can help you, and some processes, on the contrary can negatively affect yours. In such a situation, it is difficult, for example, to call a colleague from another workspace on Slack. Especially when the transparency of the task is important for many people from different directions.
At some point we started using the well-known Djiru. This is a good tool, the functionality of which, in principle, suited everyone, but it was difficult to integrate it with our internal services. In addition, on a scale of thousands of people who need a single space, where everyone can navigate without a flashlight, Jyra was no longer enough. It happened that she went under load, even though she worked on our servers. Yandex grew, the number of tickets also increased, and updates to new versions took more and more time (the last upgrade took six months). It was necessary to change something.
At the end of 2011, we had several solutions to the problem:
- Increase the performance of the old tracker. They dropped the idea, because redoing the architecture of another product themselves - bad. That would mean at least putting an end to updates.
- Saw the tracker into several independent copies (instances) to reduce the load on each. The idea is not new, it is used by large companies in similar cases. As a result, end-to-end reports, filtering, linking, and transfer of tasks between copies would not work. All this was critical for the company.
- Purchase another tool. Considered the possible options for trackers. Most of them do not allow for easy scaling, that is, the cost of infrastructure improvements and subsequent changes for our needs would be higher than the cost of our own design.
- Write your tracker. Risky option. Gives the most freedom and opportunity in case of success. In the event of failure, we have problems with one of the key development and planning tools. As you may have guessed, we took a chance and chose this option. The expected benefits outweighed the disadvantages and risks.
Development of own tracker began in January 2012. First, the tracker team itself transported its tasks to the new service several months after the start of work on the project. Then the process of moving other teams began. Each team put forward its own requirements for functionality, they were worked out, the tracker gained new features, then transported the team. It took two years to completely move all the teams and close Jira.
But let's go back a little and look at the list of requirements that was compiled for the new service:
- Fault tolerance. As you may have heard , the company regularly conducts exercises with the disconnection of one of the DCs. The service should experience them imperceptibly both for the user and for the team, without the need to perform manual actions at the start of the exercise.
- Scalable. The tasks in the tracker have no statute of limitations. The developer or manager may need to look at the current task, as well as the one that was closed 7 years ago. And this means that we cannot delete or archive old data.
- Integration with the company's internal services. Close cohesion with our numerous services was required by most of the Yandex teams: integration with long-term planning services, version control systems, employee catalogs, etc.
And at the time of collecting the requirements, we decided on the technologies that we will use to create a tracker:
- Java 7 (now 8) for backend.
- Node.js + BEMHTML + i-bem for the frontend.
- MongoDB as the main data storage: automatic failover, good speed and the ability to easily enable sharding, schemaless (convenient for user fields in tasks).
- Elasticsearch for quick search and aggregation on an arbitrary field. Flexible configuration options for analyzers for sadzes, percolator and other elastic buns also played a role in the selection.
- ZooKeeper for discovery backends service. Backends interact with each other to invalidate caches, distribute tasks, and collect their own metrics. With the help of ZooKeeper and the client to it, discovery can be organized very easily.
- File storage as a service, which removes the headache of replication and backups when storing user attachments.
- Hystrix to communicate with external services. To prevent cascading trips, do not load adjacent services if they experience problems.
- Nginx for termination https and rate limits. As practice has shown, to terminate https inside java is not the best idea from the point of view of performance, so we shifted this task to nginx. Rate limiter is also safer to organize on his side.
As with any other public and internal services of Yandex, we also had to think about the requirements for the performance margin and scalability of the service. An example for understanding the situation. At the time of the start of system design, we had about 1 million tasks and 3 thousand users. Today, the service has almost 9 million tasks and more than 6 thousand users.
By the way, despite the fairly decent number of users in the internal tracker, most of the requests come to the tracker via the API from Yandex services integrated with it. It is they who create the main load:
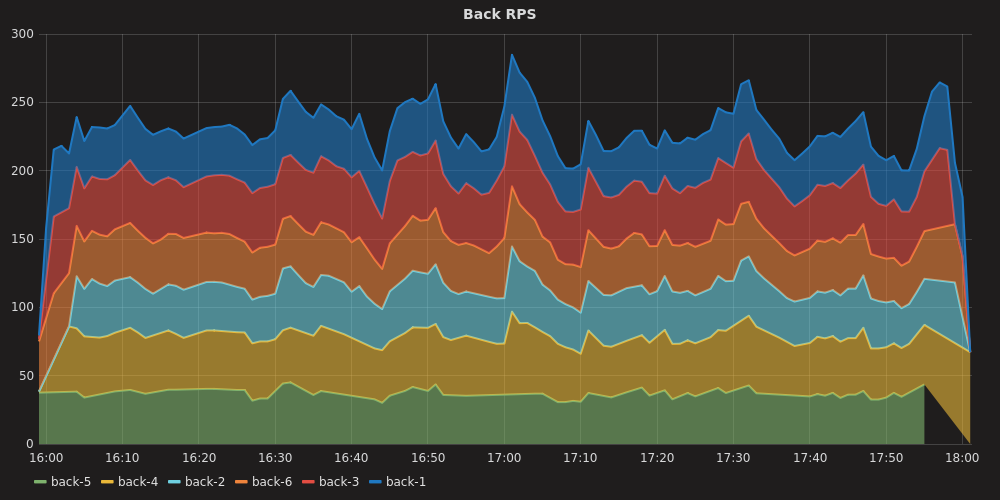
Below you can see the percentages of responses in the middle of the working day:

We try to regularly evaluate future service load. We build the forecast for 1-2 years, then with the help of Lunapark we check that the service will withstand it:

This graph shows that the task search API starts giving out a noticeable number of errors only after 500-600 rps. This made it possible to estimate that, taking into account the growing load from internal customers and the growth in the amount of data, we will withstand the load after 2 years.
In addition to the high load of the service, other unpleasant stories can happen, which you should be able to handle so that users do not notice this. We list some of them.
Data center failure.
A very unpleasant situation, which nevertheless occurs regularly due to the teachings. What happens with this? The worst case is when the master monga was in a disconnected DC. But even in this case, no intervention by the developer or admin is required due to automatic failover. In elastica, the situation is slightly different: part of the data was in a single copy because the replication factor is 1. Therefore, it creates new shards on the surviving nodes so that all shards have a backup copy again. Meanwhile, the balancer over the backend receives a timeout of connections in those requests that were executed on the instances in the disabled DC, or an error from the running backend, whose request went to the missing DC and did not return. Depending on the circumstances, the balancer may try to repeat the request or return an error to the user. But in the end, the balancer will understand that the instances from the disconnected DC are unavailable to him and will stop sending requests there, checking in the background whether the DC did not work and whether it is time to return the load there.Loss of connectivity between backend and base / index due to network issues.
Slightly simpler situation at first glance. Since the balancer over the backend regularly checks its state, the situation when the backend cannot reach the base pops up very quickly. And the balancer again removes the load from this backend. There is a danger that if all backends lose connection with the base, they will all be closed, which ultimately will affect 100% of requests.- High load requests in the search tracker.
Search by tasks, their filtering, sorting and aggregation are very time-consuming operations. Therefore, it is this part of the API that has the strictest load limits. Previously, we manually found those who filled us with requests and asked them to reduce the load. Now this is happening more and more, so the inclusion of rate limits made it possible not to notice an excessively active API client.
Yandex.Tracker - for all
Other companies were interested in our service more than once - they learned about our internal tool from those who left Yandex, but could not forget the Tracker. And last year inside we decided to prepare Tracker for going out into the world - to make a product out of it for other companies.
We immediately began to work out the architecture. We faced a big challenge in scaling the service to hundreds of thousands of organizations. Prior to this, the service was developed over the years for one of our companies, taking into account only its needs and nuances. It became clear that the current architecture will require strong improvements.
As a result, we had two solutions.
| Separate instances for each organization | An instance that can take in thousands of organizations |
Pros:
Minuses:
| Pros:
Minuses:
|
Obviously, the stability of the service for external users is no less important than for internal ones, so it is necessary to duplicate databases, search, backend and frontend in several data centers. This made the first option much more difficult to maintain - there were many points of failure. Therefore, we have chosen the second option.
Rewriting the main part of the project took us two months, for this task it was a record time. However, in order not to wait, we raised several copies of the tracker on the dedicated hardware, so that we could test the front-end and interaction with related services.
Separately, it is worth noting that even at the design stage, we made a fundamental decision to keep one code base for both Trackers: internal and external. This allows not to engage in copying code from one project to another, not to reduce the speed of releases and release opportunities outside almost immediately after they appear in our internal tracker.
But as it turned out, it was not enough to add another parameter to all methods of the application, we also encountered the following problems:
- Non-reticularity monga and elastic. It was impossible to put the data in one instance, the elastic is bad for a large number of indices, Monga also could not accommodate all organizations. Therefore, the backend was divided into several large instances, each of which can serve the organizations assigned to it. Each instance is fault tolerant. At the same time it is possible to drag the organization between them.
- The need to perform cron tasks for each organization. Here we had to solve the problem with each task individually. Somewhere replaced pull data on push. Somewhere one cron task generated a separate task for each organization.
- Different set of task fields in each organization. Because of the optimization of working with them, we had to write a separate cache for them.
- Update index mapping. A fairly common operation that occurs when the tracker is updated to the new version. Added a phased update mapping mechanism.
- Opening API on external users. I had to add a rate limiter, close access to the service API.
- Availability of support service for rare actions. Our support and developers do not have the right to look at the user data of organizations, which means that all actions should be carried out by administrators of companies. Added for them a number of adminok in the interface.
A separate moment - performance evaluation. Because of the many reworkings, it was necessary to estimate the speed of work, the number of organizations that would fit in the instance, as well as the supported rps. Therefore, we conducted regular shooting, having previously placed a large number of organizations in our test tracker. According to the results, the load limit was determined, after which new organizations would have to be placed in a new instance.
We made one more dedicated dedicated tracker instance to place a demo version in it. To get into it, you just have to have an account on Yandex. Some features are blocked in it (for example, file uploading), but you can get acquainted with the real interface of the tracker.
')
Source: https://habr.com/ru/post/345044/
All Articles