Stack: analyze parameter values

Very often, looking at the fall stack, I want to see, and with what values of the parameters the calls were made. Under the debugger in VisualStudio we can see these values. But what if the program is launched without a debugger and handles exceptions on its own? For answers, welcome under cat.
The question of the values of the parameters for us is not idle. Is it almost the first question that developers ask when they try our crash reporter : “Can we see the parameter values?”
Well, we investigate the problem in more detail.
Regardless of whether the exception is handled by us or not, initially we have the Exception object itself (and its InnerException chain).
')
The drop stack is extracted from the Exception.StackTrace property, or you can get it in a slightly more detailed form by creating an object of type System.Diagnostics.StackTrace . And if the frames contained in StackTrace can determine which methods were called, and what signatures they have, then the values of the parameters and the links to the objects (this) cannot be determined.
What to do? Once the runtime from the box does not give us the information we need, we will try to collect it ourselves.
Take the simplest code:
public void DoWork(string work) { DoInnerWork(work, 5); } public void DoInnerWork(string work, int times) { object o = null; o.ToString(); } Wrap up the contents of the try / catch methods. We will register each caught exception along with the values of the method parameters and send further:
public void DoWork(string work) { try { DoInnerWork(work, 5); } catch (Exception ex) { LogifyAlert.Instance.TrackArguments(ex, work); throw; } } public void DoInnerWork(string innerWork, this, int times) { try { object o = null; o.ToString(); } catch (Exception ex) { LogifyAlert.Instance.TrackArguments(ex, this, innerWork, times); throw; } } The Track method will have a signature:
public void TrackArguments(Exception ex, object instance, params object[] args) and it will add the values of the arguments to the internal list or to the dictionary so that they can be bound to the corresponding lines from Exception.StackTrace . It is also important to clear the received list at the right moments, otherwise its contents will become irrelevant already for the second exception thrown. What are these moments? Logging into the method and successful (without throwing an exception) quitting it, as well as logging into the global exception handler. Like this:
Warning, govnokod
public void DoWork(string work) { LogifyAlert.Instance.ResetTrackArguments(); try { DoInnerWork(work, 5); LogifyAlert.Instance.ResetTrackArguments(); } catch (Exception ex) { LogifyAlert.Instance.TrackArguments(ex, work); throw; } } public void DoInnerWork(string innerWork, this, int times) { LogifyAlert.Instance.ResetTrackArguments(); try { object o = null; o.ToString(); LogifyAlert.Instance.ResetTrackArguments(); } catch (Exception ex) { LogifyAlert.Instance.TrackArguments(ex, this, innerWork, times); throw; } } void MethodWithHandledException(string work) { LogifyAlert.Instance.ResetTrackArguments(); try { DoInnerWork(work, 5); LogifyAlert.Instance.ResetTrackArguments(); } catch (Exception ex) { HandleException(ex); LogifyAlert.Instance.ResetTrackArguments(); } } void CurrentDomain_UnhandledException(object sender, UnhandledExceptionEventArgs e) { var map = LogifyAlert.Instance.MethodArgumentsMap; ExceptionTracker.Reset(); // handle exception below } It looks enchanting, the code finally turned into something unreadable
How to bind parameter values to stack lines? According to the sequence number of the frame in the stack, certainly! At that moment, when we create System.Diagnostics.StackTrace , the current frame always has an index of 0, and the number of frames may be different. When the exception is thrown for the first time, the number of frames (stack depth) is maximum, in all subsequent rethrows of the same exception, the stack depth will only be less. Thus, the line number on the stack (for a specific exception) is the difference between the maximum and current stack depth. In the form of code:
public void TrackArguments(Exception ex, MethodCallInfo call) { StackTrace trace = new StackTrace(0, false); int frameCount = trace.FrameCount; MethodCallStackArgumentMap map; if (!MethodArgumentsMap.TryGetValue(ex, out map)) { map = new MethodCallStackArgumentMap(); map.FirstChanceFrameCount = frameCount; MethodArgumentsMap[ex] = map; } int lineIndex = map.FirstChanceFrameCount - frameCount; map[lineIndex] = call; } Where MethodCallInfo looks like this:
public class MethodCallInfo { public object Instance { get; set; } public MethodBase Method { get; set; } public IList<object> Arguments { get; set; } } Bind done. We write in crash report, send it to the server along with Exception.StackTrace , and there we will deal with the display. We get something similar to:
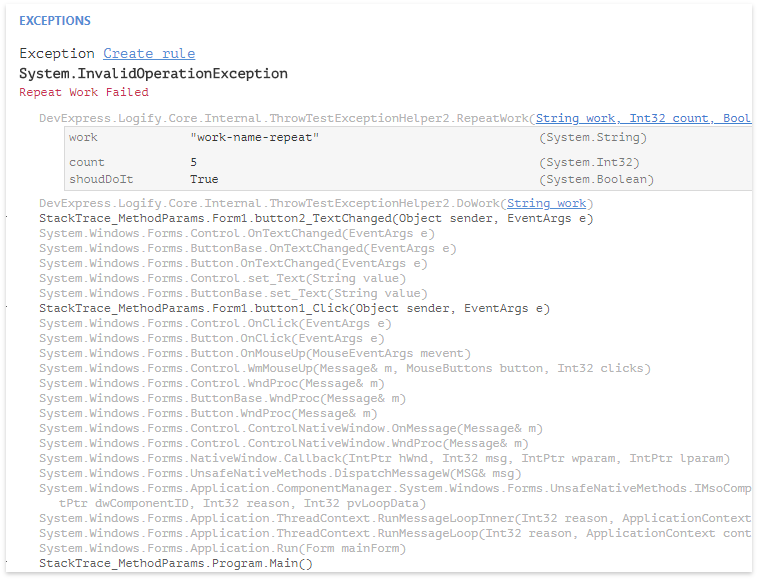
The principal performance of the approach is proven, now we need to make sure that the code does not become as scary as a nuclear war, and ideally, that there would be no need to write any code at all.
We recall about such a useful thing in the household as AOP .
We try, for example, Castle.DynamicProxy , create an interceptor:
public class MethodParamsInterceptor : IInterceptor { public void Intercept(IInvocation invocation) { try { LogifyAlert.Instance.ResetTrackArguments(); invocation.Proceed(); LogifyAlert.Instance.ResetTrackArguments(); } catch (Exception ex) { LogifyAlert.Instance.TrackArguments( ex, CreateMethodCallInfo(invocation) ); throw; } } MethodCallInfo CreateMethodCallInfo(IInvocation invocation) { MethodCallInfo result = new MethodCallInfo(); result.Method = invocation.Method; result.Arguments = invocation.Arguments; result.Instance = invocation.Proxy; return result; } } We connect the crash reporter:
var client = LogifyAlert.Instance; client.ApiKey = "<my-api-key>"; client.StartExceptionsHandling(); Create a test class using an interceptor:
var proxy = generator.CreateClassProxy<ThrowTestExceptionHelper>( new MethodParamsInterceptor() ); proxy.DoWork("work"); Perform and look at the result:
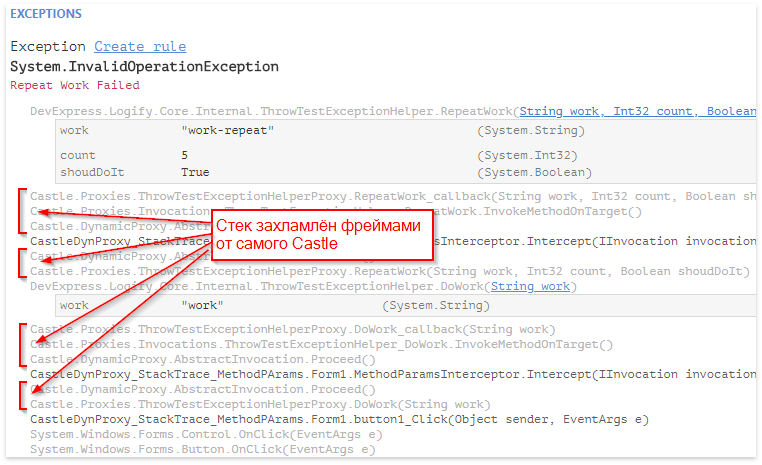
Everything worked well, but there are as many as BUT:
- The stack is now very cluttered with Castle's frames.
- Interception only works with virtual methods and interfaces.
- Creating objects has become rather cumbersome.
The last point is the most critical - we will have to significantly rewrite the project’s message just for the sake of the parameter values on the stack. A game of powder is hardly worth it.
Or maybe "there is the same, but with pearl buttons"? And there is, PostSharp . We realize the aspect:
[AttributeUsage(AttributeTargets.Method | AttributeTargets.Class | AttributeTargets.Assembly | AttributeTargets.Module)] [Serializable] public class CollectParamsAttribute : OnMethodBoundaryAspect { public override bool CompileTimeValidate(MethodBase method) { if (method.GetCustomAttribute(typeof(IgnoreCallTrackingAttribute)) != null || method.Name == "Dispose") { return false; } return base.CompileTimeValidate(method); } public override void OnEntry(MethodExecutionArgs args) { base.OnEntry(args); LogifyAlert.Instance.ResetTrackArguments(); } public override void OnSuccess(MethodExecutionArgs args) { LogifyAlert.Instance.ResetTrackArguments(); base.OnSuccess(args); } [MethodImpl(MethodImplOptions.NoInlining)] public override void OnException(MethodExecutionArgs args) { if (args.Exception == null) return; if (args.Method != null && args.Arguments != null && args.Instance != this) LogifyAlert.Instance.TrackArguments(args.Exception, CreateMethodCallInfo(args)); base.OnException(args); } MethodCallInfo CreateMethodCallInfo(MethodExecutionArgs args) { MethodCallInfo result = new MethodCallInfo(); result.Method = args.Method; result.Arguments = args.Arguments; result.Instance = args.Instance; return result; } } There are several nuances in the code. First, we forbid PostSharp to instruct methods marked with the IgnoreCallTrackingAttribute attribute. For what? We recall this code here:
void CurrentDomain_UnhandledException(object sender, UnhandledExceptionEventArgs e) { var map = LogifyAlert.Instance.MethodArgumentsMap; ExceptionTracker.Reset(); // handle exception below } What happens if I call it if PostSharp overwrites it? The OnEntry method of the aspect will be called, which, first of all, will clean up the call parameters we collected with such difficulty. Epic Fail. Therefore, all methods where we need to refer to MethodCallArgumentsTracker should be marked with the IgnoreCallTrackingAttribute attribute.
Second: forbid rewriting Dispose. It would seem, why
The third nuance in the strange test:
if (args.Method != null && args.Arguments != null && args.Instance != this) LogifyAlert.Instance.TrackArguments( args.Exception, CreateMethodCallInfo(args) ); The fact is that PostSharp aggressively optimizes code that embeds in methods. And if we do not explicitly turn to the MethodExecutionArgs fields, then we get quite kosher null in the values of these fields, which, of course, will make us all further logic meaningless.
So, with a slight movement of the hand, we apply the aspect to the entire assembly:
[assembly: CollectParams] Perform and watch crash report:
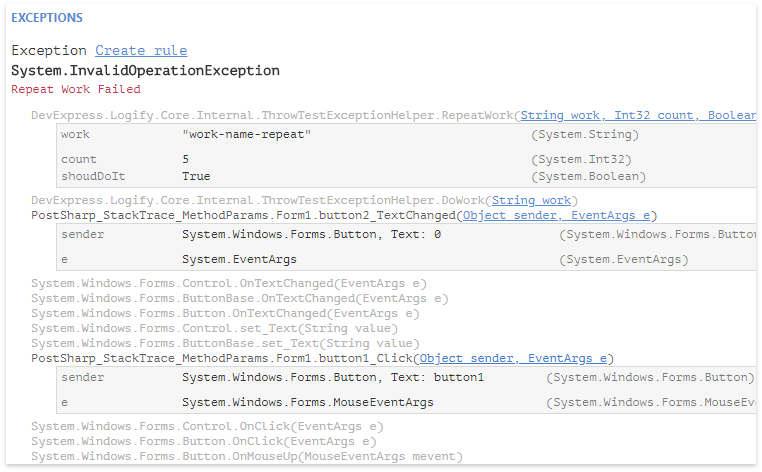
The stack looks
What other options are there besides PostSharp and others like it?
First of all, this is writing a profiler and using the methods ICorProfilerInfo :: GetILFunctionBody and ICorProfilerInfo :: SetILFunctionBody in order to modify the bodies of the methods directly during program execution. A good series of articles on how to do this can be found here . A good selection of links on the topic here .
pros
- CLR features are used;
- no modification of the source code is required at all;
- Everything will work in runtime.
Minuses
- will work in runtime, which means a bit to slow down the program.
- The profiler cannot be written in managed code.
- the profiler assembly must be registered in the system
- Before starting the application, you need to properly configure the environment .
There are still hacker methods, only hardcore, worthy of Chuck Norris , who is known:

Here is described the approach that if you manage to correctly determine the addresses of some non-public functions of the JIT implementation, you can try to carefully use them to replace the IL-code of the methods immediately before compiling them into the native code. The disadvantages are that it is not easy to determine the addresses of functions correctly, and that they can change regularly with updates. So, the author simply did not earn an example from the article, since necessary addresses could not be determined. Another minus is that the approach will not work if the assembly has been processed with NGen .
Another elegant description of the original method of intercepting methods was published by ForwardAA comrade , here, in Habré. It is quite possible that with proper file modification, his approach can be adapted for the task of collecting the values of the call arguments. Of the benefits, it is likely that the approach will work even after processing the assembly with NGen .
Conclusion
The most reliable method at the moment to collect the values of the call arguments at the moment of the exception is the use of Postsharp. Logify client can bind collected values to the stack written when an exception occurred. Due to this, in some cases, the resulting crash report may be much more informative than containing only the stack.
Source: https://habr.com/ru/post/344992/
All Articles