Analysis summary hh.ru: a lot of graphs and some sexism and discrimination
Recently, I came across an article about the analysis dataset summary hh.ru, who participated in some kind of hackathon. It made me think about playing with the resume data myself. Especially since I have a little more. I chose the most interesting area for me, which can be specified in the summary, - “Information technology, Internet, telecom”.
Under the cat you will find a lot of graphs on which you will learn how many people get in various IT specializations, graduates of which universities want the most money, which employers have the IT people who are slowed down the least, whether Google users earn more than Yandex or Mail users, and a lot of other information.

Everything described below is just my vision of how it should be. Graphics do not claim to be completely objective and reflect the real situation. I could make a mistake anywhere.
')
I took Russian resumes from the Information Technologies, Internet, Telecom trade union, which were updated over the past year. Further, for all graphs, it should be borne in mind that the indicators below are not an absolute cut across the country, but only for the part that is present on hh.ru. It may be offset.
In total, 566,178 IT pros participate in the analysis. All graphics are clickable.
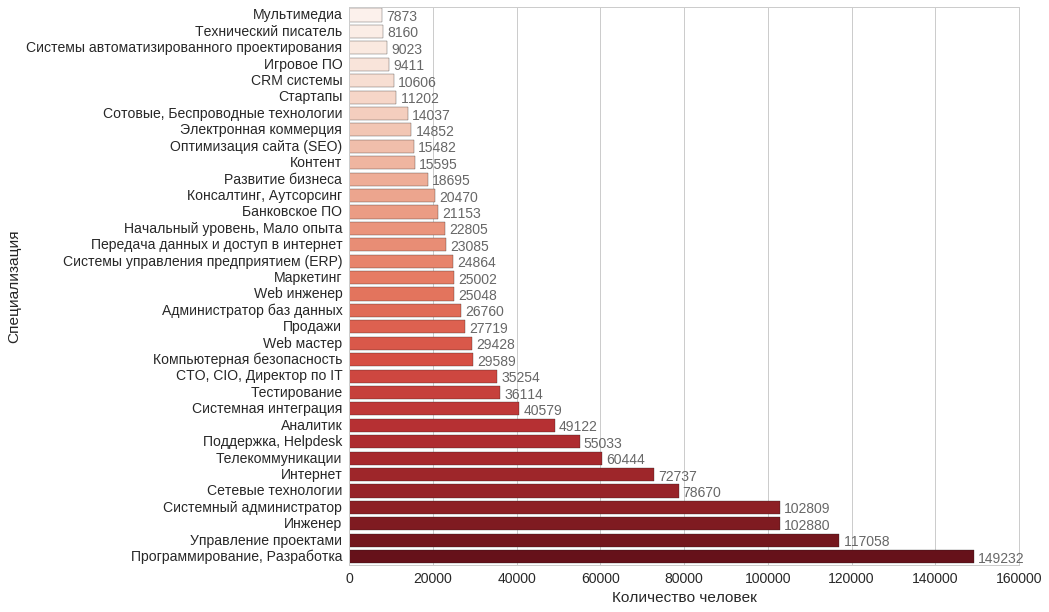
Up to three specializations can be chosen in the “Information Technologies, Internet, Telecom” professional area. The graph shows how many people have chosen which specialization:
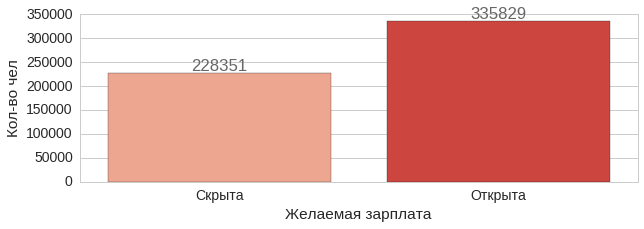
When creating a resume, you can not specify your patch. As we see, about 40% of IT people use this.
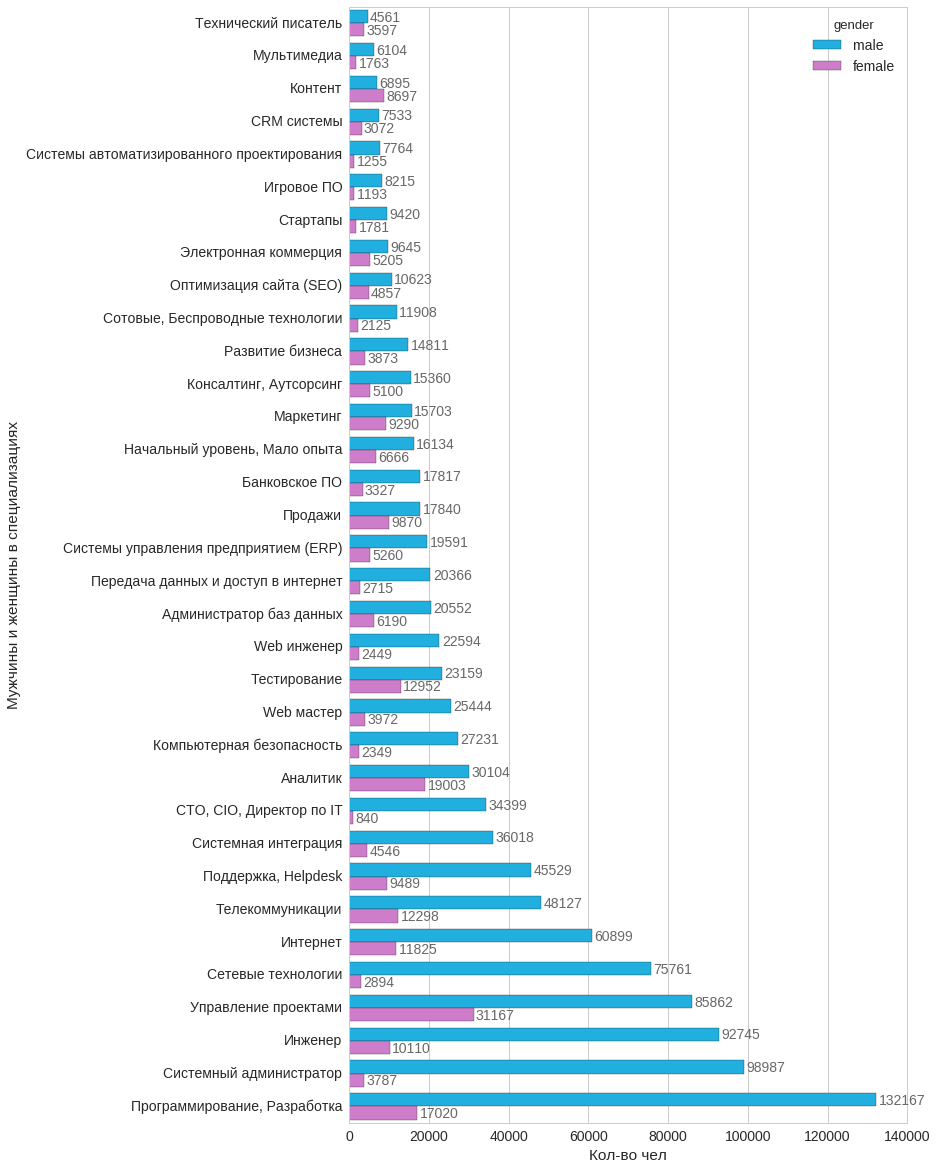
Overweight men in IT is no surprise. Why are so few women - system administrators, networkers and leading techies?
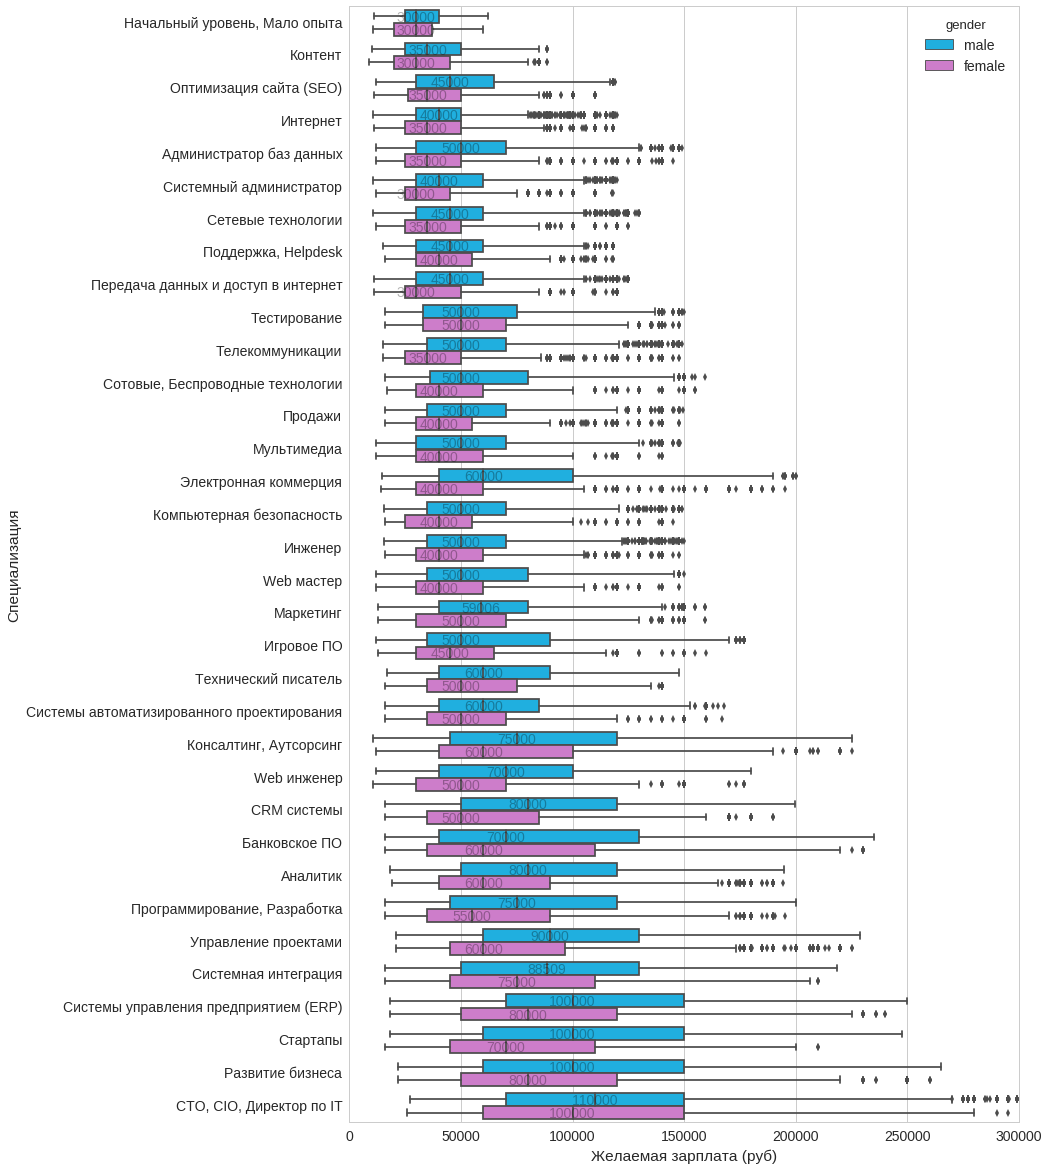
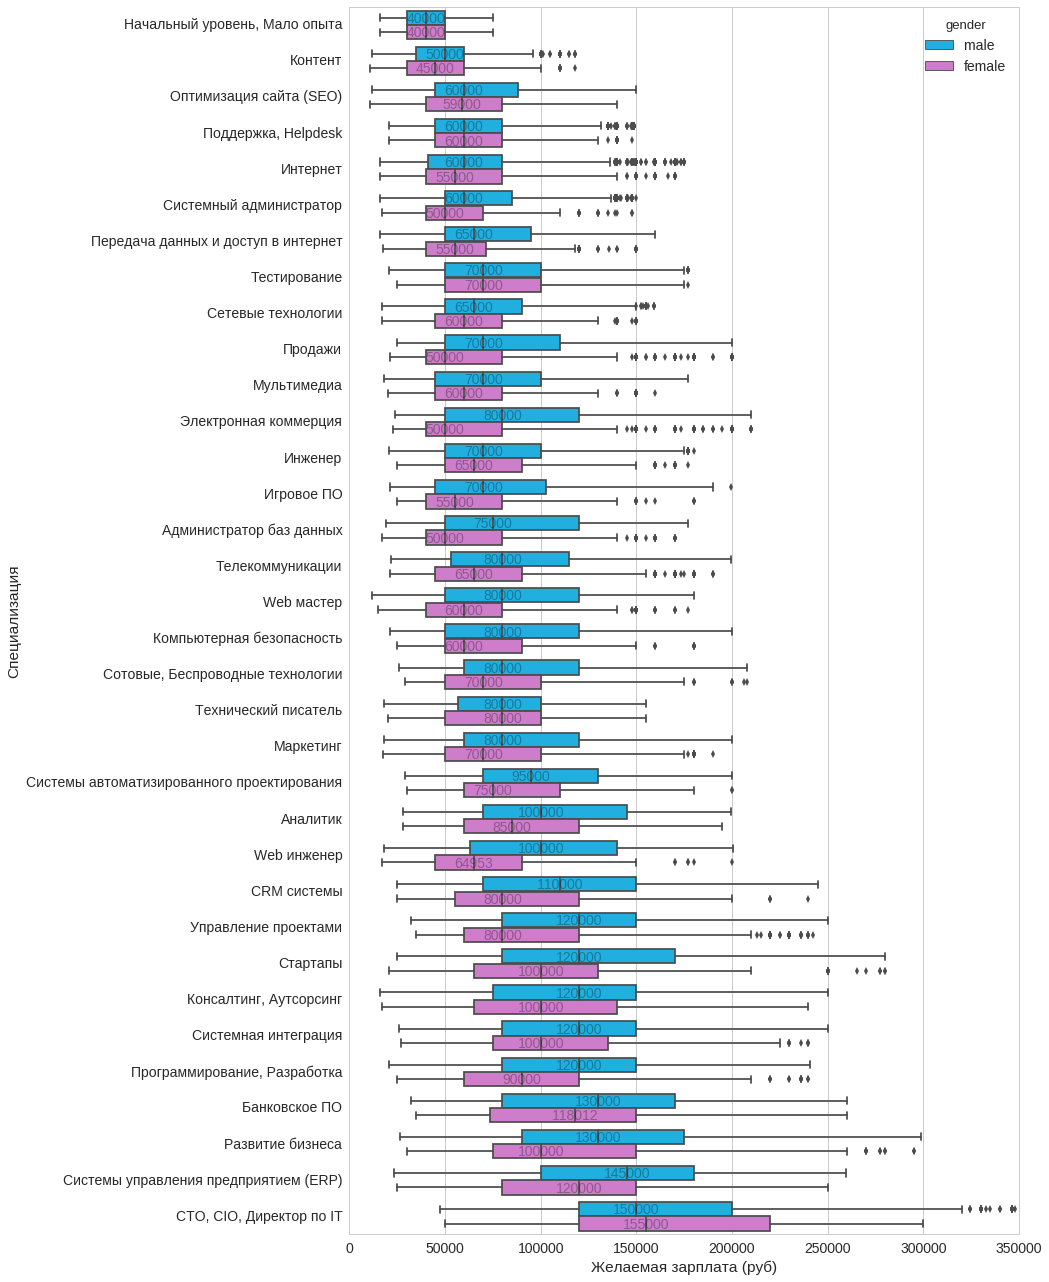
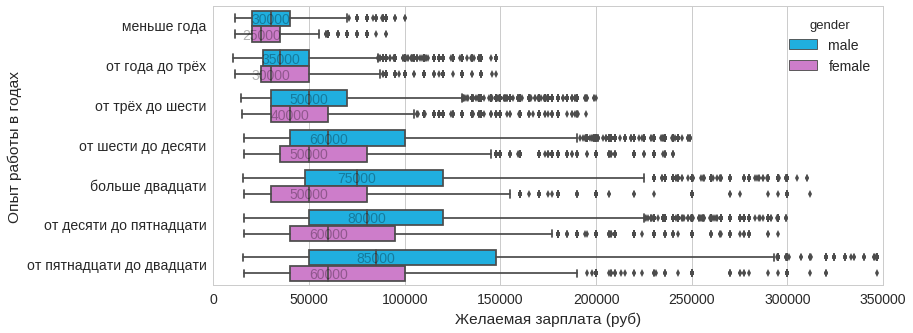
Well, now let's see how much money men and women want in different specializations throughout Russia.
The next chart is boxplot, or in our opinion, a box with a mustache. It reads like this. The dash inside the box is the median. That is, half of the people get more than this amount, and the other half - less. The value of the median I tried to sign on almost all the charts. The box is an interquartile range (IQR) and includes 50% of all resumes: from 1st quartile (25%) to 3rd quartile (75%). In other words, 25% of resumes want less money than the left border of the drawer, and 25% want more money than the right border of the drawer. The whiskers limit almost all other data: 0.35% of all resumes want less money than the left border, and 0.35% want more than the right usa border. All those who did not enter the specified intervals are outliers and are marked by separate dots.
It's no secret that in Moscow and St. Petersburg there are more IT people than in other regions of our country, and the level of payment there is above the national average. Therefore, I have made separate schedules for these cities with the distribution of wages by specialization.
On all three graphs, the same expectations for monetary compensation between men and women can be seen from testers. By the way, girls go to this IT area more eagerly than to many others.
It is worth noting that in Moscow and St. Petersburg, the female median is higher for technical chiefs. But if you look at the distribution schedule for the number of men and women in this specialty, it is clear that the second is much smaller.
We see that IT specialists are second only to raw material extraction, consulting and top management in terms of salary. In 24 out of 28 professional areas, women want less money (by median). In the rest - equally.
Once again, I’ll clarify that the graph does not reflect the actual distribution of IT specialists in the country, but only those summaries that are on hh.ru. The level of use of the site in the regions is different.
For this schedule, I received all active vacancies and resumes that were updated during the year, and for each region I divided the number of resumes by the number of vacancies. I also excluded regions where the number of IT people is less than 1000.
It can be seen that the Moscow Region took the lead. It does not include Moscow itself. Most likely, this is because a lot of IT people, especially visitors, are settled on the periphery, and the work is mostly in the city itself.
In the following graph, I calculated the percentage of the total number of resumes in this region that IT professionals occupy.
An interesting difference between St. Petersburg and the Leningrad Region and Moscow and the Moscow Region. Most likely, this is due to the presence in the MO of such large hangouts for IT people like Mytishchi, Khimki, Lyubertsy and others that belong to the region, but close to the city.
In the summary, you can specify key skills. The following graph shows the top selected skills for all IT people.
It is interesting to see the main key skills for developers only.
Young people often go to the web and toys. I think this is a great entry point to IT.
The order is broken only by those who have worked for more than 20 years. Most likely, this is because there are many people in this category who have come to IT from another area. As in the resume, people often like to indicate not only the relevant experience of this trade area.
Most indicate that the time spent on the road to work does not matter. In St. Petersburg and Moscow, people are somewhat more deeply aware of this “it does not matter” and therefore they choose this item less often.
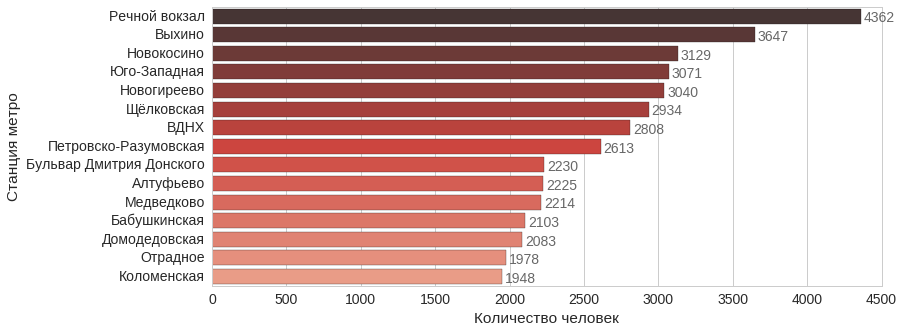
In the summary, you can specify the nearest metro station. Let's see for Moscow, where the most people.
I did not find an easy way to put a text label in the Python gmap, therefore the stations marked with markers are marked separately:
Most of these stations are the main points of entry into the city from crowded, crowded places.
I downloaded the DEF code base on the Rossvyaz website, combed it a bit and matched it with the phone numbers from the resume.
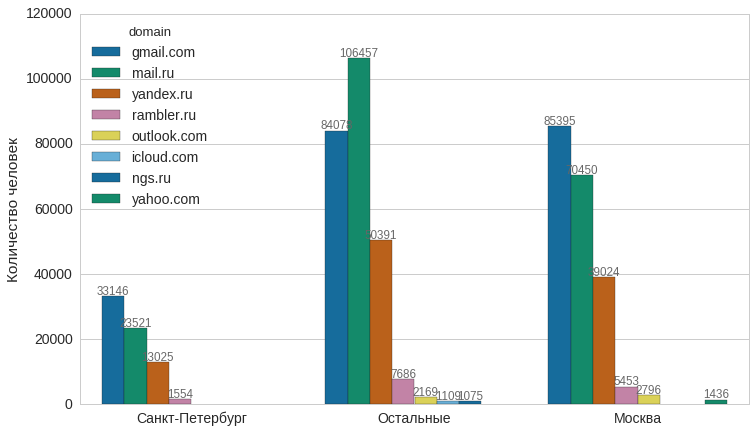
For the given schedule I have united various domains of one company in one group. By the way, a curious fact, which is not visible on the graph, about Yandex. Mail, that the overwhelming majority indicate in the email-address the domain yandex.ru, and not ya.ru
I have always believed that the coolest guys use Gmail, the middle ones use Yandex, and the rest use Mail.ru. Now let's see what salary expectations will be in these three groups.
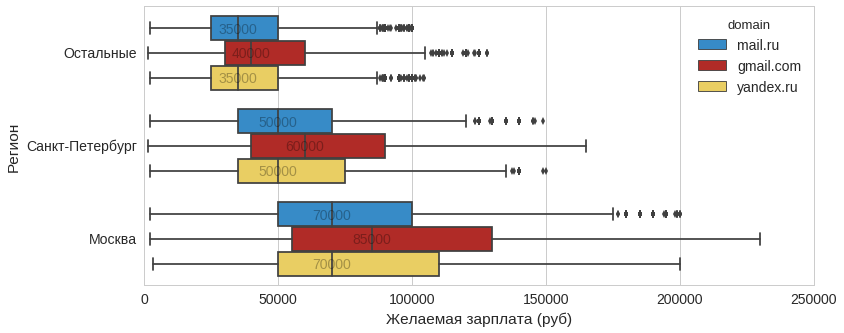
So guys, if you want more money, you know what to do.
Well, now let's see what high school graduates want the most money. I sifted out all the institutions where less than 1,000 people from the sample studied.
In work experience, you can specify the duration of work in this company. I took everything that more than 500 IT people went through.
It is seen that not very IT organizations come across. This is because work experience indicates not only relevant experience.
Let's see, people with experience in which companies want the most money. Take Moscow and Peter separately.
Moscow:
St. Petersburg:
In the process of drawing graphs, I had more and more new ideas of what could be done more, but I decided to dwell on what is. If this post goes well, I will continue.
They helped me in drawing graphs: Python , Jupyter notebook , Pandas , Seaborn , Apache Hive and others.
Ask questions.
Thanks to all.
UPD : I cleaned the last three schedules a bit by combining different spellings of the same organization
Under the cat you will find a lot of graphs on which you will learn how many people get in various IT specializations, graduates of which universities want the most money, which employers have the IT people who are slowed down the least, whether Google users earn more than Yandex or Mail users, and a lot of other information.
Everything described below is just my vision of how it should be. Graphics do not claim to be completely objective and reflect the real situation. I could make a mistake anywhere.
')
I took Russian resumes from the Information Technologies, Internet, Telecom trade union, which were updated over the past year. Further, for all graphs, it should be borne in mind that the indicators below are not an absolute cut across the country, but only for the part that is present on hh.ru. It may be offset.
In total, 566,178 IT pros participate in the analysis. All graphics are clickable.
Number of people in the specialization
Up to three specializations can be chosen in the “Information Technologies, Internet, Telecom” professional area. The graph shows how many people have chosen which specialization:
How many people hide the desired salary
When creating a resume, you can not specify your patch. As we see, about 40% of IT people use this.
Distribution of males and females by specialization
Overweight men in IT is no surprise. Why are so few women - system administrators, networkers and leading techies?
Distribution of desired salary by specialization
Well, now let's see how much money men and women want in different specializations throughout Russia.
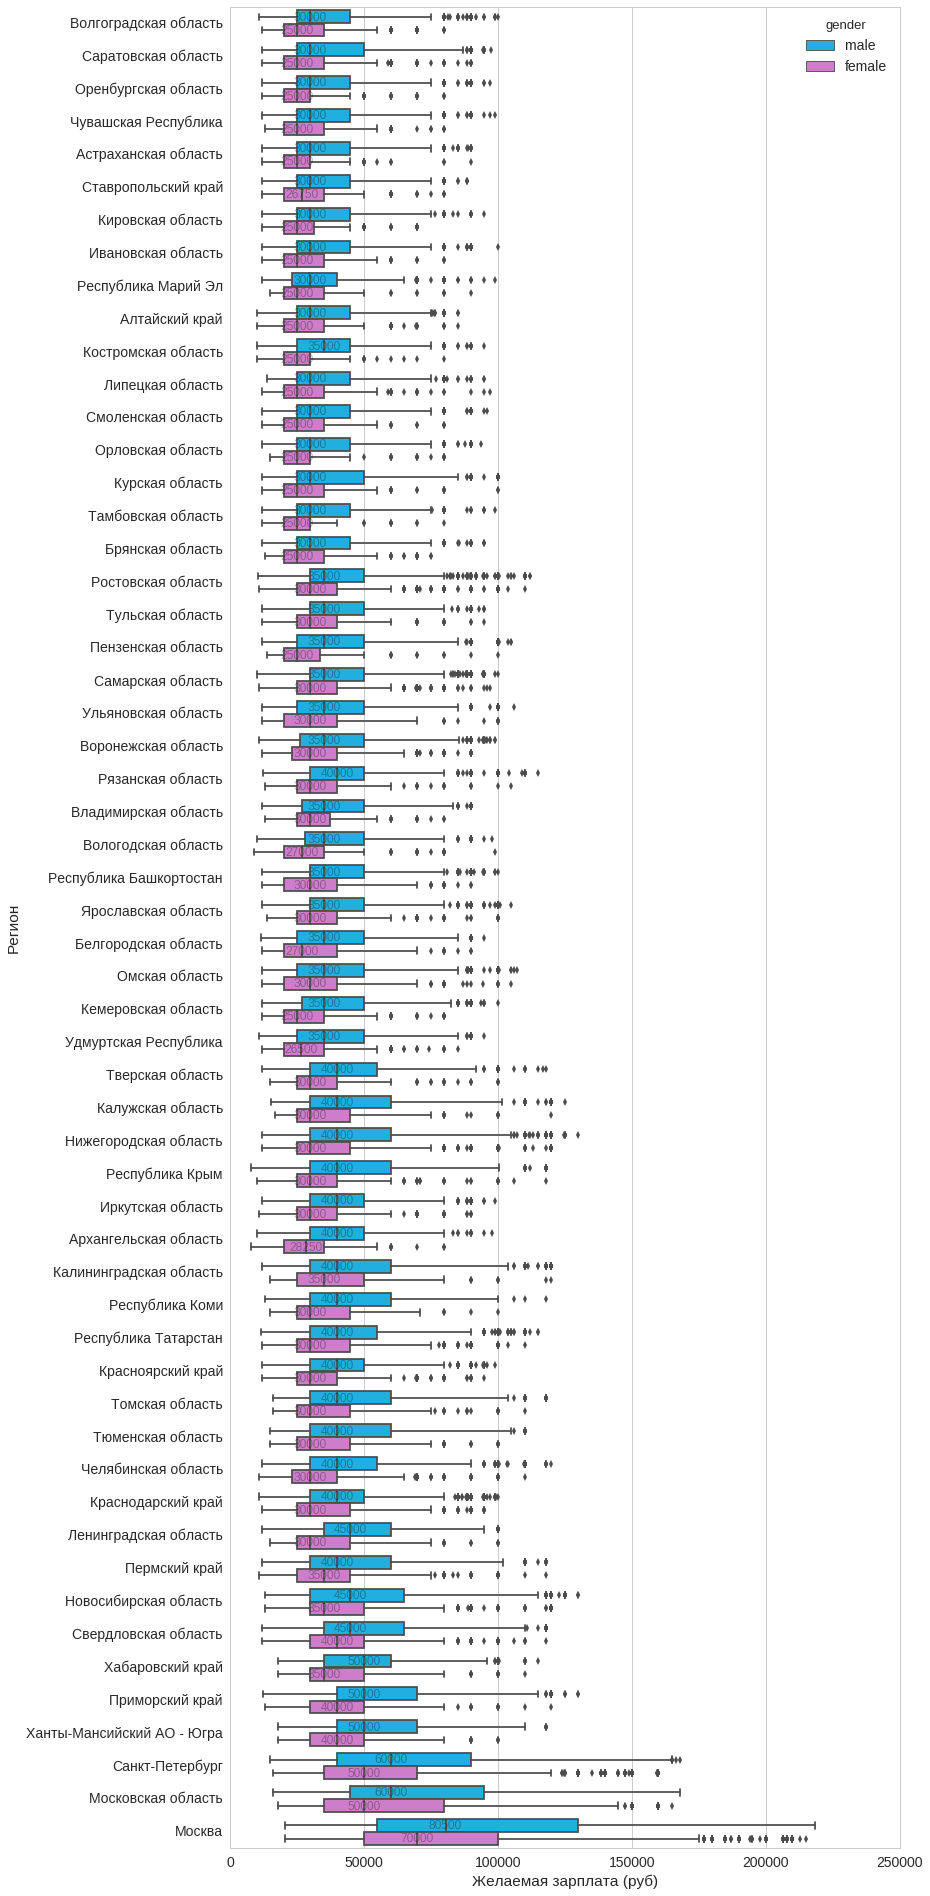
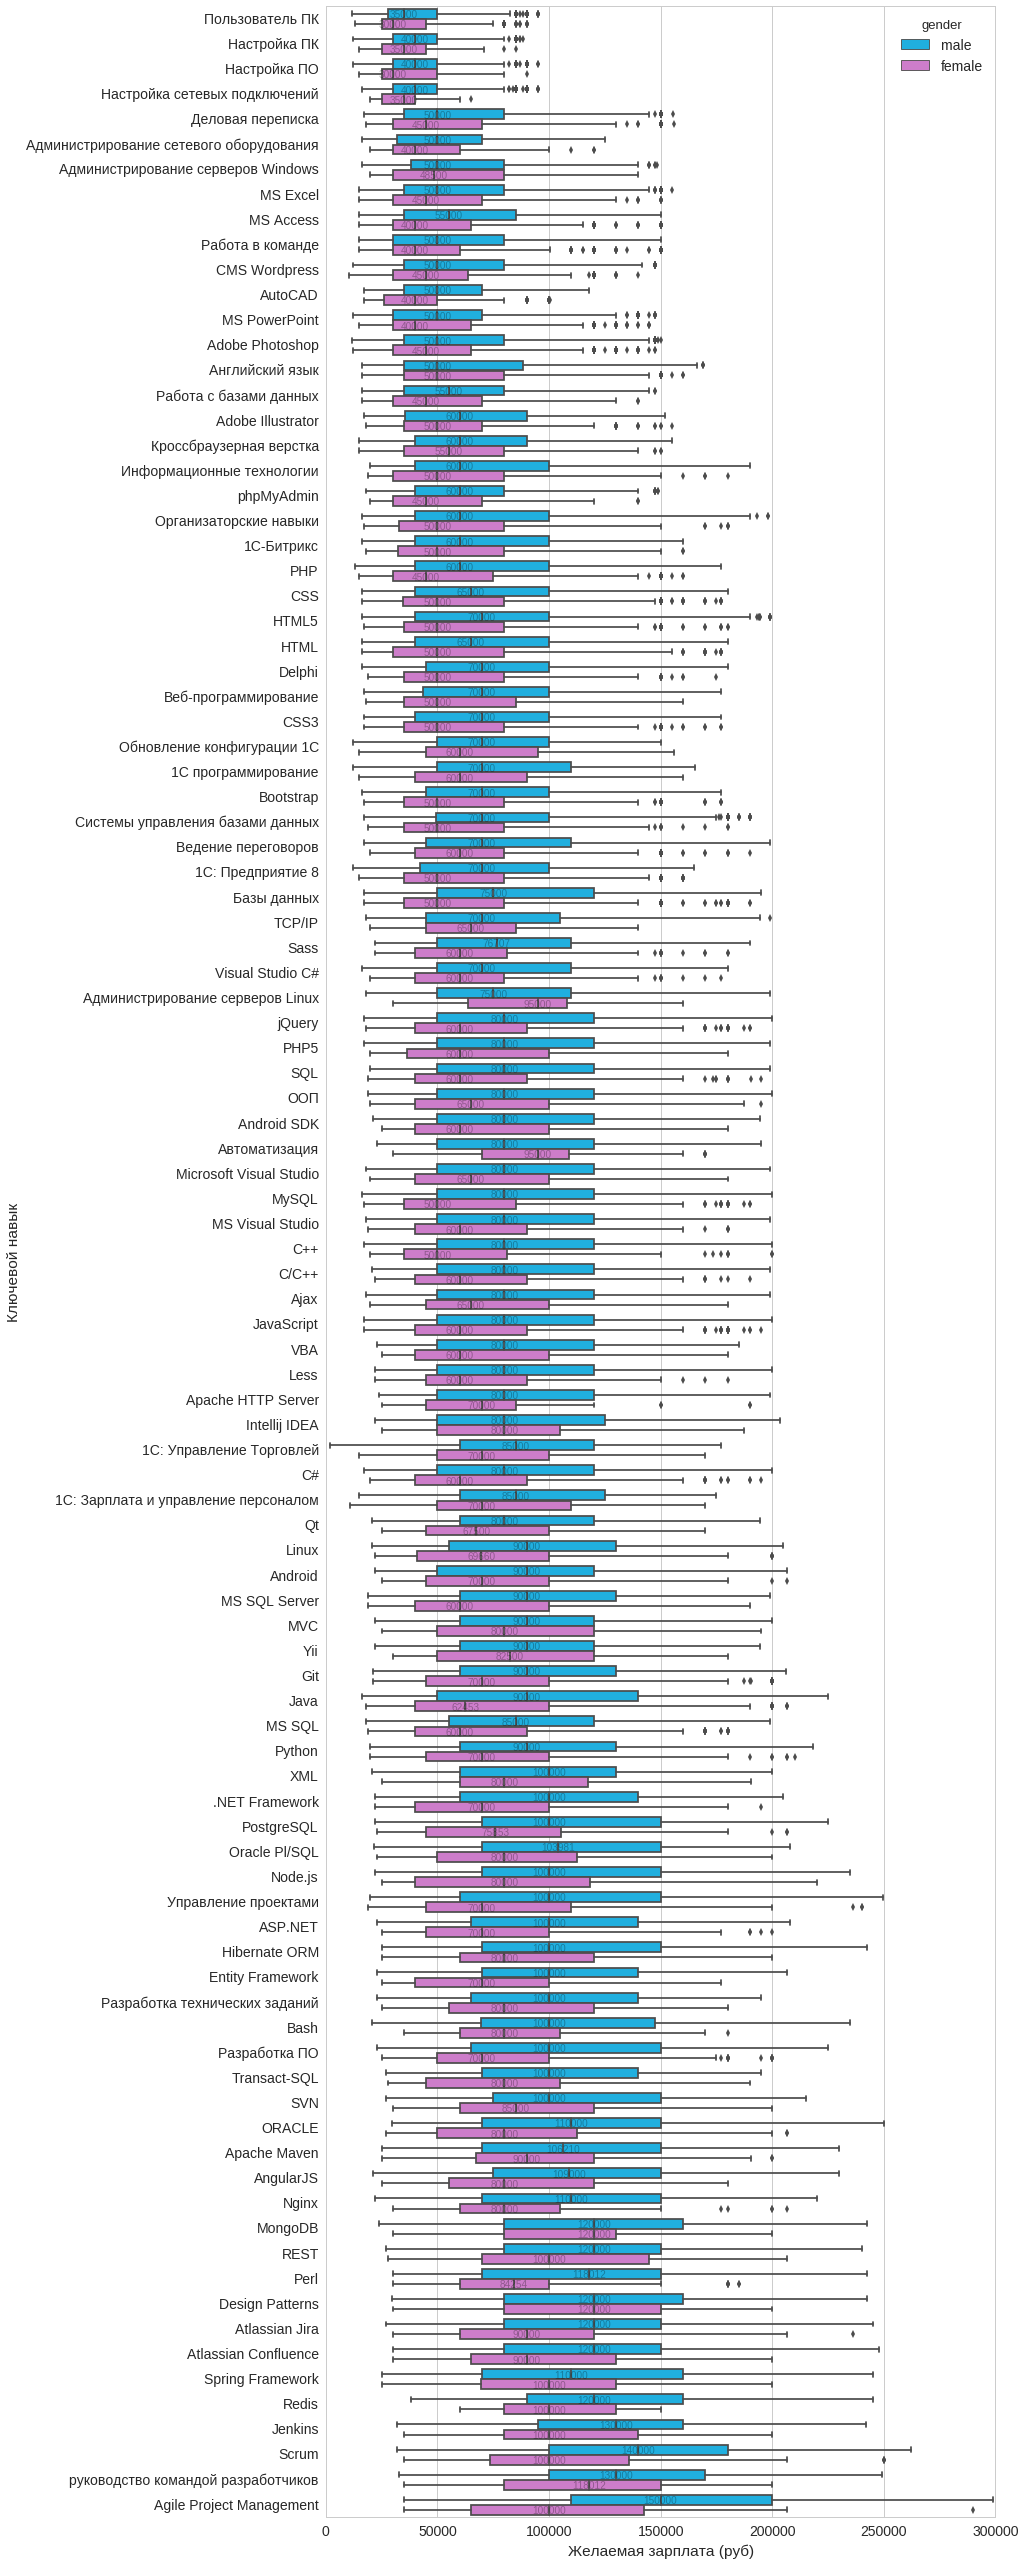
The next chart is boxplot, or in our opinion, a box with a mustache. It reads like this. The dash inside the box is the median. That is, half of the people get more than this amount, and the other half - less. The value of the median I tried to sign on almost all the charts. The box is an interquartile range (IQR) and includes 50% of all resumes: from 1st quartile (25%) to 3rd quartile (75%). In other words, 25% of resumes want less money than the left border of the drawer, and 25% want more money than the right border of the drawer. The whiskers limit almost all other data: 0.35% of all resumes want less money than the left border, and 0.35% want more than the right usa border. All those who did not enter the specified intervals are outliers and are marked by separate dots.
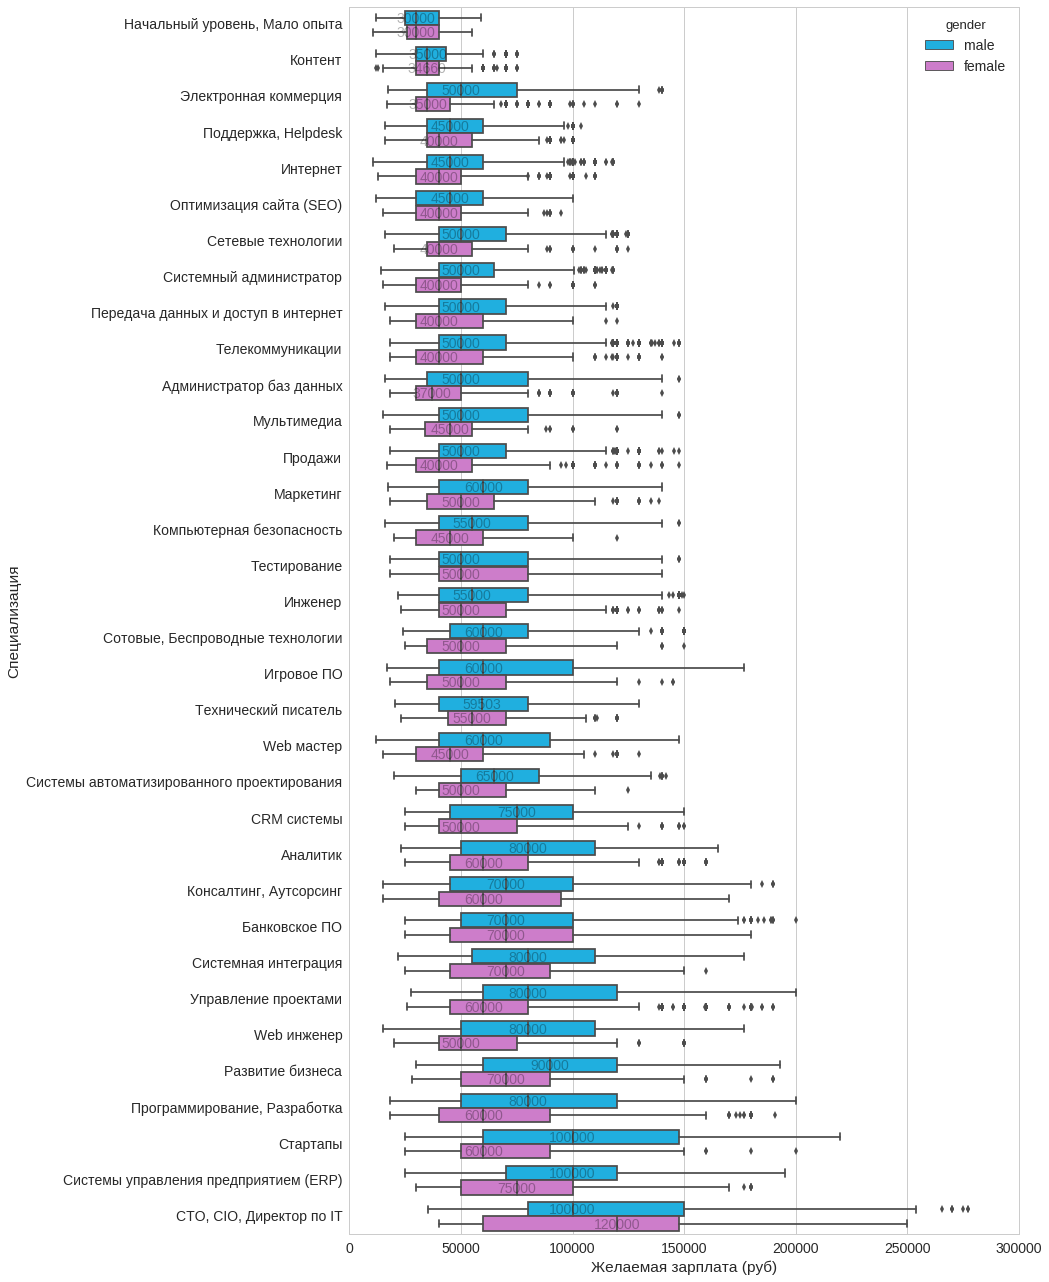
It's no secret that in Moscow and St. Petersburg there are more IT people than in other regions of our country, and the level of payment there is above the national average. Therefore, I have made separate schedules for these cities with the distribution of wages by specialization.
Distribution of salaries by specialization in Moscow
Distribution of salaries by specialization in St. Petersburg
On all three graphs, the same expectations for monetary compensation between men and women can be seen from testers. By the way, girls go to this IT area more eagerly than to many others.
It is worth noting that in Moscow and St. Petersburg, the female median is higher for technical chiefs. But if you look at the distribution schedule for the number of men and women in this specialty, it is clear that the second is much smaller.
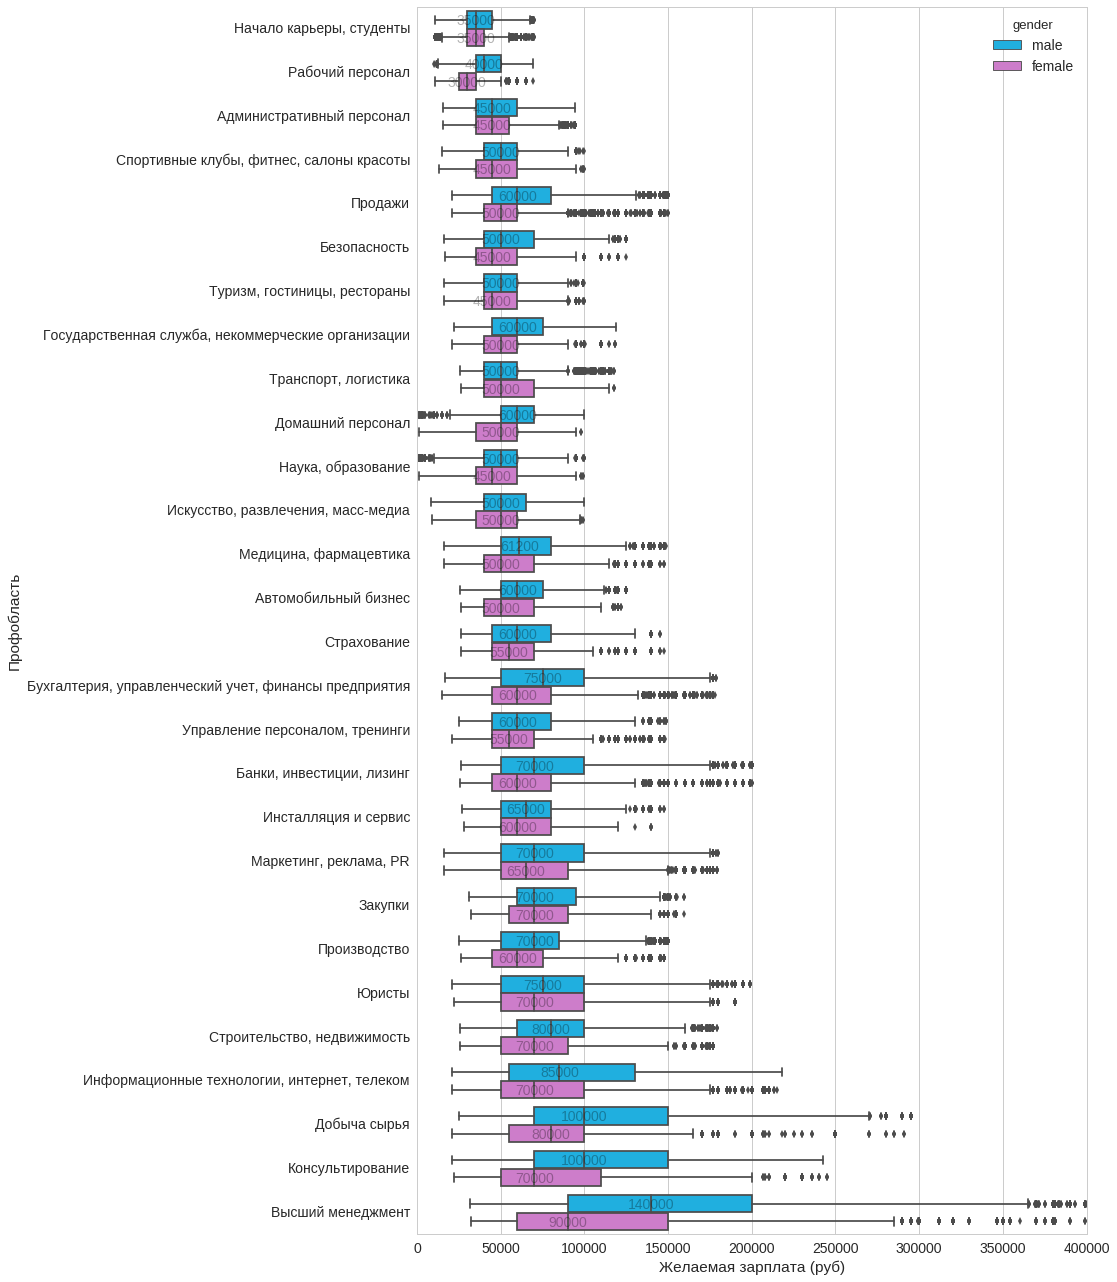
IT salaries in Russia in comparison with other professional areas
We see that IT specialists are second only to raw material extraction, consulting and top management in terms of salary. In 24 out of 28 professional areas, women want less money (by median). In the rest - equally.
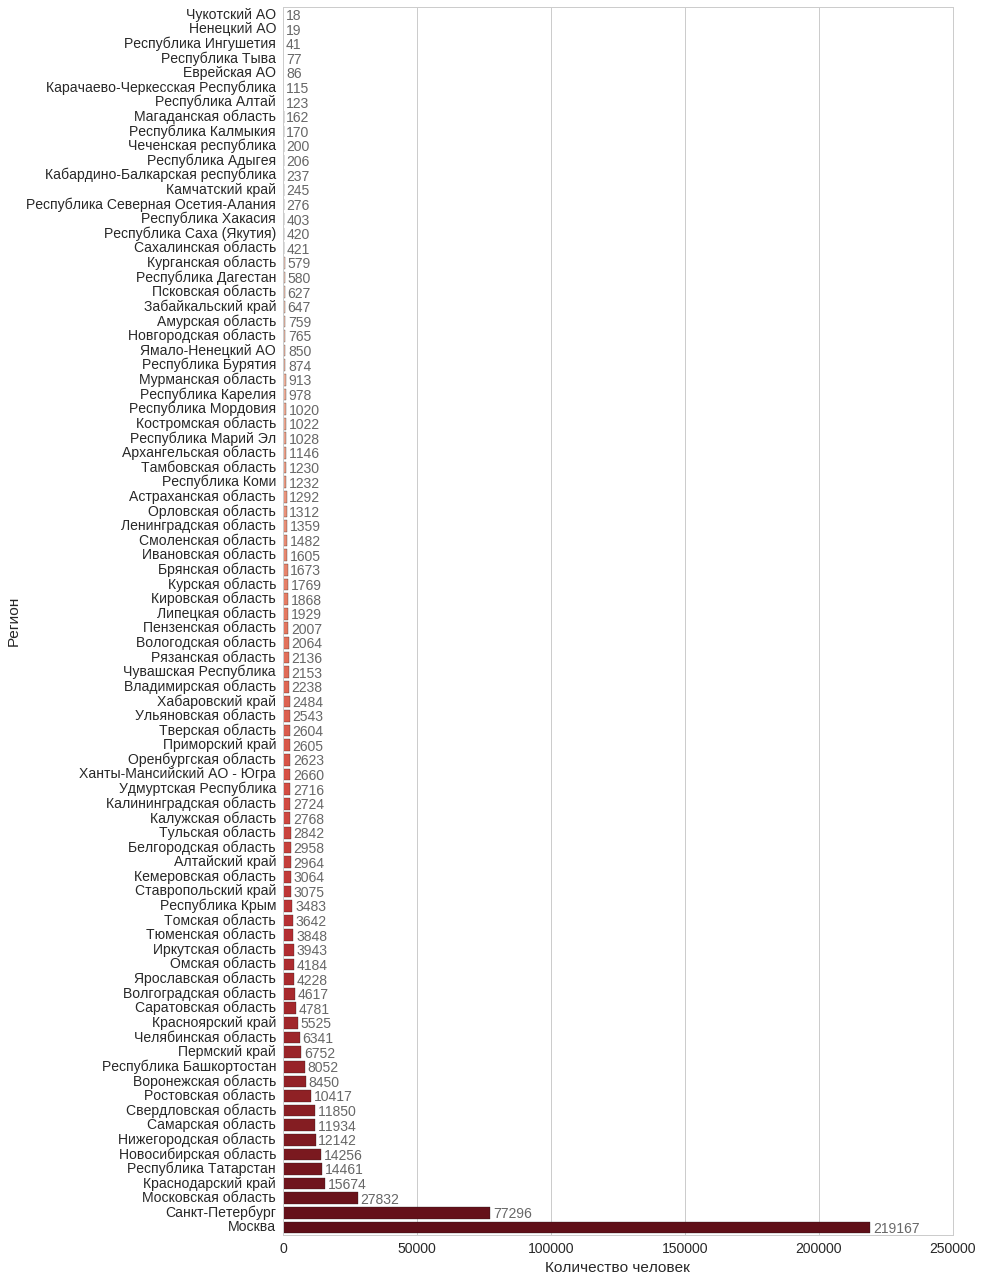
Distribution of IT professionals by region
Once again, I’ll clarify that the graph does not reflect the actual distribution of IT specialists in the country, but only those summaries that are on hh.ru. The level of use of the site in the regions is different.
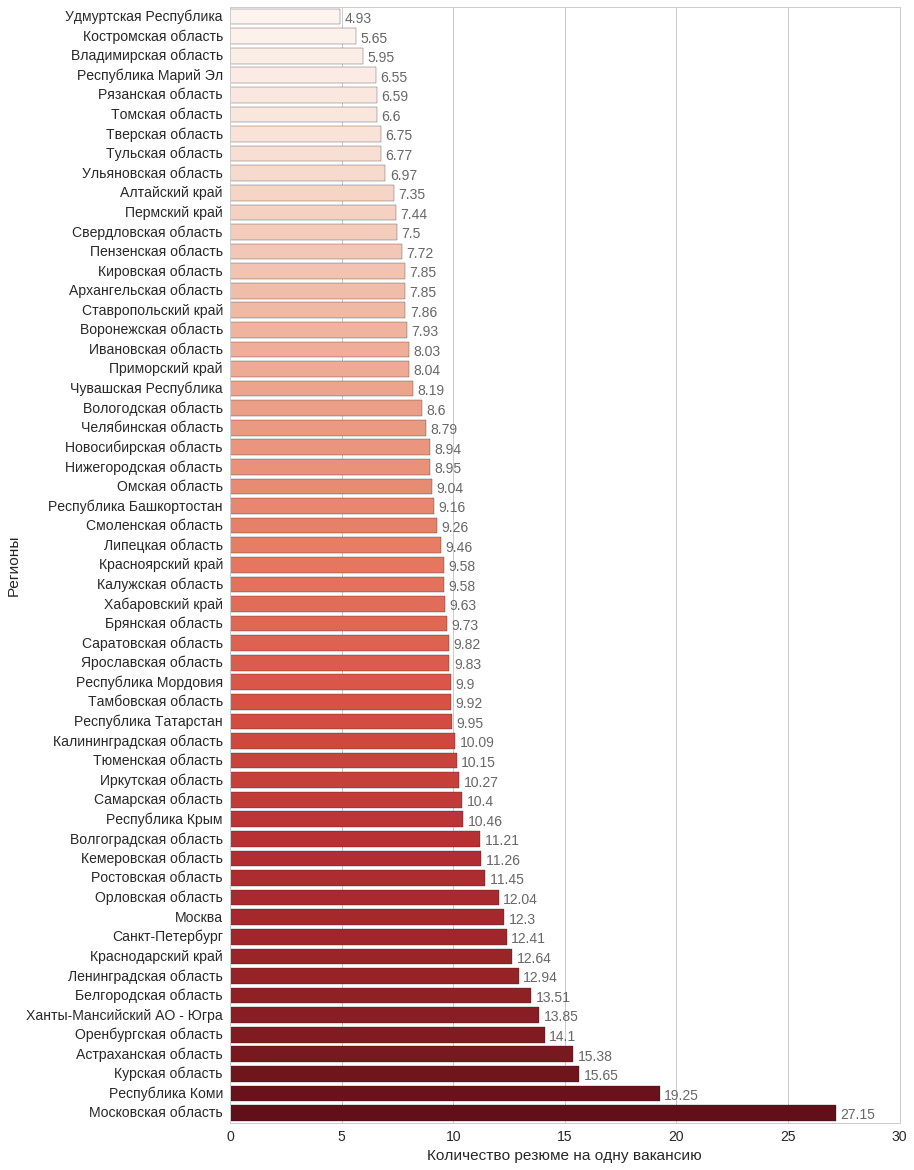
How many resumes per vacancy
For this schedule, I received all active vacancies and resumes that were updated during the year, and for each region I divided the number of resumes by the number of vacancies. I also excluded regions where the number of IT people is less than 1000.
It can be seen that the Moscow Region took the lead. It does not include Moscow itself. Most likely, this is because a lot of IT people, especially visitors, are settled on the periphery, and the work is mostly in the city itself.
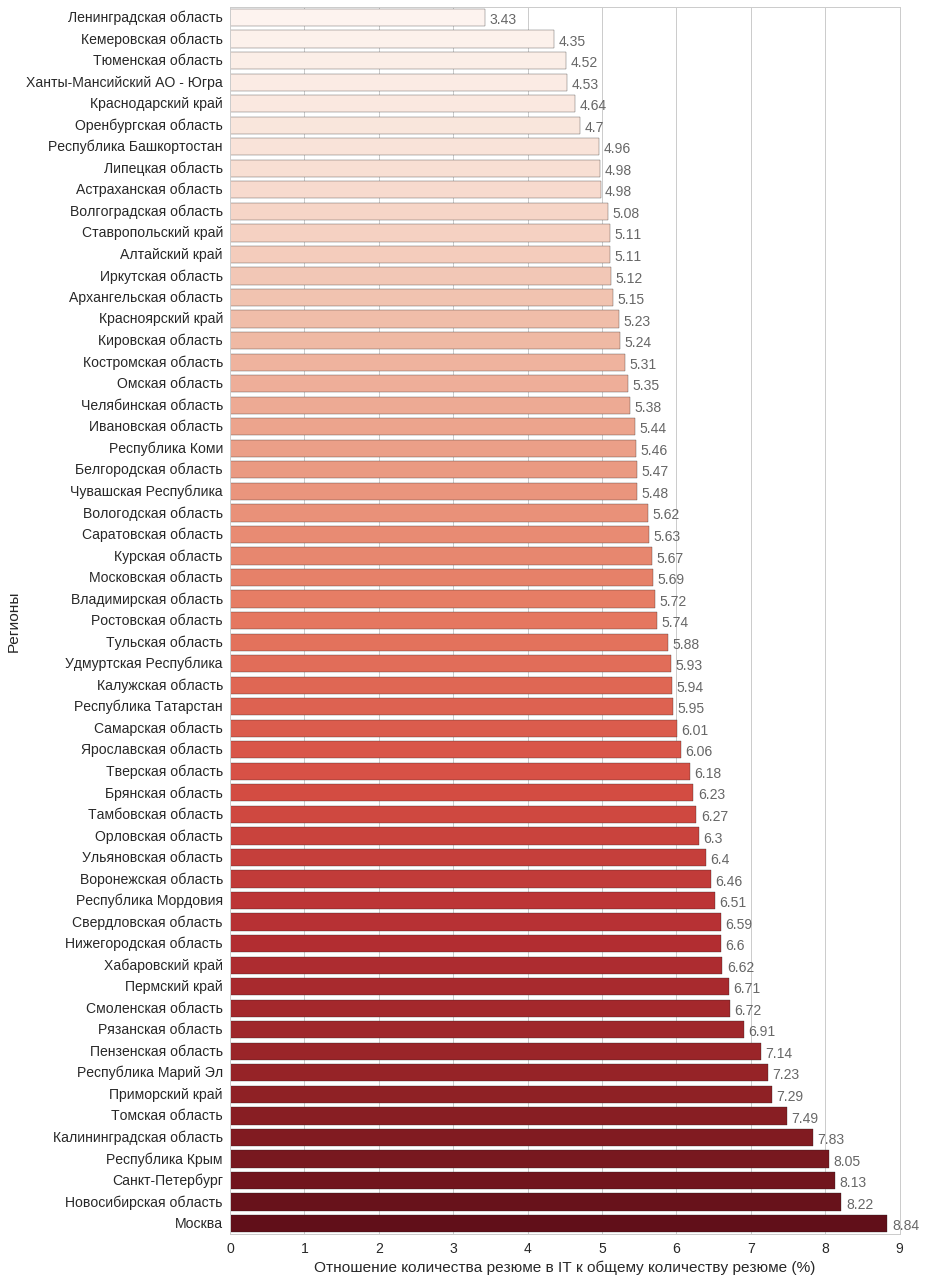
The percentage of IT-resume of the total number of resumes
In the following graph, I calculated the percentage of the total number of resumes in this region that IT professionals occupy.
An interesting difference between St. Petersburg and the Leningrad Region and Moscow and the Moscow Region. Most likely, this is due to the presence in the MO of such large hangouts for IT people like Mytishchi, Khimki, Lyubertsy and others that belong to the region, but close to the city.
Distribution of desired salary in IT by region
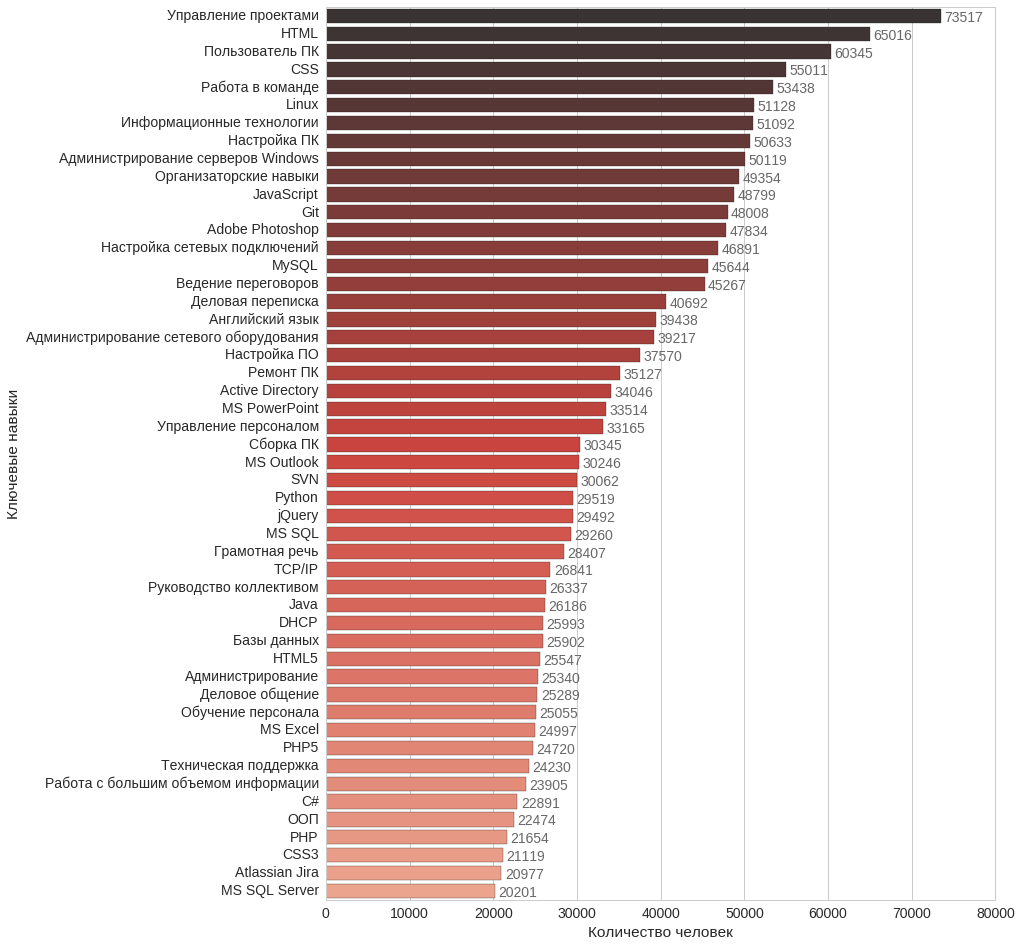
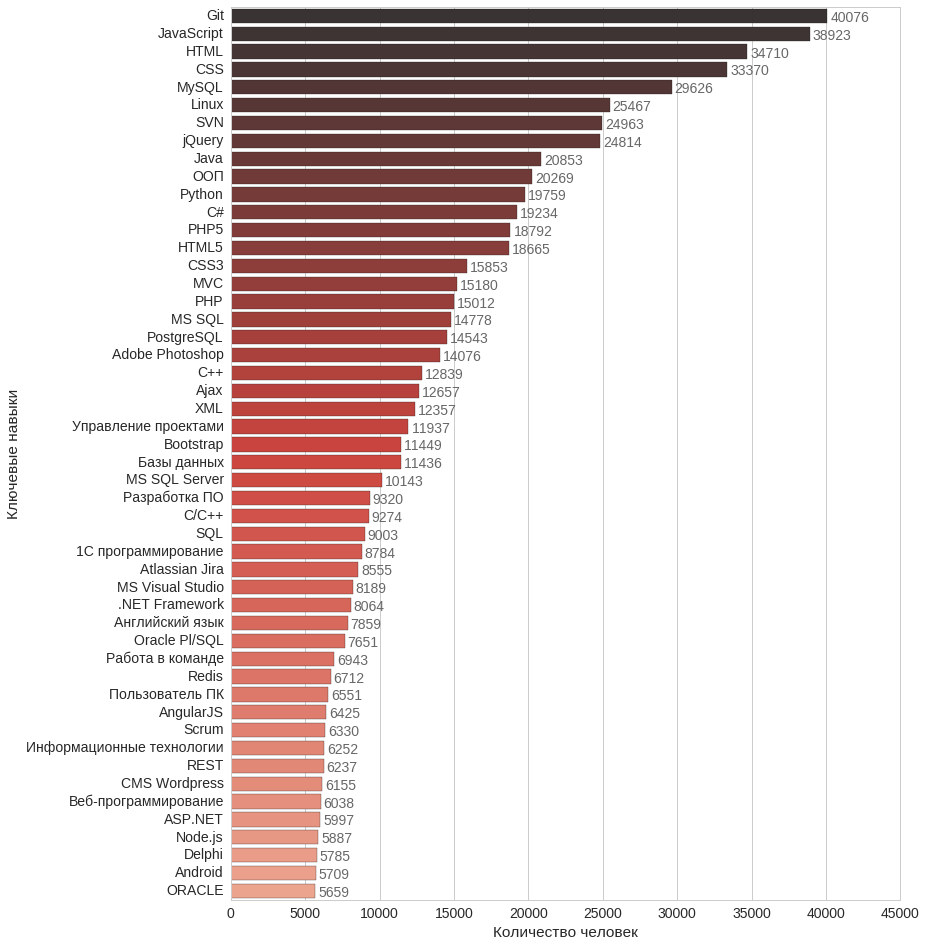
Most Popular Key IT Skills
In the summary, you can specify key skills. The following graph shows the top selected skills for all IT people.
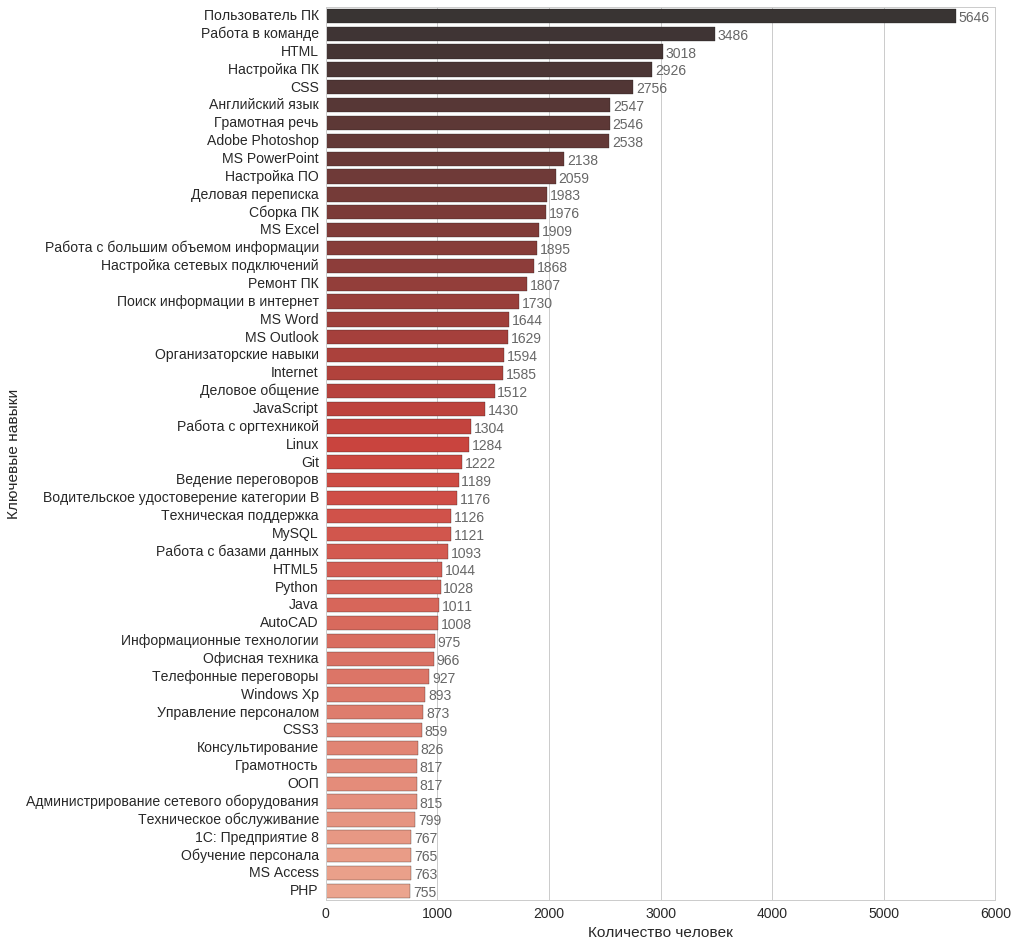
Key skills for programming, development
It is interesting to see the main key skills for developers only.
Key Skills for Career Start Specialization
Distribution of cash expectations by key skills
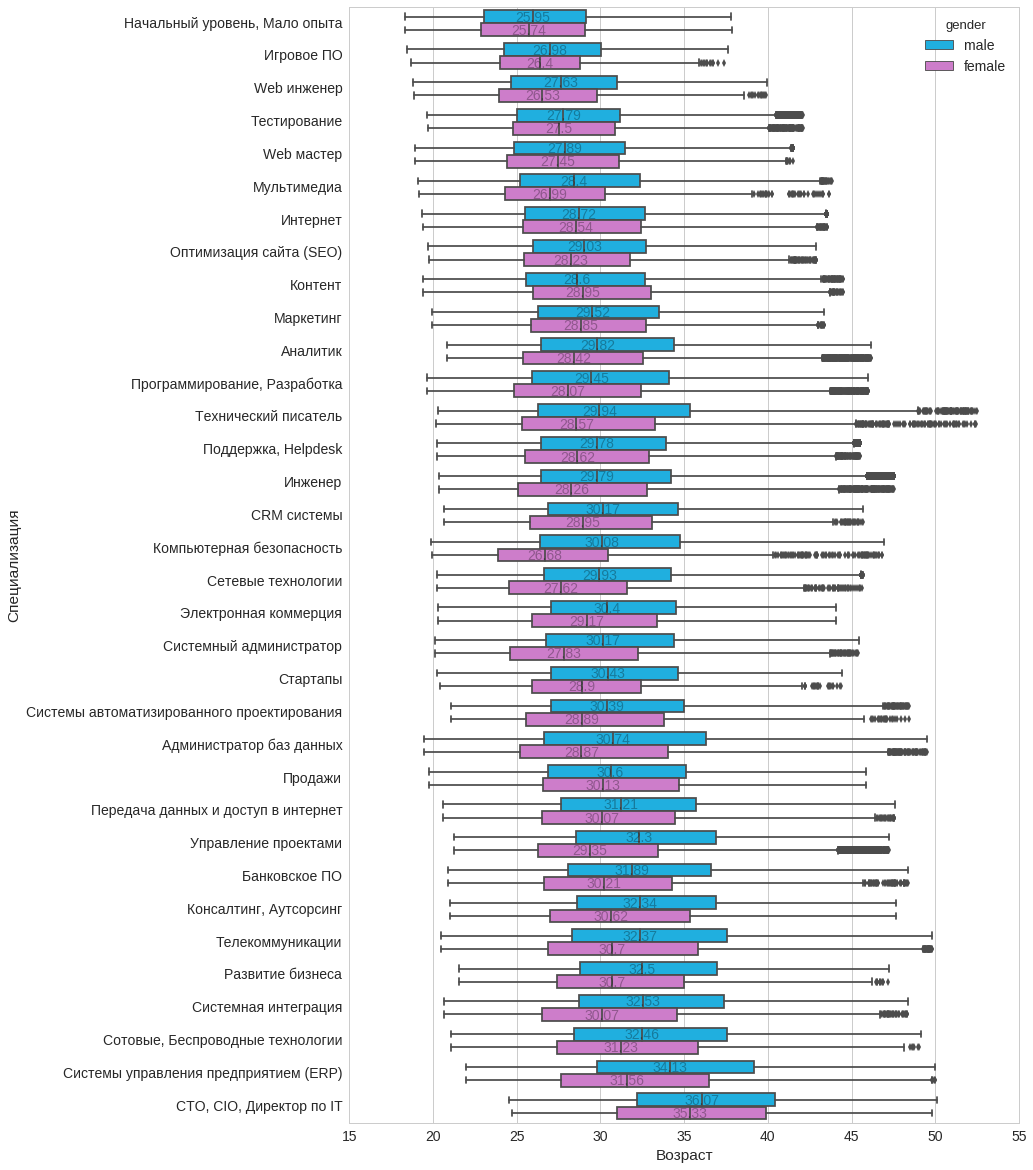
Age distribution by IT specialization
Young people often go to the web and toys. I think this is a great entry point to IT.
Dependence of salary on work experience
The order is broken only by those who have worked for more than 20 years. Most likely, this is because there are many people in this category who have come to IT from another area. As in the resume, people often like to indicate not only the relevant experience of this trade area.
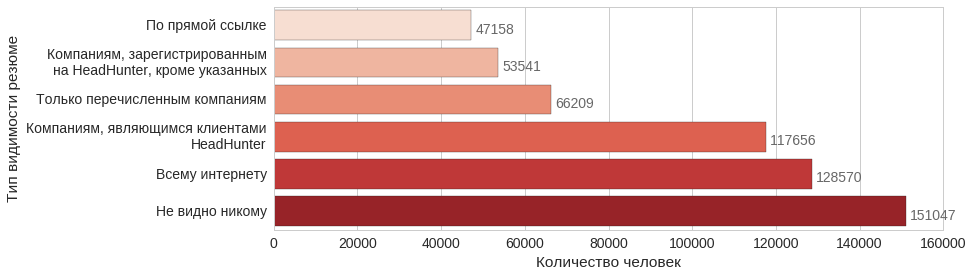
Distribution of summaries by visibility status
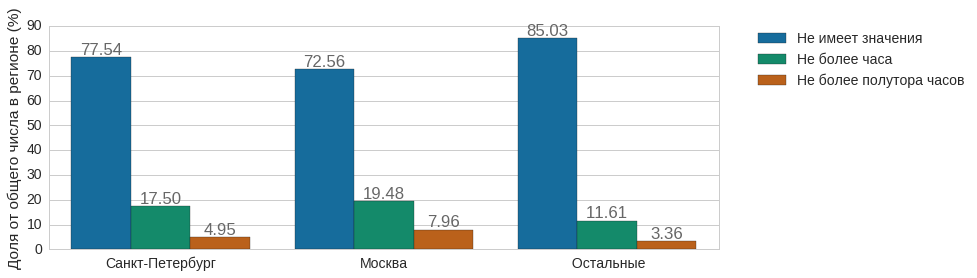
Preferred travel time
Most indicate that the time spent on the road to work does not matter. In St. Petersburg and Moscow, people are somewhat more deeply aware of this “it does not matter” and therefore they choose this item less often.
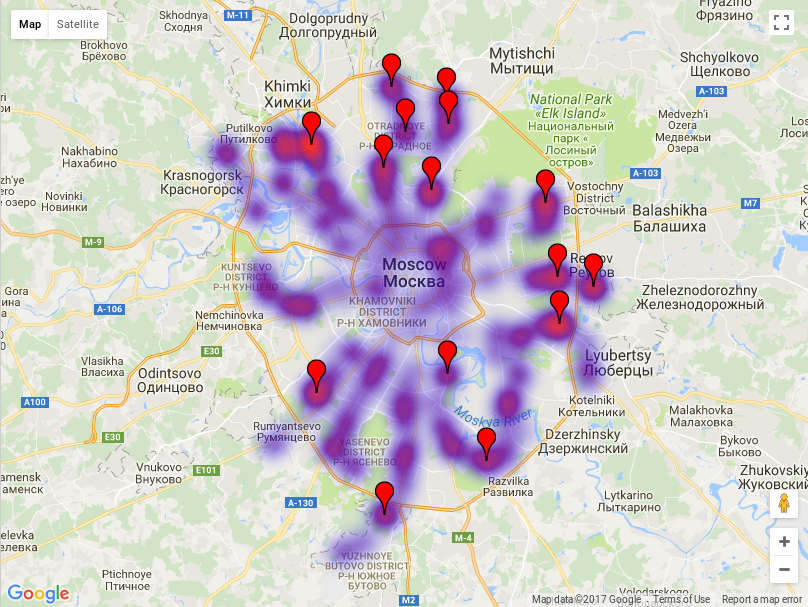
Nearest metro station
In the summary, you can specify the nearest metro station. Let's see for Moscow, where the most people.
I did not find an easy way to put a text label in the Python gmap, therefore the stations marked with markers are marked separately:
Most of these stations are the main points of entry into the city from crowded, crowded places.
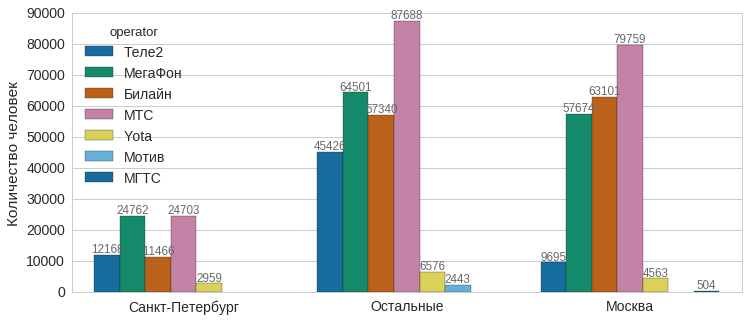
What cellular operators do IT-users use?
I downloaded the DEF code base on the Rossvyaz website, combed it a bit and matched it with the phone numbers from the resume.
Which email is used
For the given schedule I have united various domains of one company in one group. By the way, a curious fact, which is not visible on the graph, about Yandex. Mail, that the overwhelming majority indicate in the email-address the domain yandex.ru, and not ya.ru
I have always believed that the coolest guys use Gmail, the middle ones use Yandex, and the rest use Mail.ru. Now let's see what salary expectations will be in these three groups.
So guys, if you want more money, you know what to do.
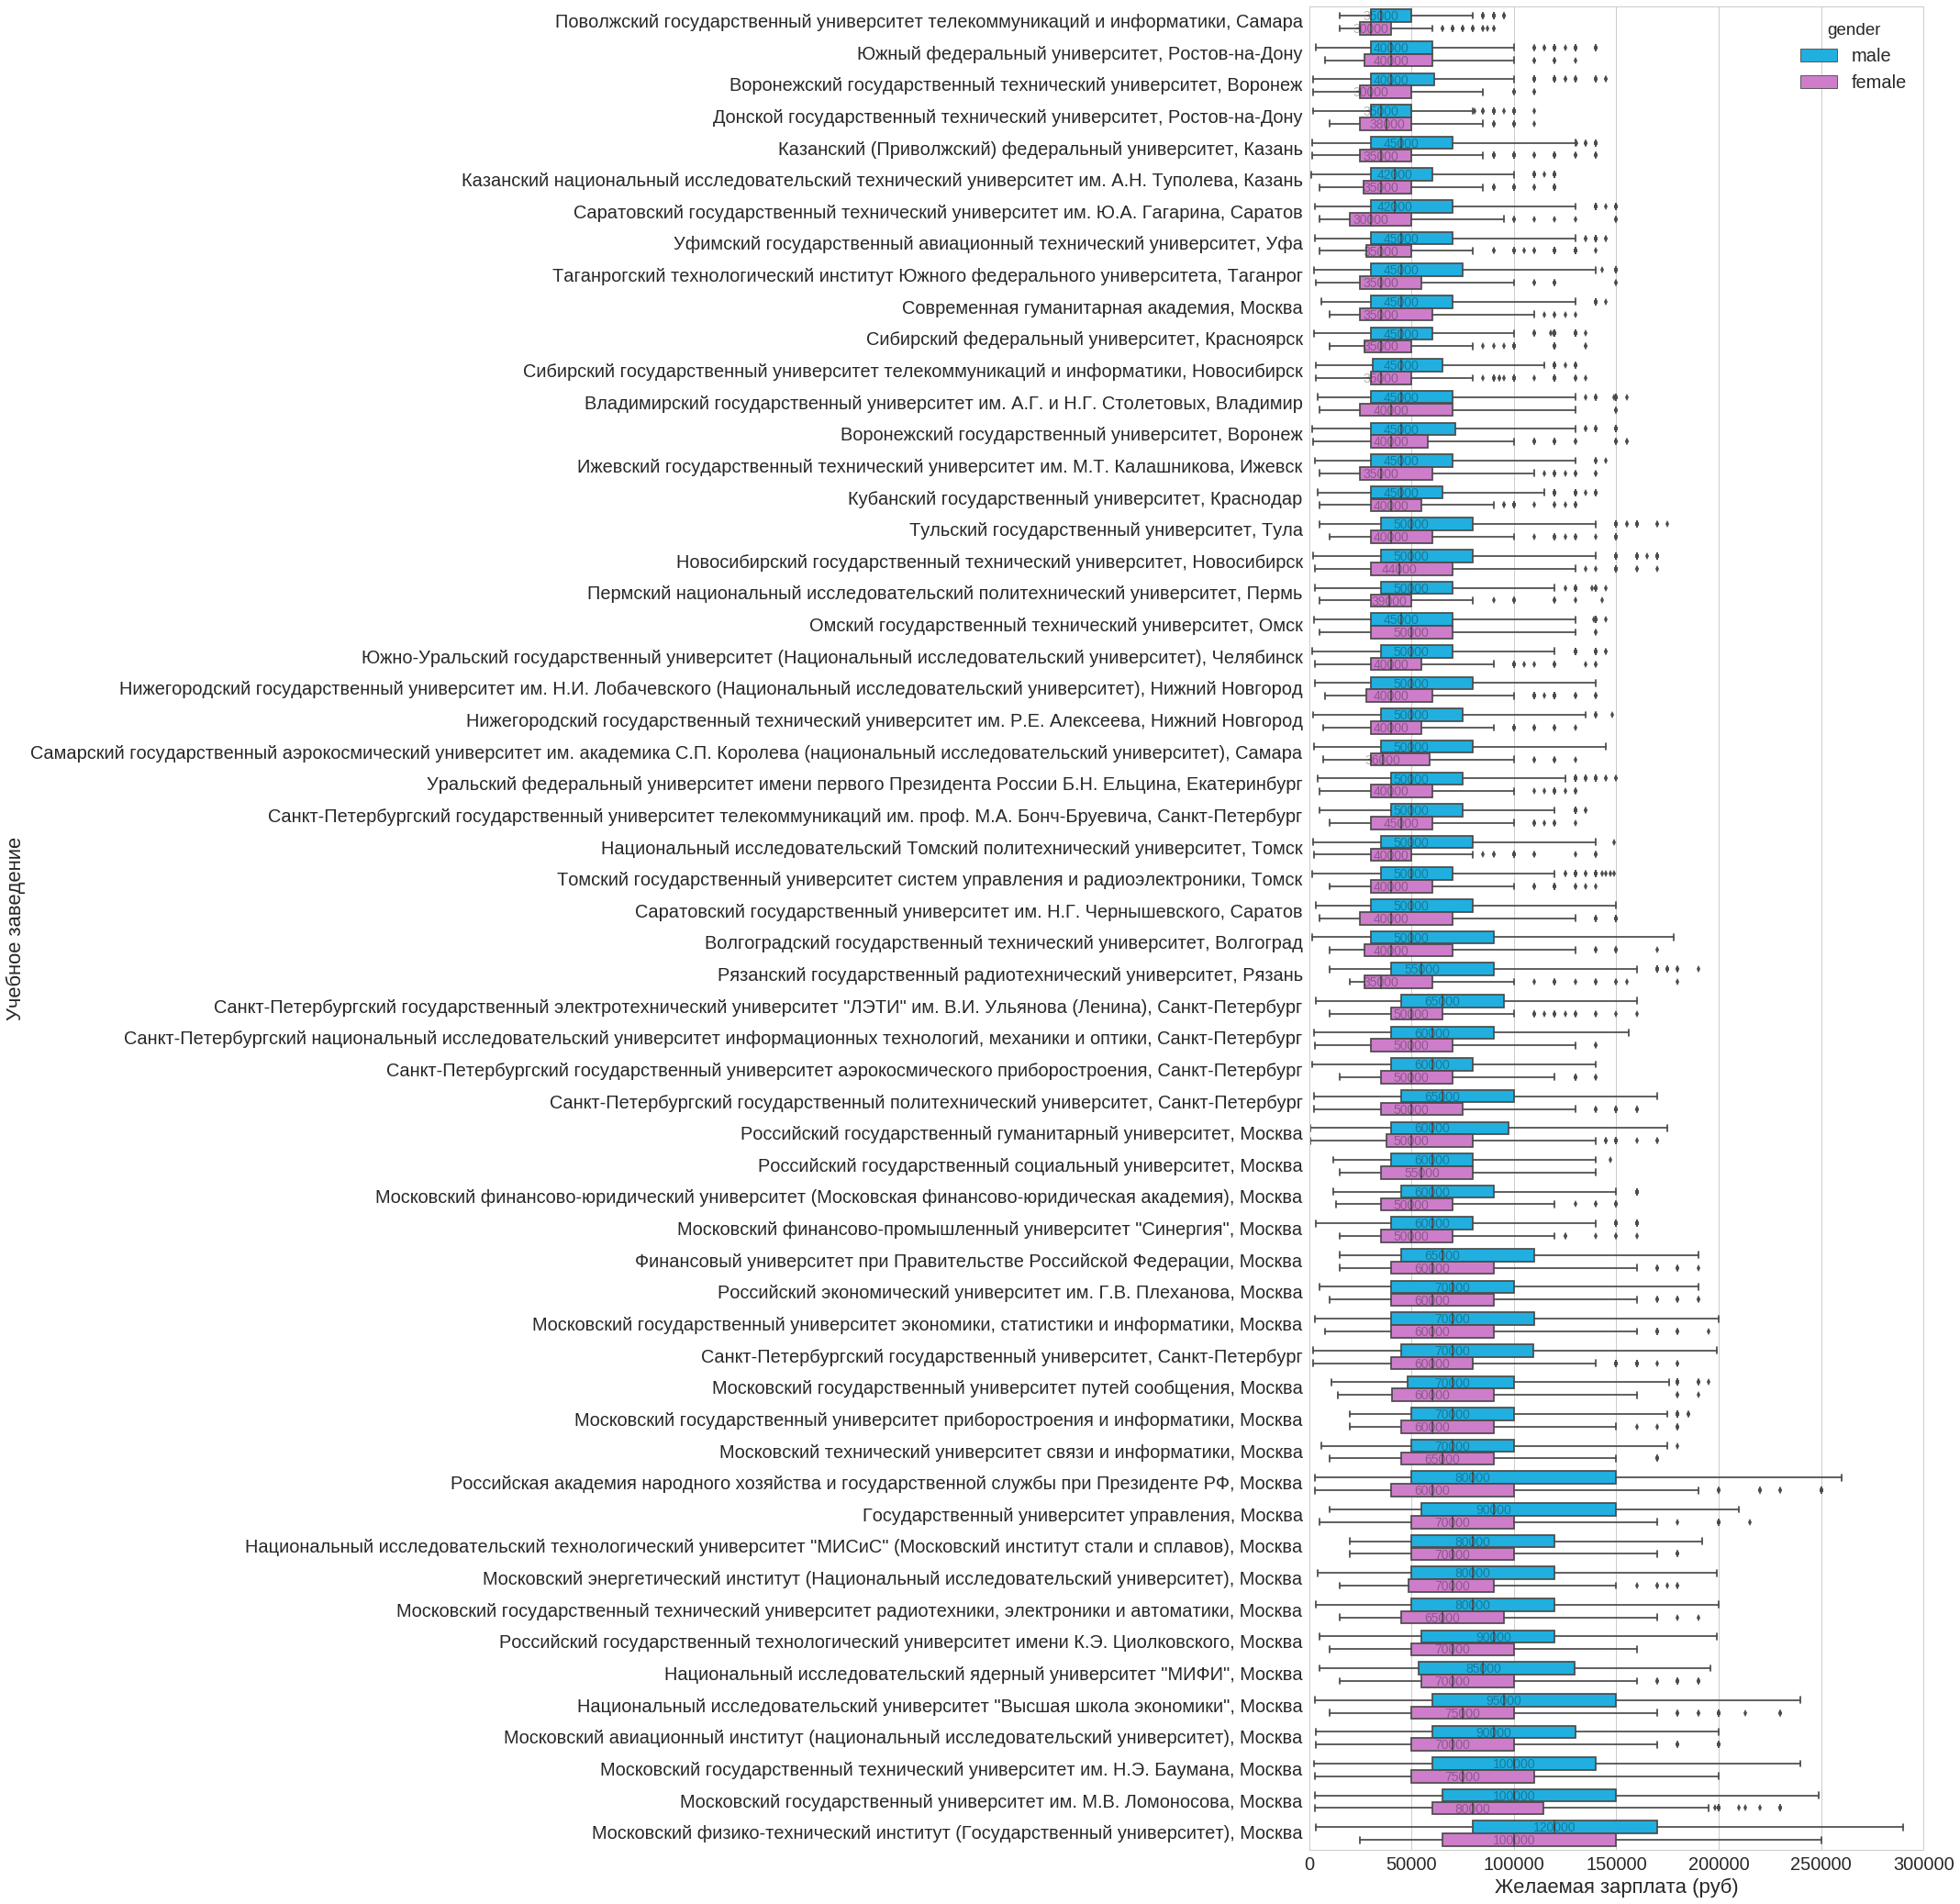
Distribution of desired salary at universities
Well, now let's see what high school graduates want the most money. I sifted out all the institutions where less than 1,000 people from the sample studied.
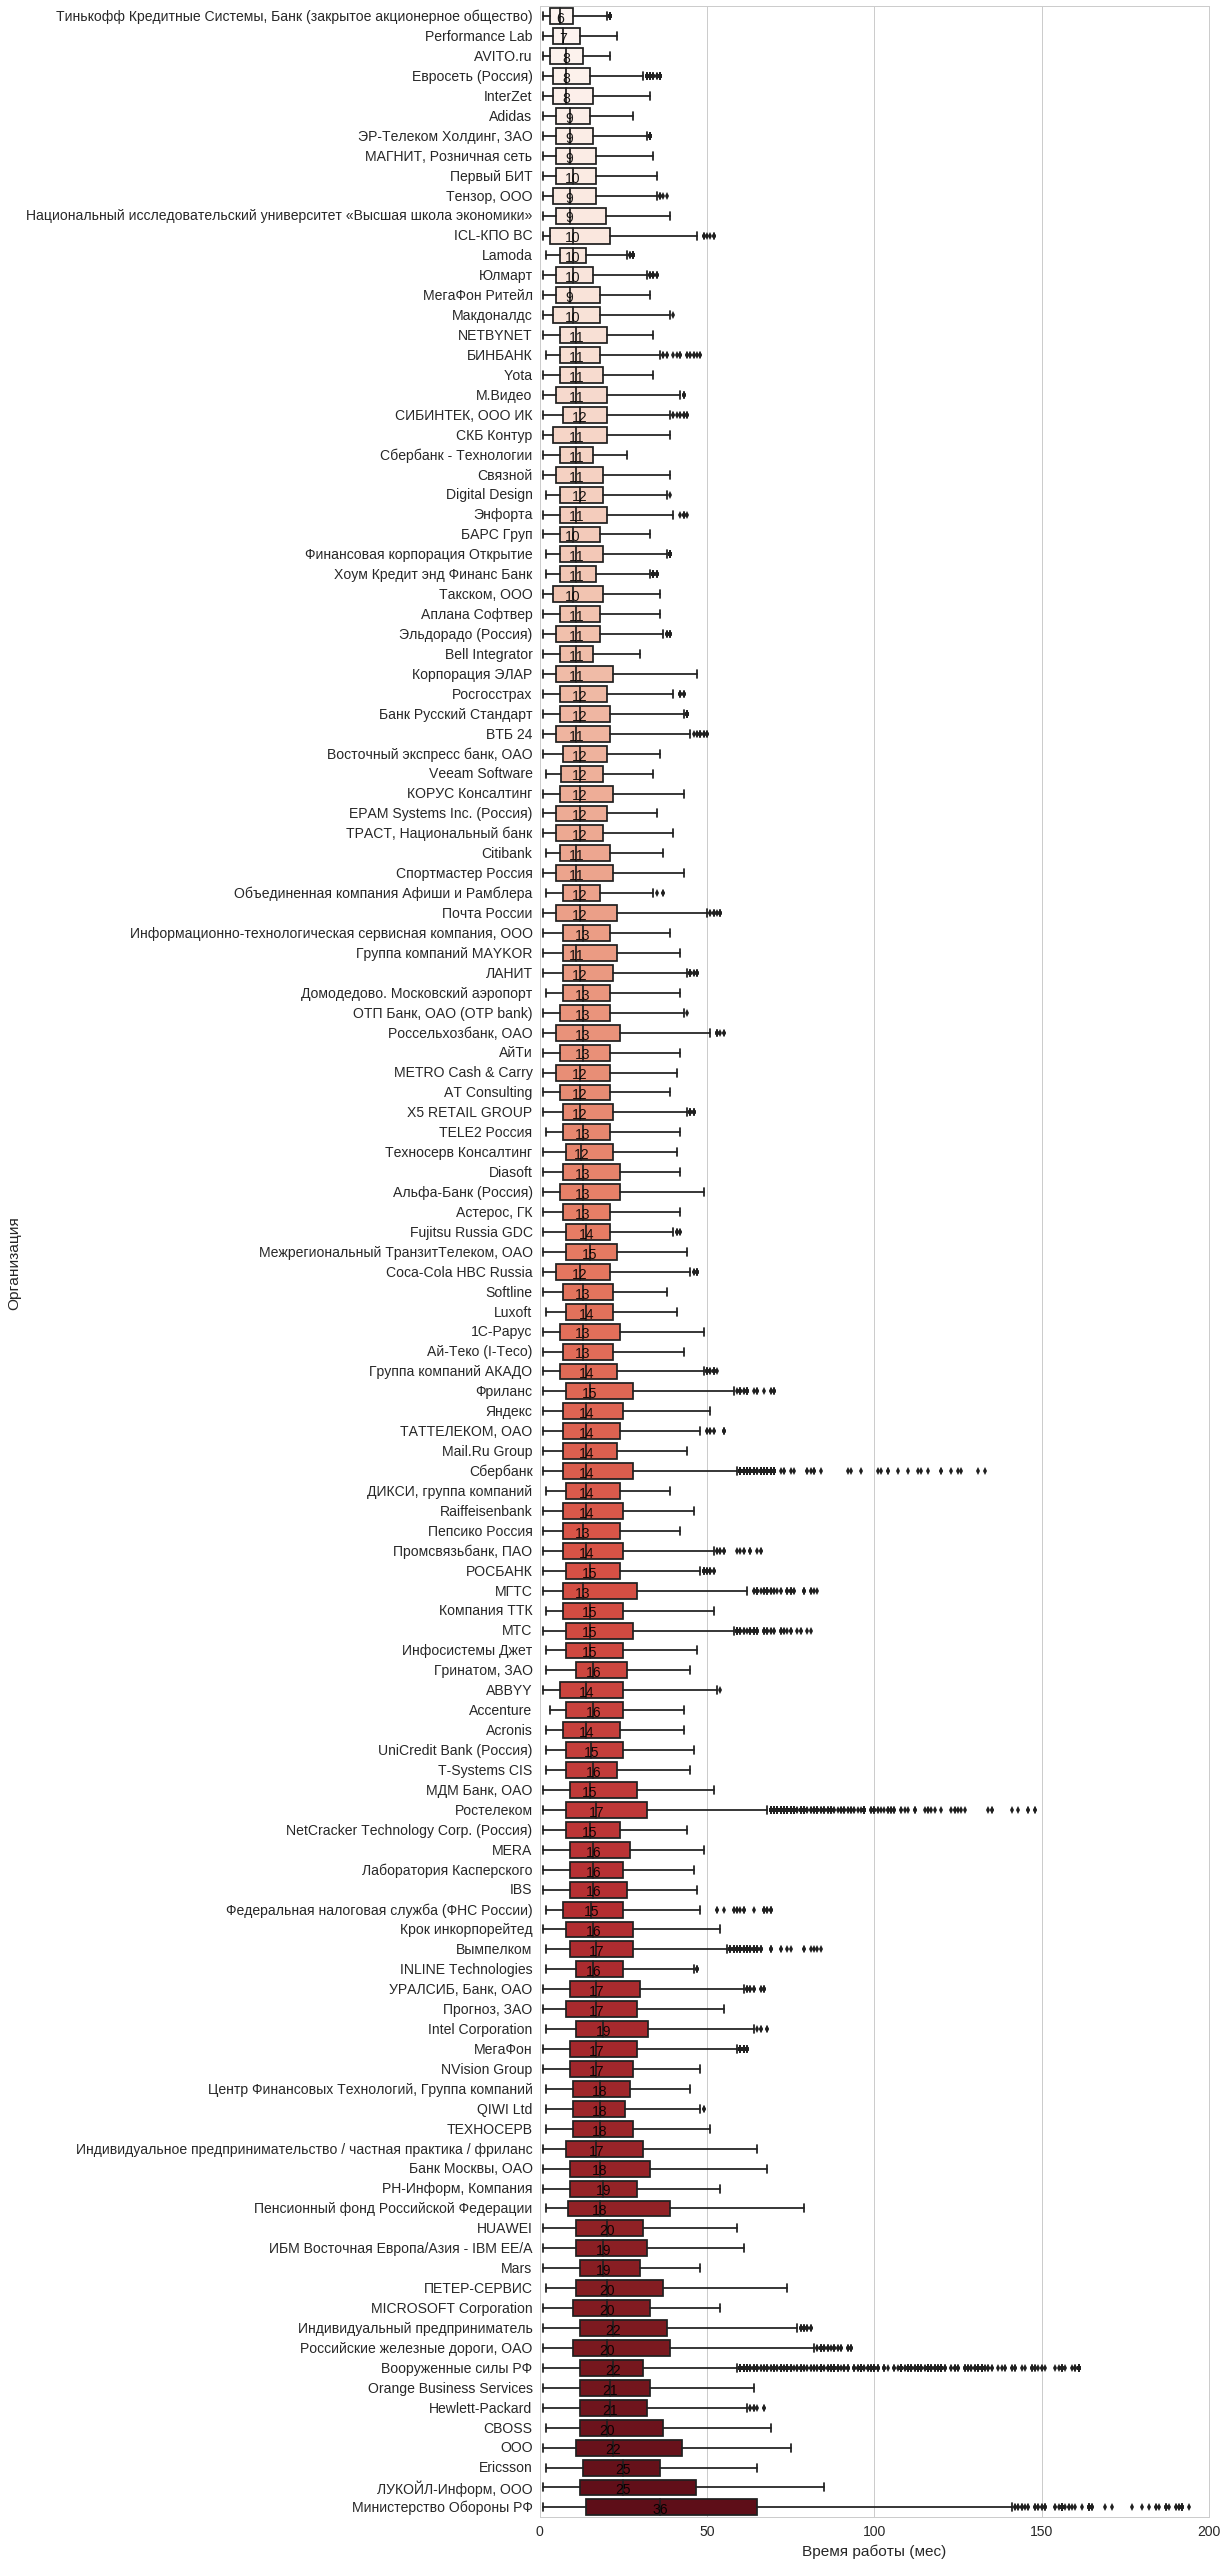
In which companies people work the longest
In work experience, you can specify the duration of work in this company. I took everything that more than 500 IT people went through.
It is seen that not very IT organizations come across. This is because work experience indicates not only relevant experience.
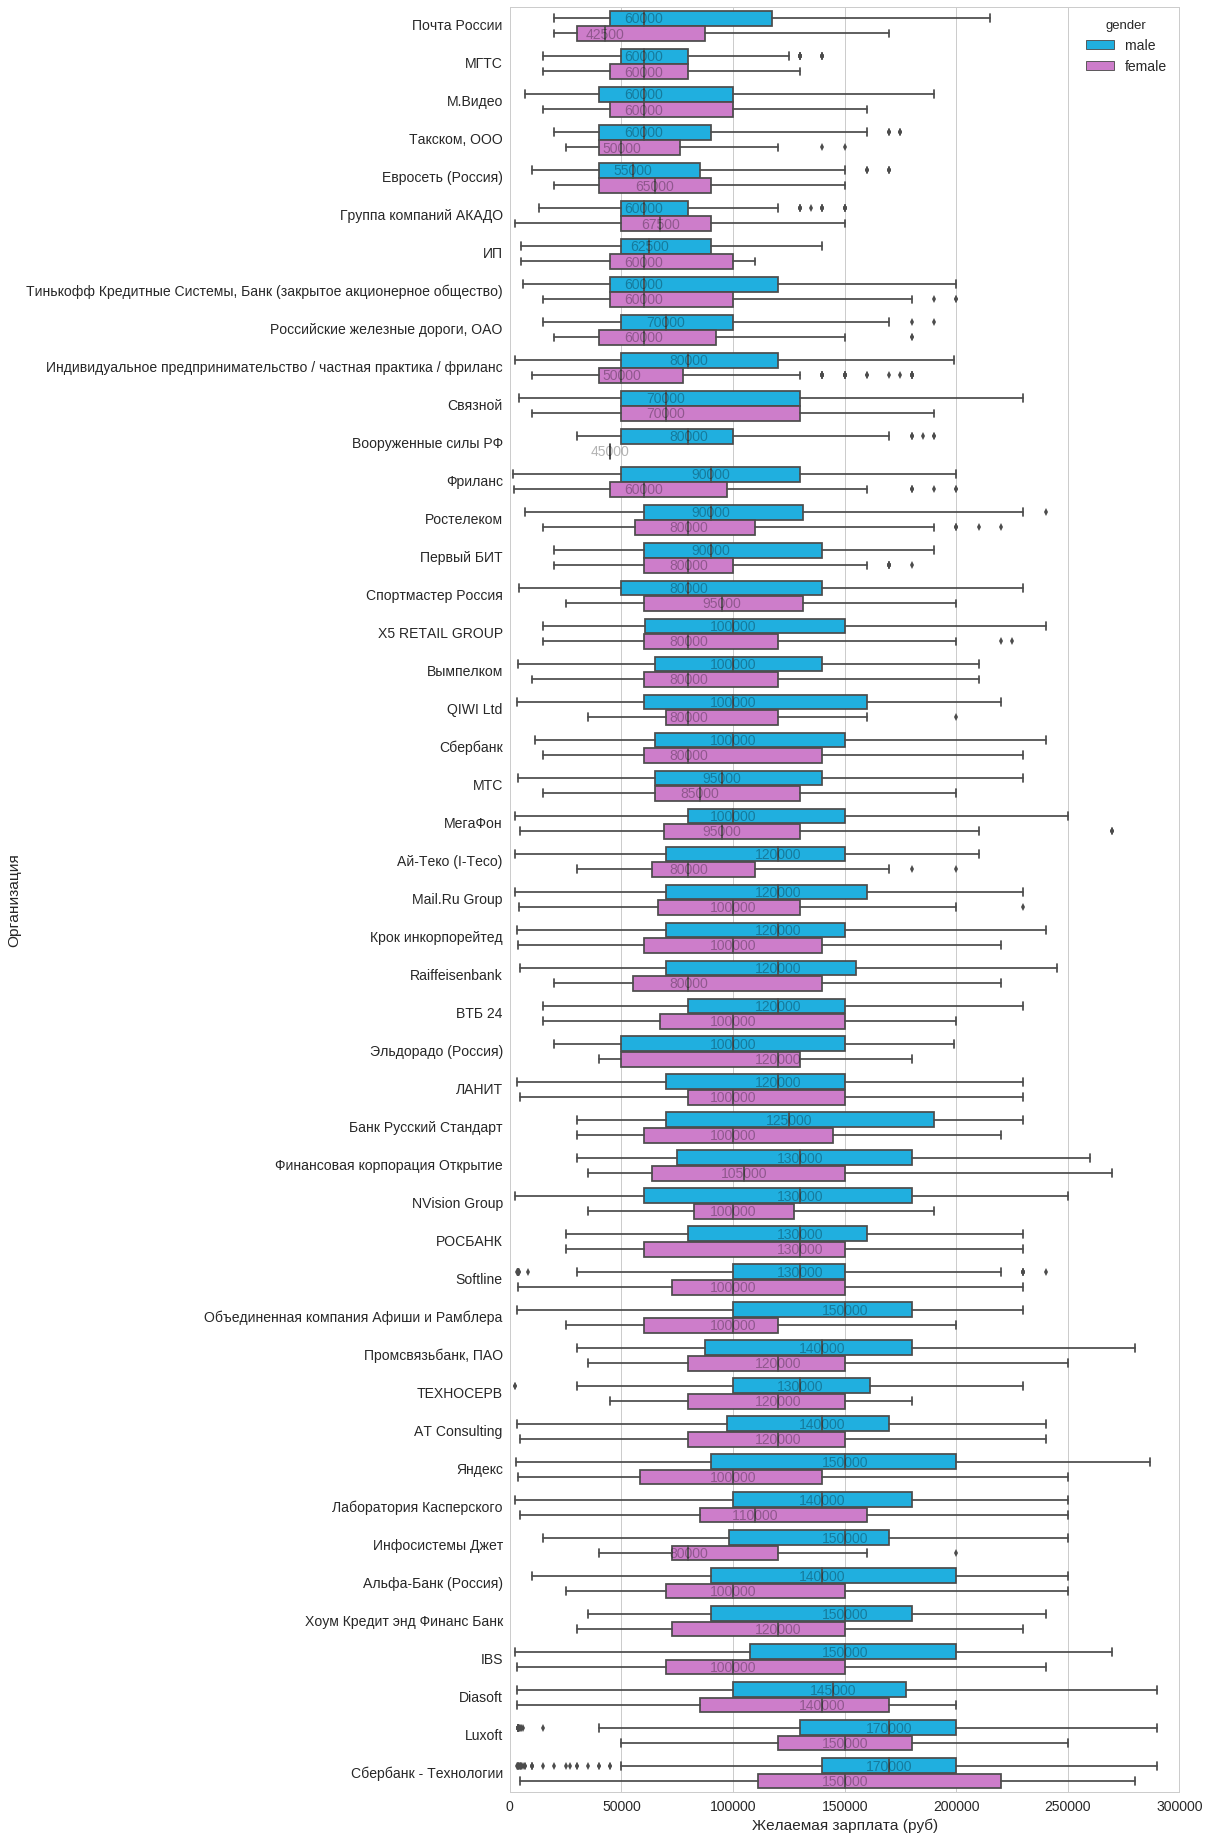
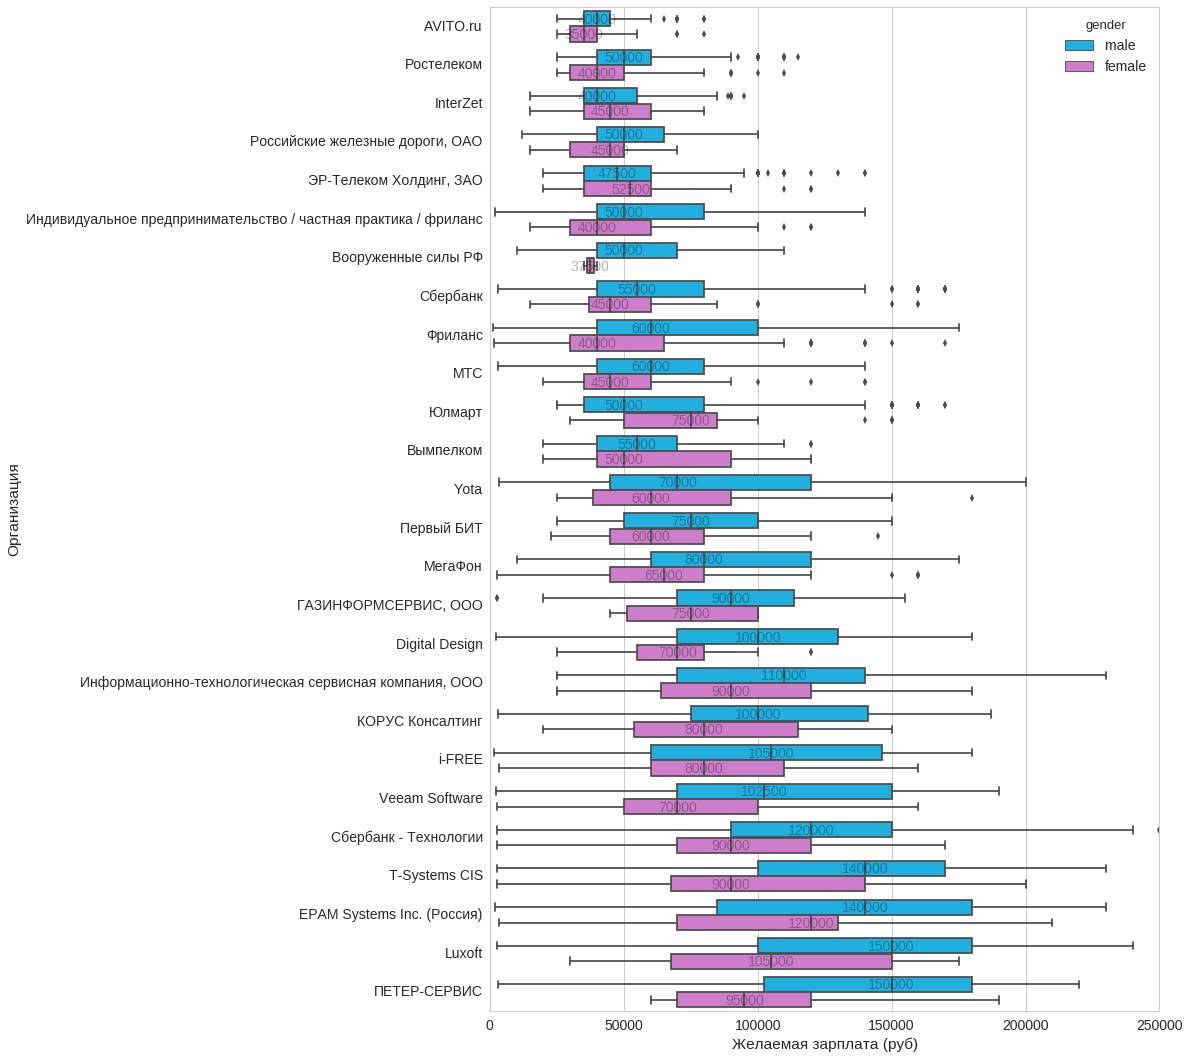
Distribution of desired salary with experience in the company
Let's see, people with experience in which companies want the most money. Take Moscow and Peter separately.
Moscow:
St. Petersburg:
In the process of drawing graphs, I had more and more new ideas of what could be done more, but I decided to dwell on what is. If this post goes well, I will continue.
They helped me in drawing graphs: Python , Jupyter notebook , Pandas , Seaborn , Apache Hive and others.
Ask questions.
Thanks to all.
UPD : I cleaned the last three schedules a bit by combining different spellings of the same organization
Source: https://habr.com/ru/post/344724/
All Articles