Search for application performance issues with NodeJs (with examples)
Because of the single-threaded Node.js architecture, it is important to be alert to the high performance of your application and to avoid bottlenecks in the code that can lead to subsidence in performance and take away valuable CPU resources from the server application.
This article will discuss how to monitor the CPU load of a nodejs application, detect resource-intensive code areas, and solve possible problems with a 100% CPU core load.

1. CPU profiling of the application. Instruments
Fortunately, the developers have handy tools for detecting and visualizing the hot spots of the CPU load.
Chrome DevTools Inspector
First of all, this is a profiler built into Chrome DevTools that will communicate with the NodeJs application via WebSocket (standard port 9229 ).
Run the nodejs application with the - inspect flag
(the default port will be the standard port 9229 , which can be changed via --inspect=<> ).
If the NodeJs server is in the docker container, you need to run the node with --inspect=0.0.0.0:9229 and open the port in the Dockerfile or docker-compose.yml
Open your browser chrome: // inspect
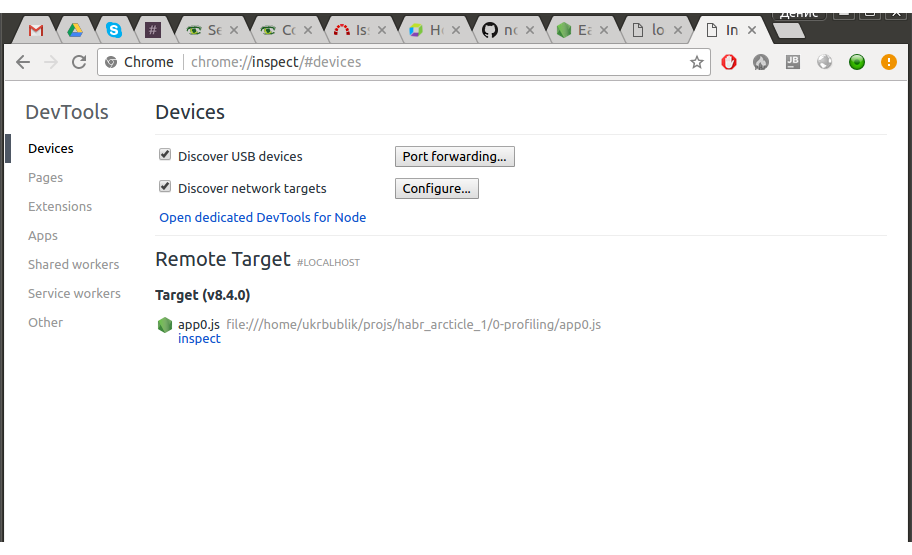
Find your application in
“Remote Target” and click “inspect” .An inspector window will open, similar to the standard “browser” Chrome DevTools.
We are interested in the “Profiler” tab, in which you can record a CPU profile at any time the application is running:
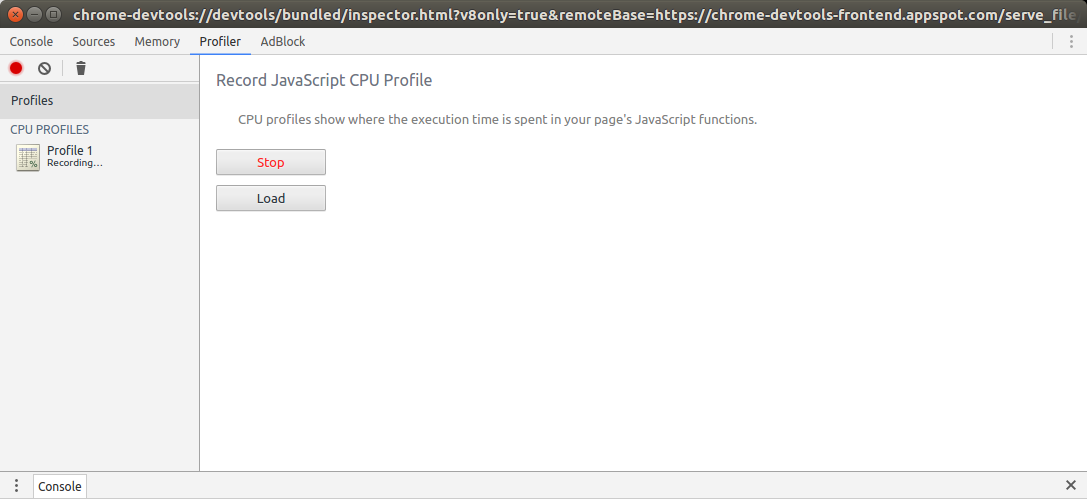
After the recording, the collected information will be presented in a convenient tabular-tree form with an indication of the working hours of each function in ms and% of the total recording time (see below).
Take for experiments a simple application (you can clone from here ) that exploits a bottleneck in either the cycle (used in another popular lib winston v2.x ) to emulate a JS code with a high CPU load.
We will compare the work of the original cycle and my revised version .
Install the application, run through npm run inspect . Open the inspector, start recording the CPU profile. In the opened page http://localhost:5001/ click "Run CPU intensive task" , after completion (alert with the text “ok”) complete the recording of the CPU profile. As a result, you can see a picture that indicates the most voracious runOrigDecycle() in this case, runOrigDecycle() and runFixedDecycle() , compare their%):
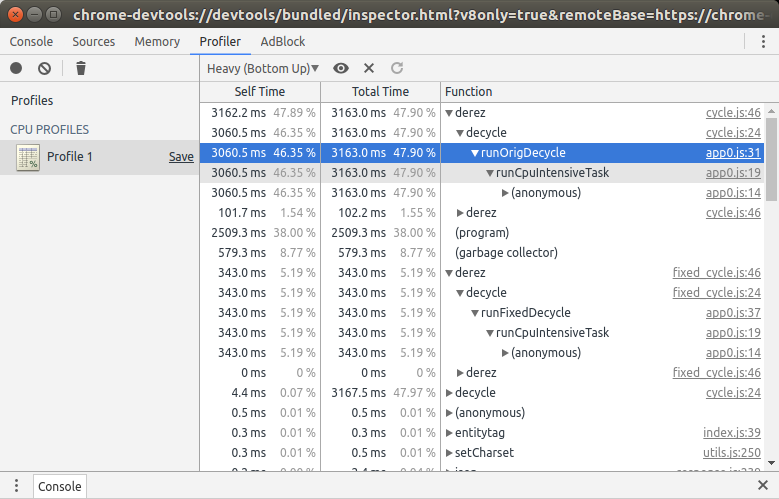
')
NodeJs Profiler
Another option is to use the profiler built into NodeJs to create CPU performance reports. Unlike the inspector, it will show data for the entire time the application is running.
Run the nodejs application with the --prof flag
In the application folder, a file of the form isolate-0xXXXXXXX-v8.log will be created, in which data about “ticks” will be written.
The data in this file is inconvenient for analysis, but from it you can generate a human-readable report using the commandnode --prof-process < isolate-*-v8.log>
An example of such a report for a test application is higher here
(To generate it yourself, run npm run prof )
There are also some npm packages for profiling - v8-profiler
that provides a JS interface to the profiler API V8, as well as a node-inspector (deprecated after the release of the profiler built into Chrome DevTools-based).
2. Solving the problem of a blocking JS code without an inspector
Suppose it so happened that an infinite loop crept into the code or another error leading to a complete blocking of the execution of the JS code on the server. In this case, a single NodeJs thread will be blocked, the server will stop responding, and the CPU core load will reach 100%. If the inspector is not started yet, then launching it will not help you to catch the guilty piece of code.
In this case, gdb debugger can help.
For docker you need to use--cap-add=SYS_PTRACE
and install packagesapt-get install libc6-dbg libc-dbg gdb valgrind
So, you need to connect to the nodejs process (knowing its pid):sudo gdb -p <pid>
After connecting, enter the commands:
b v8::internal::Runtime_StackGuard p 'v8::Isolate::GetCurrent'() p 'v8::Isolate::TerminateExecution'($1) c p 'v8::internal::Runtime_DebugTrace'(0, 0, (void *)($1)) quit I will not go into the details of what each team is doing, I can only say that it uses some internal functions of the V8 engine .
As a result, the execution of the current blocking JS code in the current “tick” will be stopped, the application will continue its work (if you use Express, the server will be able to process incoming requests further), and the trace trace will be output to the standard output stream of the NodeJs application.
It is quite long , but you can find useful information in it - the call stack of JS functions.
Find lines of this type:
--------- sourcecode --------- function infLoopFunc() {\x0a //this will lock server\x0a while(1) {;}\x0a} ----------------------------------------- They should help identify the “guilty” code.
For convenience, I wrote a script to automate this process with recording the call stack in a separate log file: loop-terminator.sh
See also the sample application with its intuitive use.
3. Update NodeJs (and npm packages)
Sometimes you are not to blame :)
I stumbled upon a funny bug in nodejs <v8.5.0 (checked at 8.4.0, 8.3.0), which, under certain circumstances, causes a 100% load on 1 of the CPU core.
The code for a simple application to repeat this bug is here .
The idea is that the application starts the WebSocket server (on socket-io ) and starts one child process via child_process.fork() . The following sequence of actions is guaranteed to cause 100% load on 1 CPU core:
- Client connects to WS-North
- The child process is terminated and re-created.
- Client disconnects from WS
Moreover, the application is still working, Express server responds to requests.
Probably, the bug is in libuv , and not in the node itself. I did not find the true reason for this bug and the commit it correcting in changelog. Easy “google” led to similar bugs in older versions:
https://github.com/joyent/libuv/issues/1099
https://github.com/nodejs/node-v0.x-archive/issues/6271
The solution is simple - update the node to v8.5.0 +.
4. Use child processes
If there is a resource-intensive code in your server application, which loads the CPU considerably, making it a separate child process can be a good solution. For example, it may be server rendering of a React application.
Create a separate NodeJs application and start it from the main one through child_process.fork() . For communication between processes, use the IPC channel. Developing a messaging system between processes is fairly easy, because ChildProcess is a descendant of EventEmitter .
But remember that creating too many child NodeJs processes is not recommended.
Speaking of performance, another equally important metric is RAM consumption. There are tools and techniques for finding memory leaks, but this is a topic for a separate article.
Source: https://habr.com/ru/post/344672/
All Articles