Building a business analysis process in projects for the development of BI-applications with advanced visualization
Disclaimer
We all see that the sphere of advanced analytics is gaining momentum and more and more specialists are interested in this field. At the same time, there are not so many clear and accessible information about building a business analysis process when developing analytical applications in open sources. Therefore, it is very difficult to determine the correct recipe (sequence of actions) in this direction. In this regard, I decided to systematize the key ingredients and share with you a step-by-step instruction that describes the analyst’s actions to work out the subject area and turn the nebulous task “do this, I don’t know what” into detailed requirements for the future application.

The following description of the process will be based on the specifics of the development of analytical applications in our company. The material will be useful not only for application developers, but also for new BI analysts.
So, let's begin!
The analysis process in our analytical application development projects consists of the following steps:
')
- Setting the task and getting started;
- Inspection of the customer and work with open sources;
- Analysis, formation of requirements and documentation;
- Formation of the final document "Description of the application."
Task setting and start of work
The work begins with what comes to the sales manager with the words: "There is a certain company," Horns and hoofs, "she really needs some kind of analytical application." Such a formulation of the problem is encountered in our life quite often, and we have long been accustomed to this.
Therefore, the first question that we ask, in order to end up with not “some”, but an application that is useful to the customer, is the question: “What kind of“ pain ”(problem) does this customer have that he could solve using data analysis? "
The answer to this question can be obtained in two ways:
- Ask the customer. The path is correct, but the pain of the customer is desirable to know even before the first meeting in order to “please” him from the doorway and speak the same language with him. Although often the customer himself does not know his bottlenecks in specific processes or simply can not formulate them.
- Independently find the answer in open sources + attract experts in the subject area. In the case of a customer who does not understand what problem he wants to solve, this course is the only possible one. I think this situation is explained by the fact that, being “inside” of its business, it is difficult for the customer to look at it from the outside and clearly identify its problem areas.
Therefore, in our practice, we often follow the second path, when the work of the analyst before the first meeting with the customer is devoted to independent in-depth study of open sources (in other words, we actively google and Yandex). We are looking for information that answers the following questions:
- What processes are performed in the business of the customer or in a similar business with other companies on the market?
- What data is circulating inside such a business?
- What problems are encountered in such a business with our customer or with other companies?
- What tactical and strategic goals do such companies set themselves?
- What key performance evaluation indicators (KPI - Key Performance Indicators) of a business exist?
The main goal of studying open sources is to prepare as well as possible for the debut meeting with the customer. This is necessary in order to tune with it on one wave and offer to aim the project at solving the problem areas we found.
If we talk about the timing of preparation for the first meeting with the customer, then the amount of time spent may be different - from several hours to several days - this period depends on the complexity of the task, the industry and many other factors. In any case, the analyst has no right to go to the customer without knowing anything about him. He should prepare at least to the minimum extent possible.
Customer survey and work with open sources
This stage begins with the first setup meeting with the customer, at which we try to find out his vision of the project's tasks, which business processes are the most opaque, which zones he sees as problematic, etc. Further, we continue the research and analysis work begun at the previous stage. Also, the material provided by the client is added to our data, which expands the range of our research work.
Usually it takes several meetings with the customer, during which we are trying to "remove" the maximum amount of information necessary for the implementation of the project.
When the amount of information received and analyzed is gaining some “critical mass”, we smoothly proceed to the next stage.
A good example of one of our projects is the case "Managing the loan portfolio of a commercial bank."
Case "Banks. Credit processes
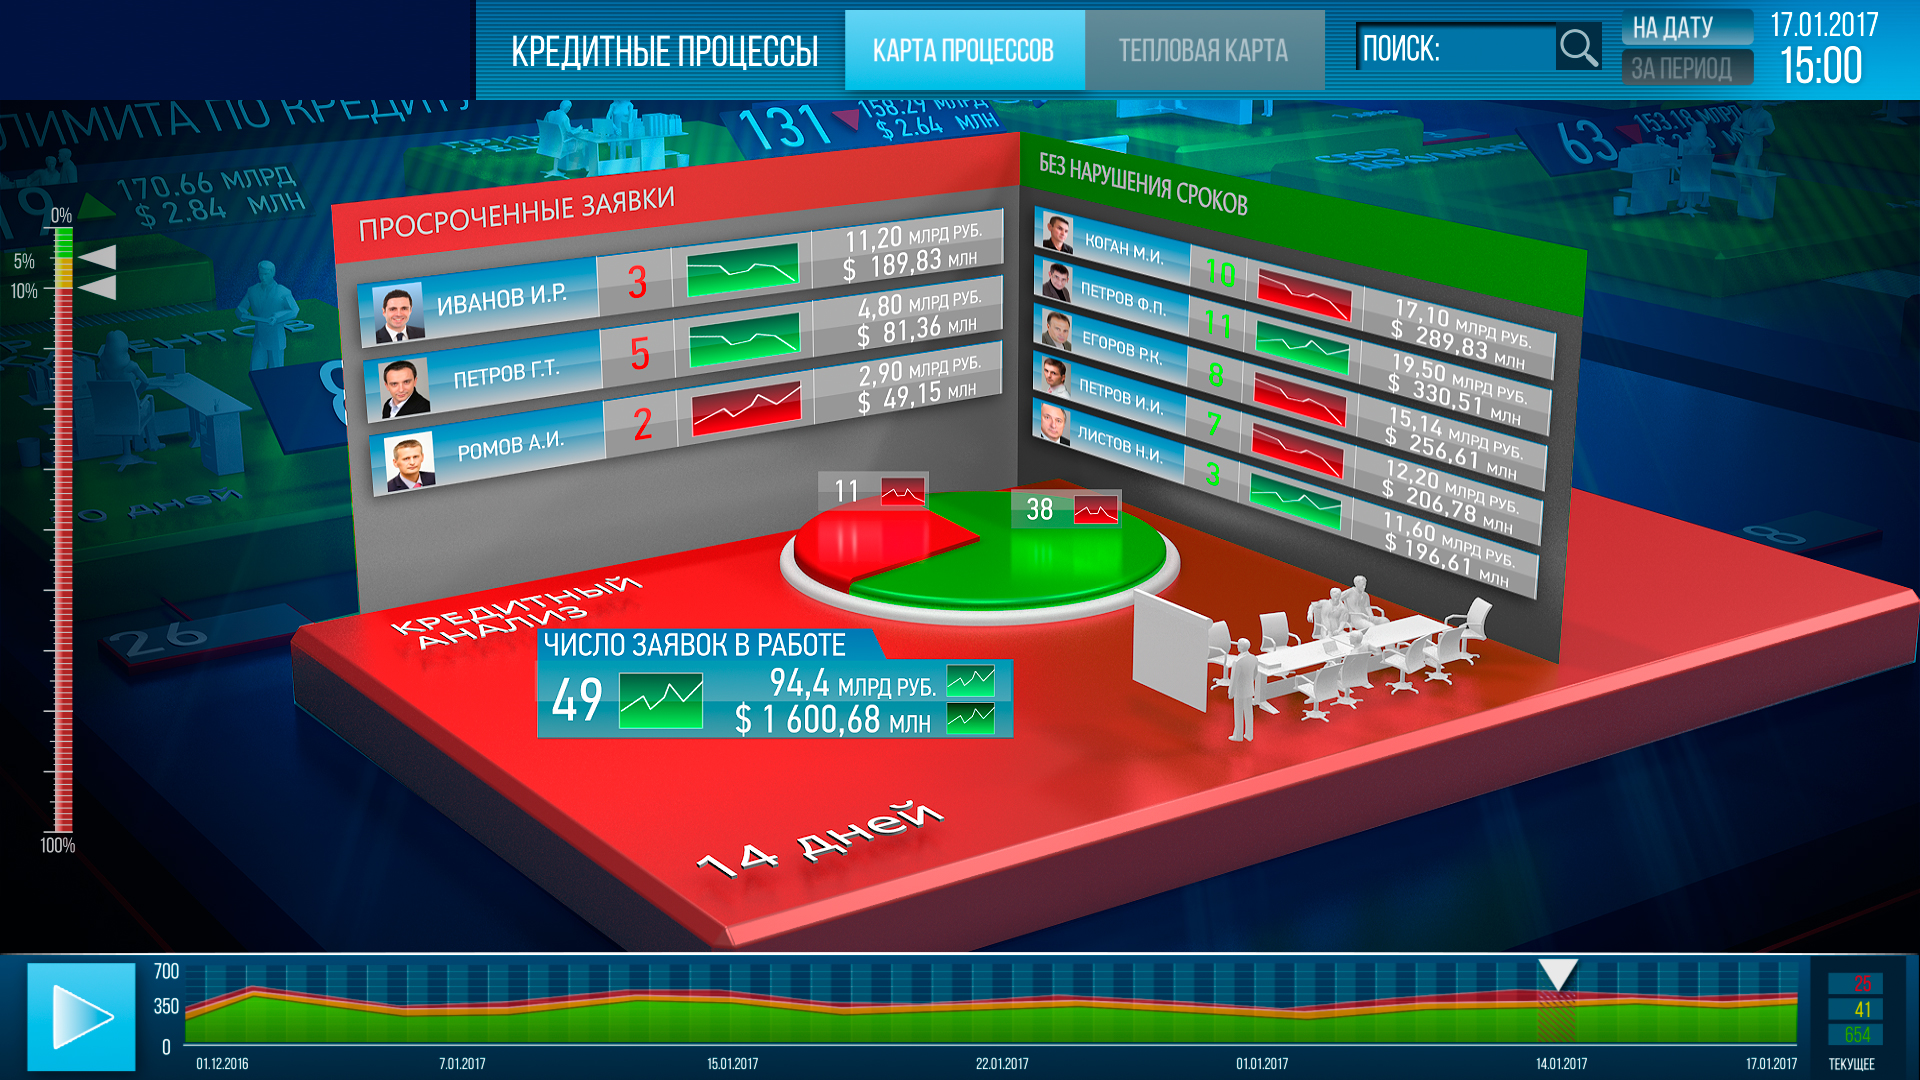
The main income of most banks is to provide loans to companies and individuals. We were assigned the task of monitoring loans to large borrowing companies.
The banks for each company have its profile, which contains information about the reliability of the company, its financial indicators. For each loan timeliness of payments is monitored. In the event of a delay in the next payment, the bank finds out the reasons for the delay and takes action against the borrowing company.
The main ideas of the application for this subject area were: monitoring the volume of loans, the reliability of borrowers, compliance with payment schedules and other indicators for loans.
The more “bad” loans in monetary terms the bank has - the worse the quality of the loan portfolio. Therefore, the management of the bank must immediately see the “bad” loans, be able to see the detailed situation of the problem loan and decide on further actions in relation to the borrower company.
Working with the application eventually becomes something similar to the game "find a problem loan and make it trouble-free."
Reading the article further, try to “try on” the stages of the analysis process on this subject area. I think that it will be much easier to read.
Analysis, formation of requirements and documentation
In reality, no transition to this stage exists; the work of this stage is performed in parallel with the work of the previous one. But I singled out it intentionally, so that the whole process of analysis looked step by step, more harmonious and structured.
So, within the framework of this block, the following activities are performed:
- Brain storms;
- Analysis of information and the formation of requirements;
- Drawing screenshots of the application.
When the project analyst has already received quite a lot of information about the customer's business, he organizes a meeting (brain storm), at which he and leading analysts of our company come up with the main ideas that will be the basis of the future application. After that, these ideas are deeply worked out, determining the stages of implementation. As a result, we finally formulate the main problem of the customer’s business and decide what our application will be aimed at.
Next, we determine the composition of indicators, monitoring and analysis of which will help the customer to alleviate his pain. We specify the composition and structure of the screen forms on which the customer will work with these indicators.
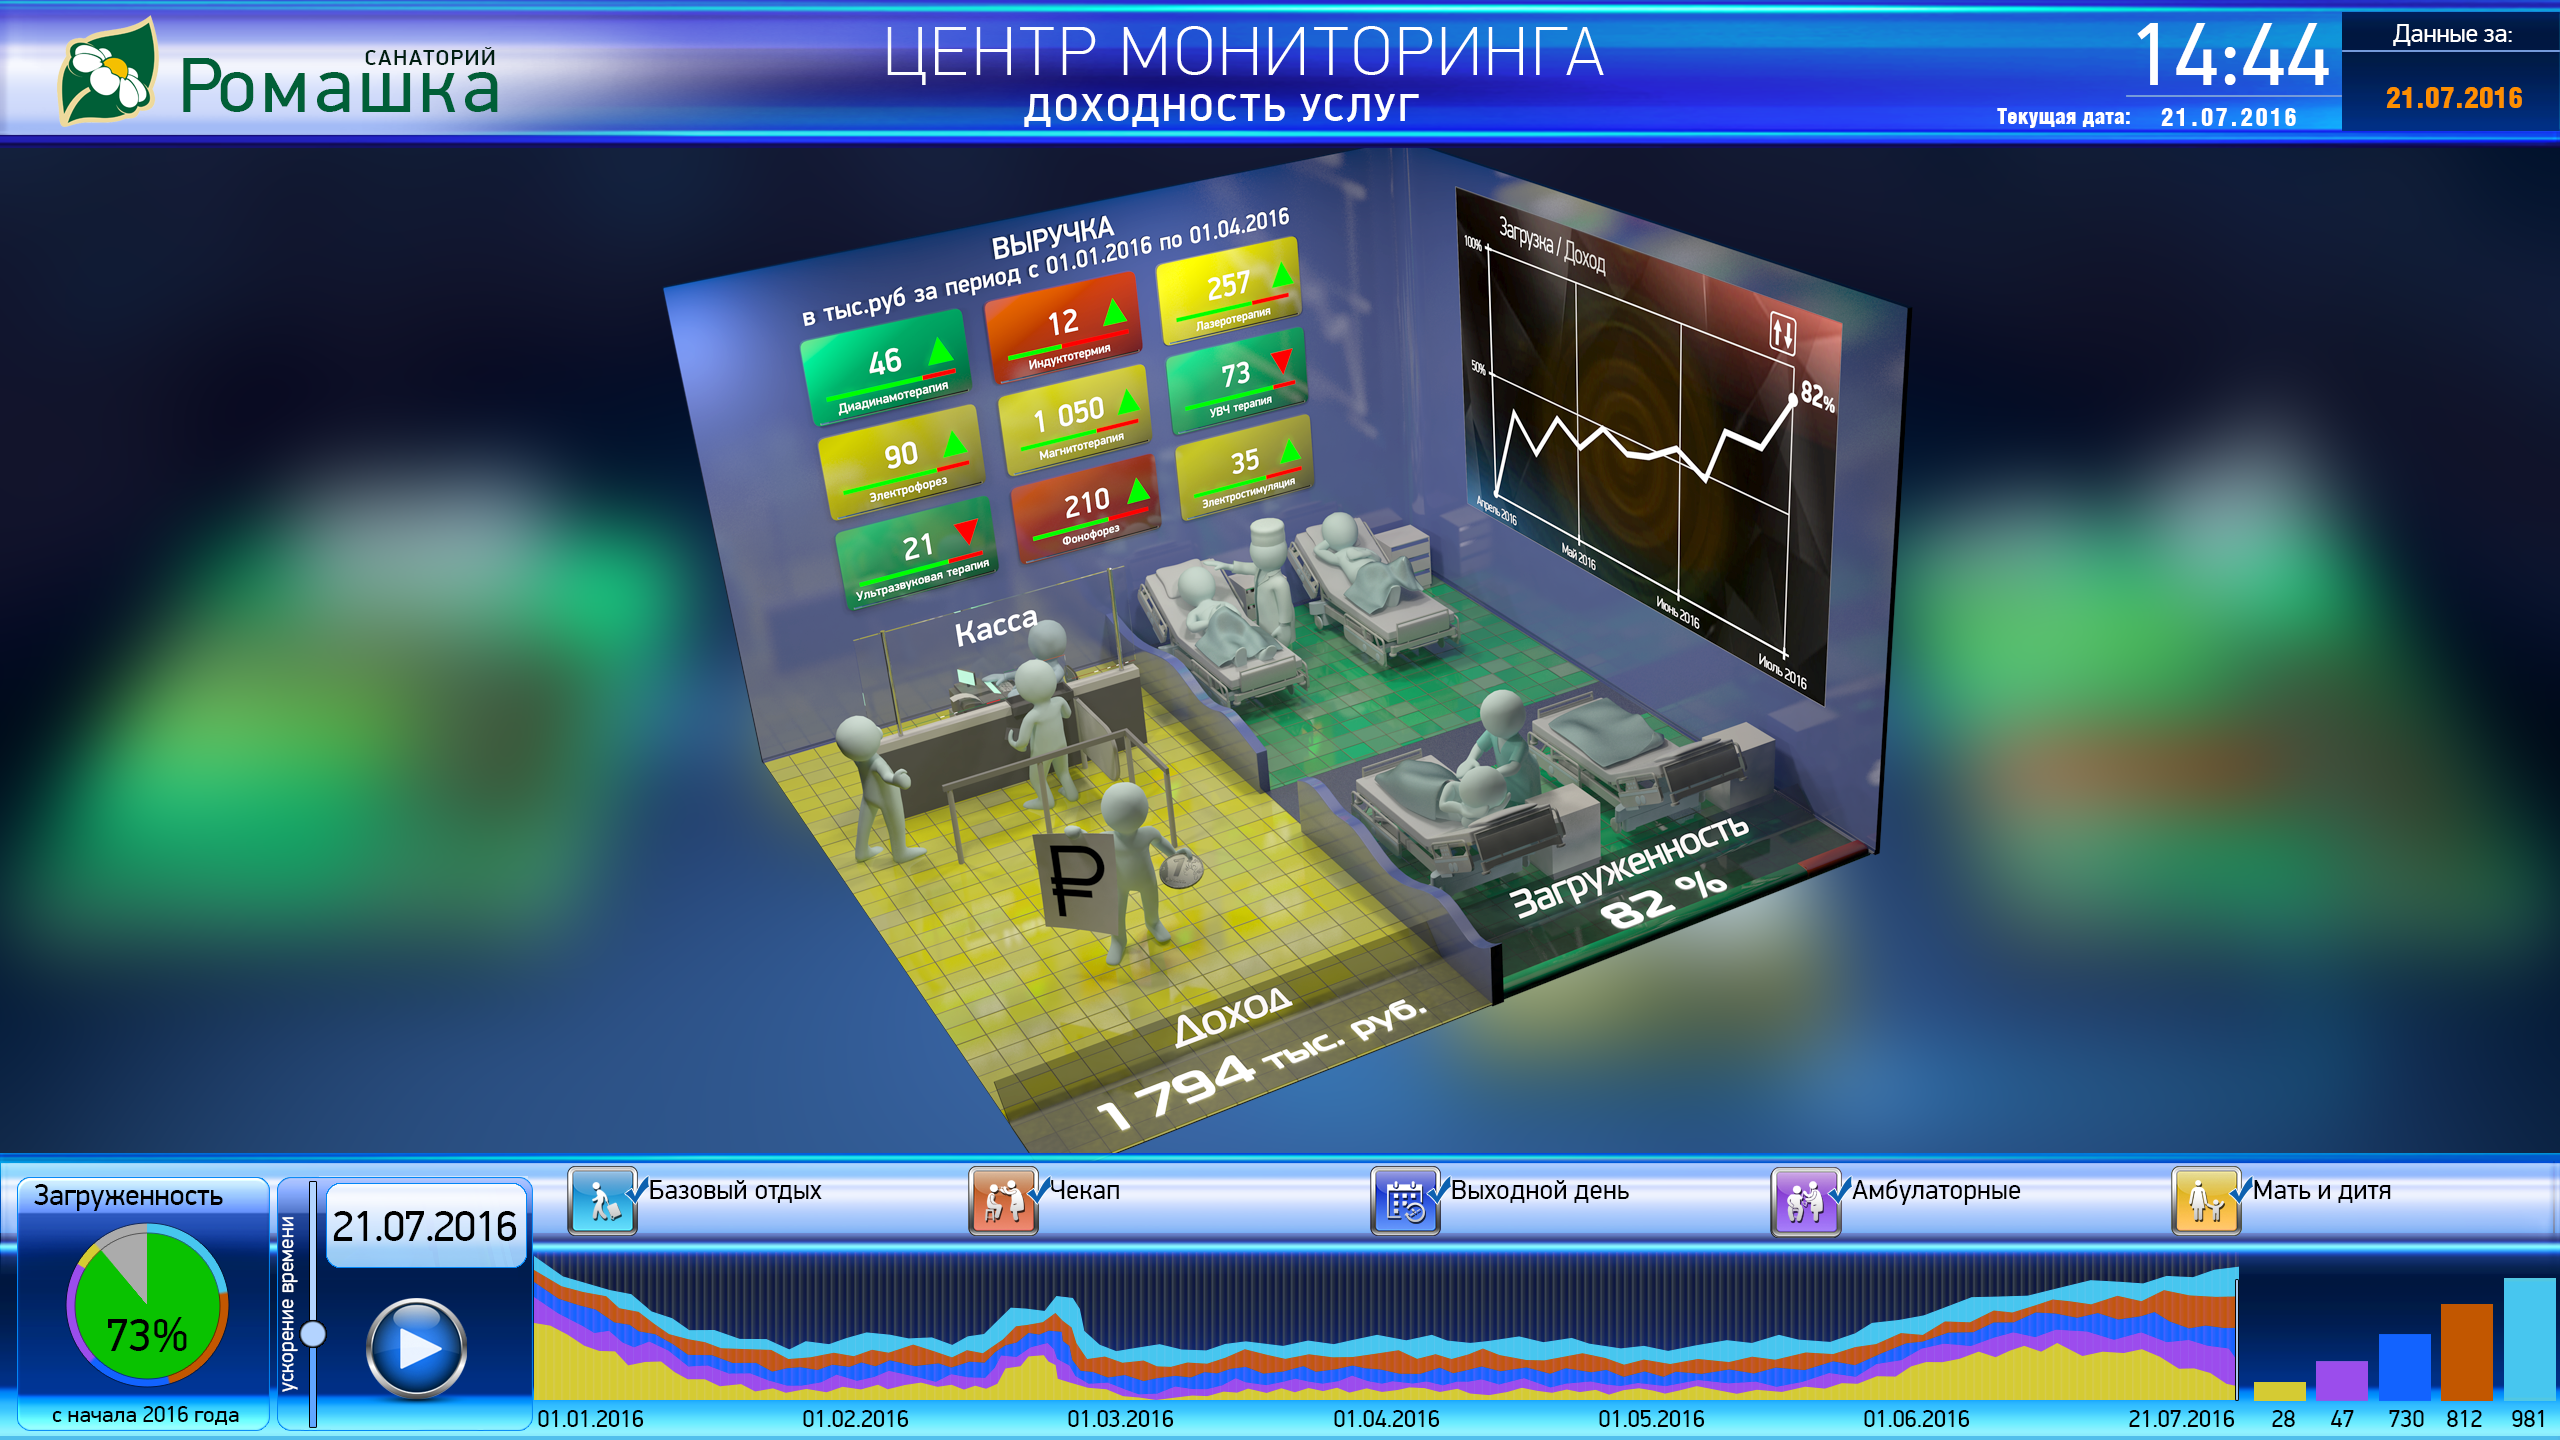
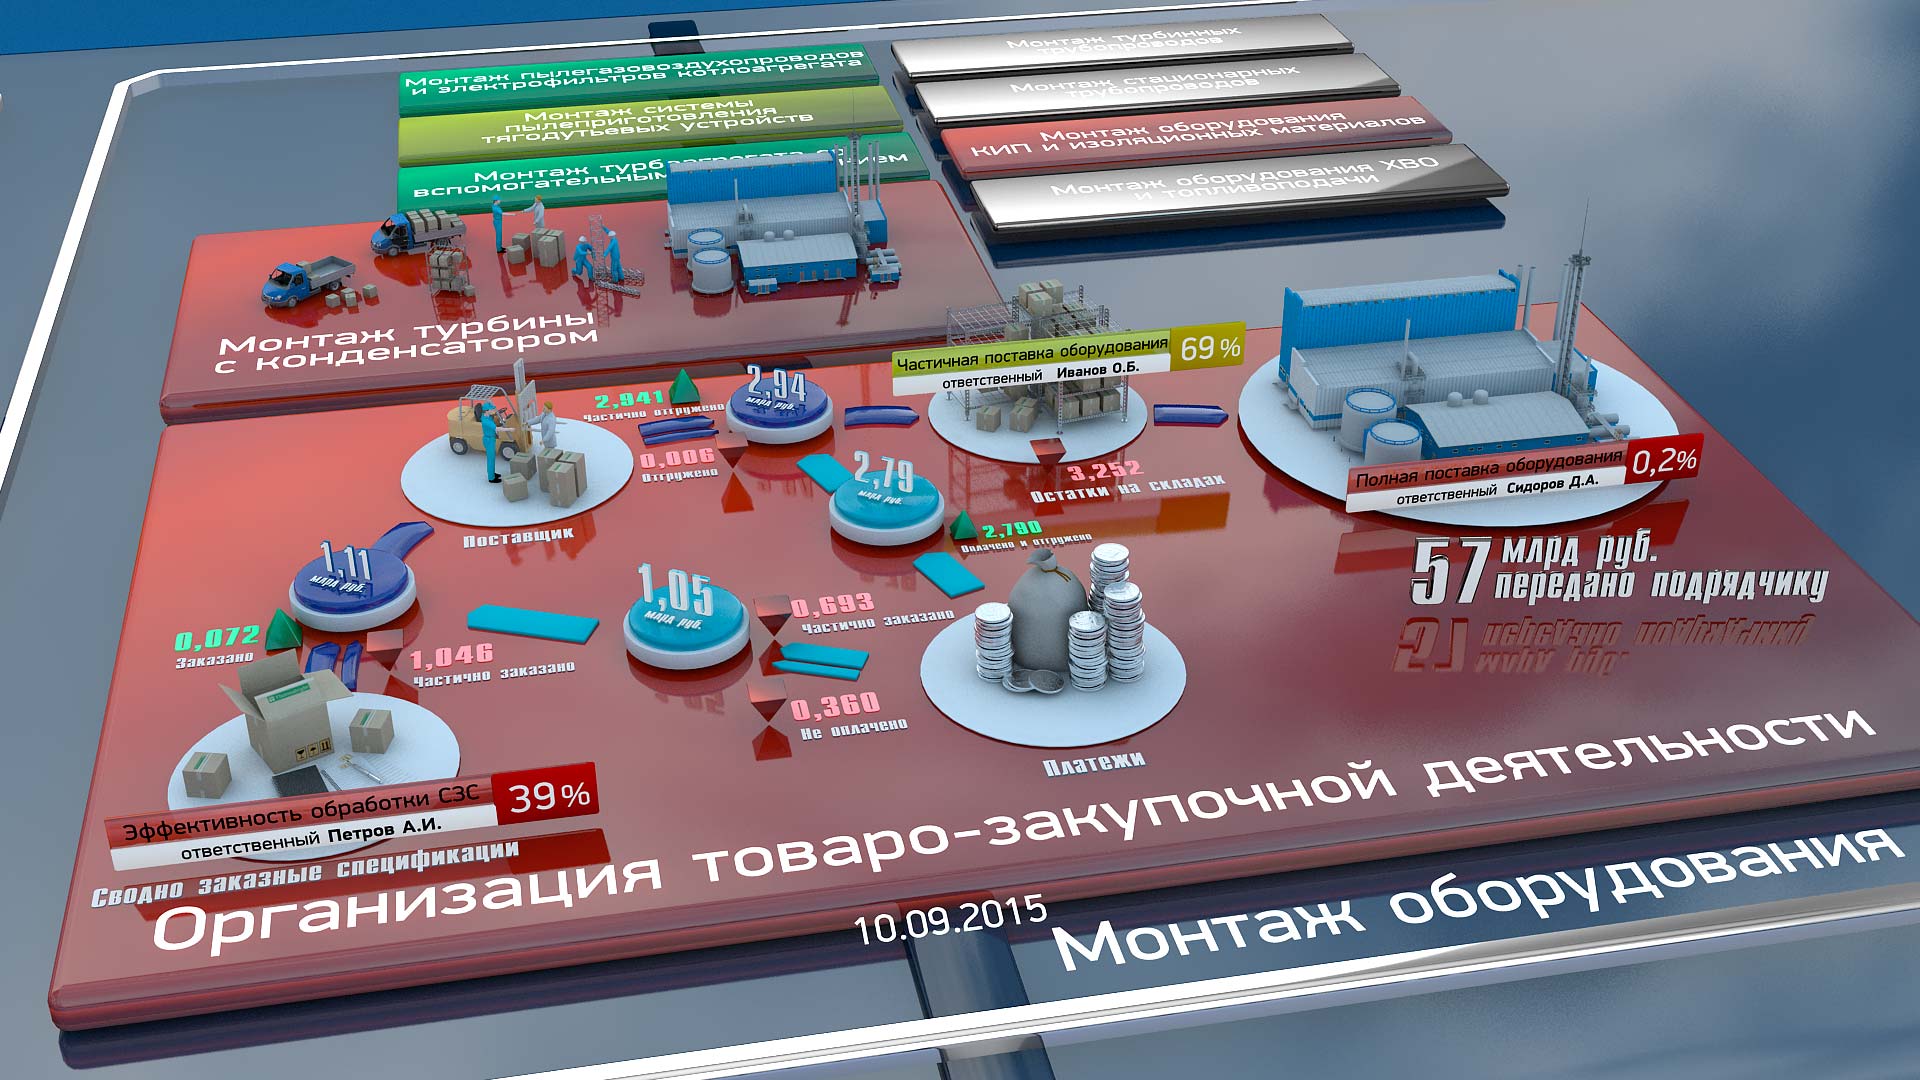
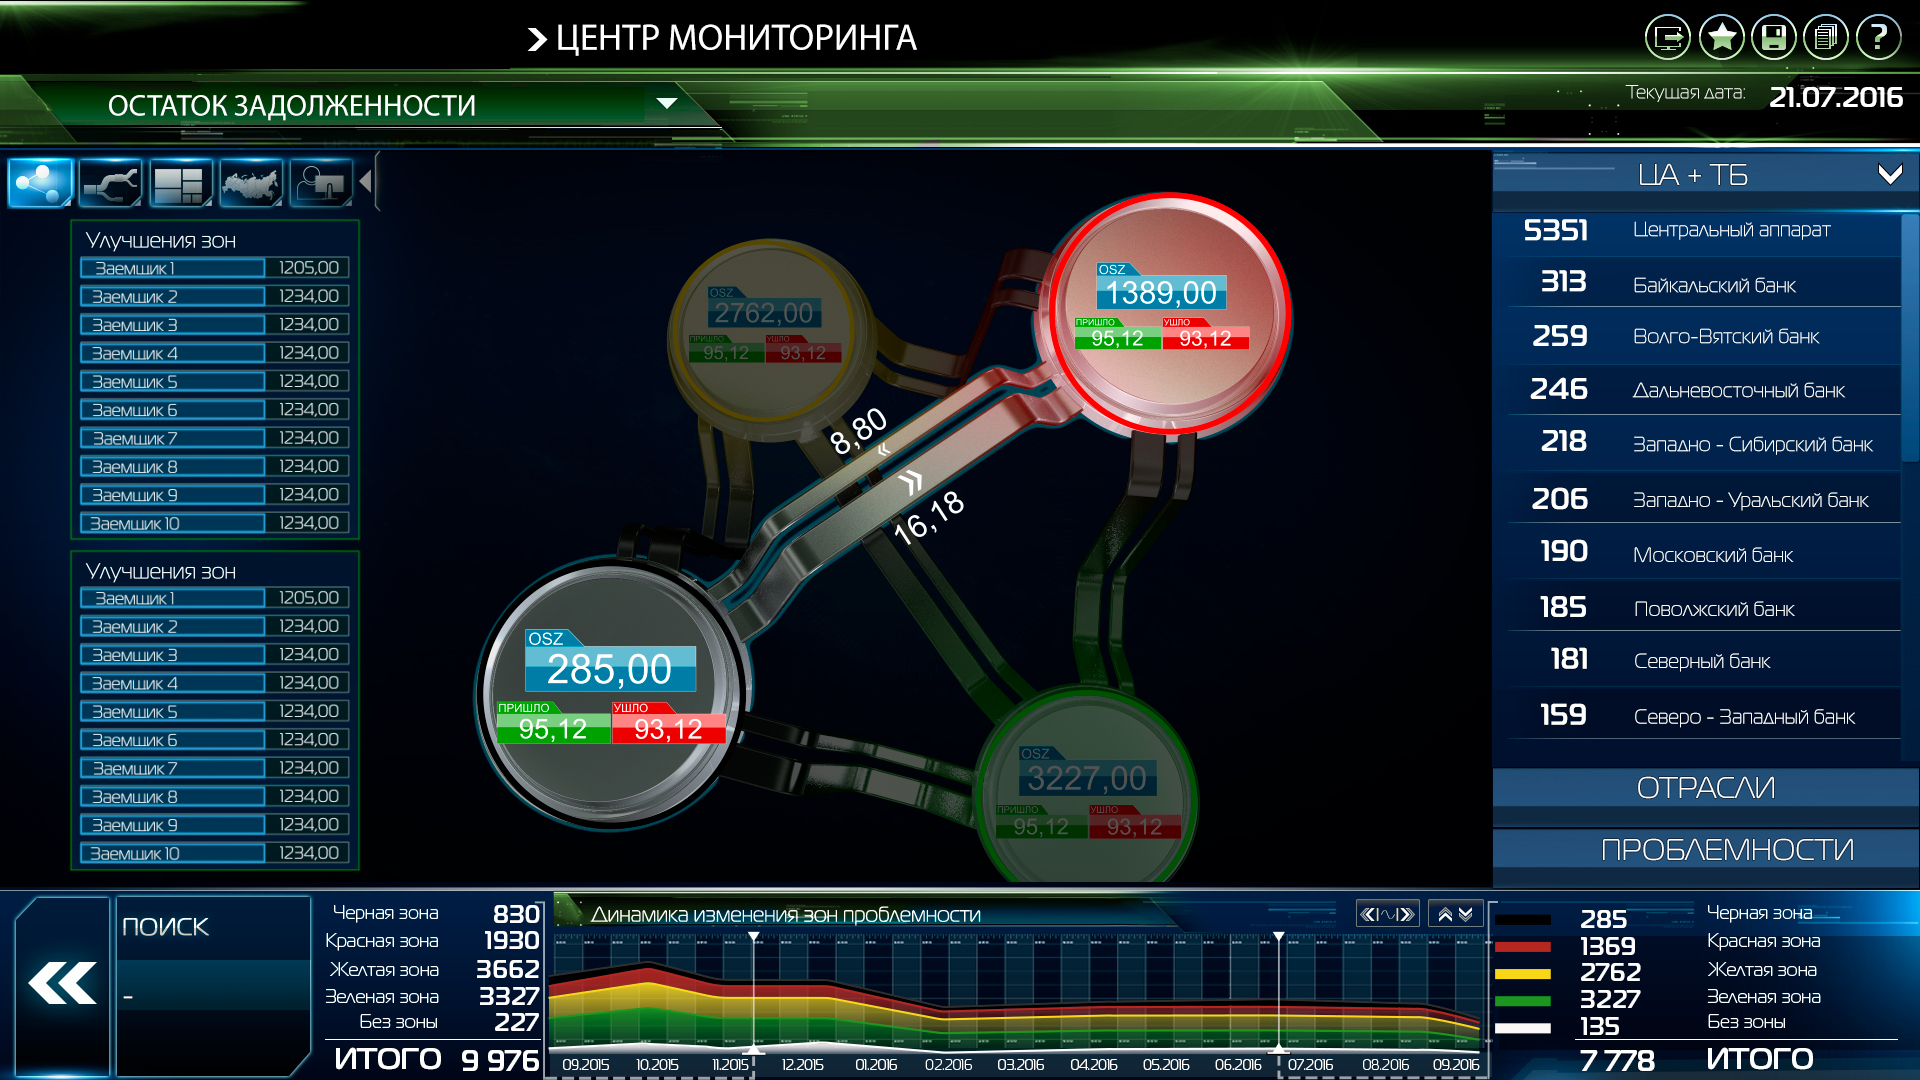
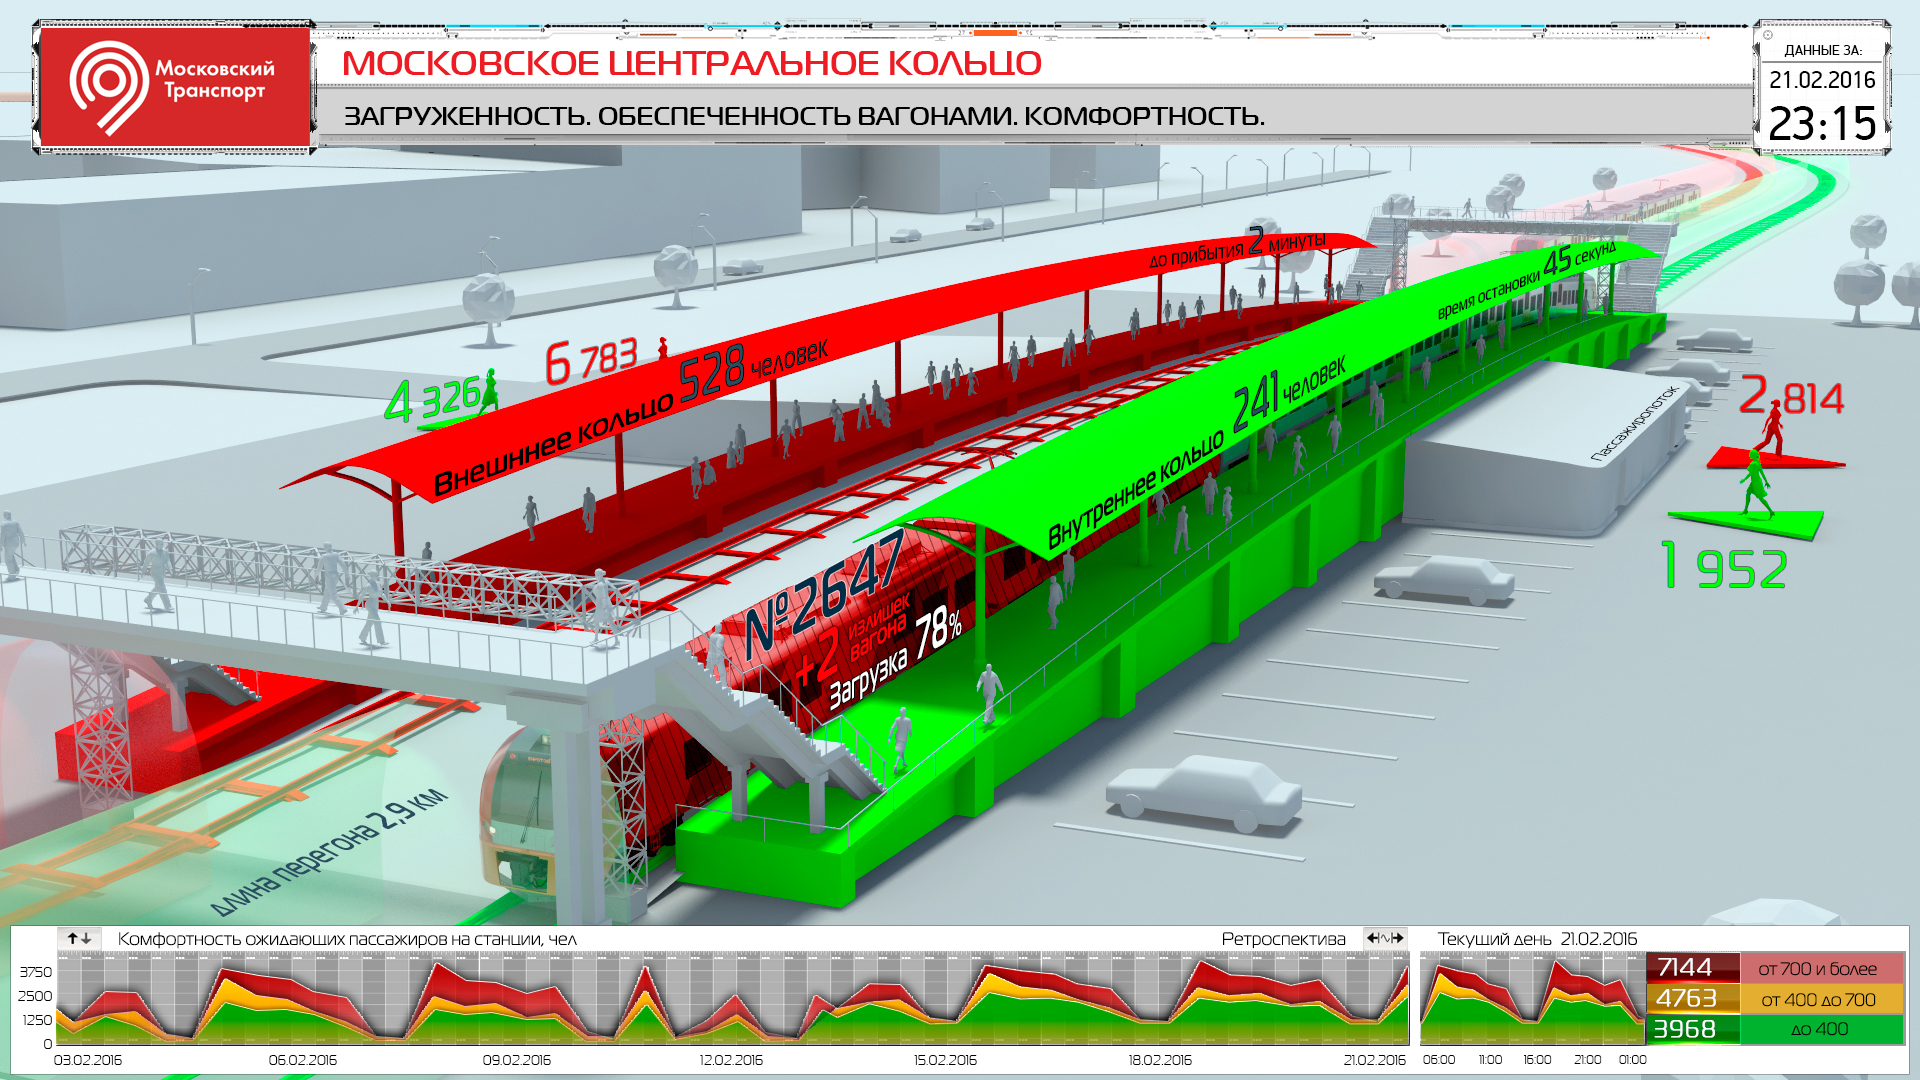
It should be noted that we are creating not “ordinary” BI reports, but three-dimensional applications. In these applications, the visualization of analytical information is performed in the form of 3D objects, combined into thematic interactive scenes (screen forms), interconnected by logical transitions. It is rather difficult to describe them in text, so I’m offering you examples of screen forms for a number of applications of different industry lines.
As we develop three-dimensional applications, not only analysts participate in the meetings, but also infographic specialists, usability experts and 3D designers. They offer screen layouts, 3D images for visualizing customer data, easy navigation between screens, and so on. There are several such brain storms, depending on the complexity of the future application.
According to the results of each meeting, the project analyst fixes all the requirements for the future application in the “Application Description” document. Its structure is presented in the next section. I want to draw your attention to the fact that all the results of the analysis must be carefully documented, it is very important.
Formation of the final document "Description of the application"
So what does the Application Description document include? Its structure is quite simple:
- Setting the task and getting started;
- Inspection of the customer and work with open sources;
- Analysis, formation of requirements and documentation;
- Formation of the final document "Description of the application."
In the section “Description of the domain,” we record information about the business, which is crucial for the formation of requirements for future applications. This section is necessarily agreed with the customer in order to prevent semantic errors. Because, when they appear, the conclusions from this description will be erroneous and the application will eventually need to be redone.
For example, as a result of meetings with the customer, we recorded several indicators that are important for monitoring loans. After coordinating this section with other customer departments, it became clear that some of these indicators are not important for controlling the loan portfolio, while several important indicators were missed.
The “Goals and Objectives” section contains ideas that we formulated on brain storms with colleagues and meetings with the customer.
Finally, the most voluminous section of the document is “Solution Description”. It covers the following points:
- The list of analyzed indicators;
- Data sources (information systems), from which we will extract these indicators;
- The structure of the application screens;
- Sketch and text description of each screen of the application;
- The main scenarios of user experience with the application.
There is nothing to write about indicators and data sources, with them everything is clear. The description of the screen structure is also relatively simple to do, it includes a list of application screens and possible transitions between them.
A little dwell on the sketches. During the formation of the final document "Description of the application" sketches are made by our 3D-designers in graphic editors and 3D modeling tools. The sketches will then create the screens of the future application, and they will not be “about the same”, but absolutely identical to the sketches drawn, without any differences. The detailed and traced sketches are necessary in the document so that the customer can see the future application at the initial stage of the project, at least in the form of screens, and make comments. Edits can be both semantic (for example, the wrong indicator is displayed) and in the part of visualization (a different color palette is needed, other elements of infographics, indicators should be moved to another part of the screen, etc.).
When developing scenarios of user experience with the application, we form from one to 5 main scenarios. Scenarios we choose only those that lead the user step by step to achieving goals and solving specific tasks of the application. If using the script we made sure that all the goals were achieved and all the tasks were solved, then the application was designed correctly.
The final document "Description of the solution" goes through several iterations of coordination with the customer and its final version is attached to the contract for the execution of works. Under this agreed document, work continues on the project, namely:
- Formation of statement on the visual part of the application;
- Formation of statement on loading and processing of application data;
- Development of 3D components;
- Imposition of the application;
- Testing and acceptance of the application.
But these works are the subject of other articles. This article is devoted only to the process of business analysis in our projects.
Instead of conclusion
In conclusion, I want to mention a few principles that should be followed when developing applications.
There are only three of them:
- A visual representation of the picture of the customer's business. Already at the first acquaintance with the application on the screen, the user should see all parts of his business he is interested in, at the very first contact understand which zones are problem and which function without deviations. The information presented should be intuitive to the manager, for whom time is a scarce resource. He does not have the opportunity to undergo long-term training: the interpretation of numbers, visual objects on the screen, etc. With the help of interactive visualization, we achieve an intuitive presentation of data in different perspectives. At the same time, we are working with the application through a touch screen, which provides greater comfort, ergonomics and, most importantly, user involvement in the analysis process.
- Disclosure of the causes of the problem. Having selected the problem point, the user should be able to use the drill down function, which allows you to fall deeper into the problem area, on the following screen forms to see the causes of deviations. In addition, the application should offer the user possible options for localizing problems.
- Technical aesthetics. The application should cause a wow effect i. should be attractive, intuitive and convenient. These aspects, in our opinion, should take an equal position along with the functional components.
The listed principles are simple enough, but observing them, we manage to create interesting solutions that benefit our customers.
Perhaps I will add a few more pictures, so that you understand how such applications may look and in which industries to apply.
Thank you for reading to the end. Surely you had questions when reading. Ready to answer them in the comments. Write!
Source: https://habr.com/ru/post/344654/
All Articles