The ill traveler and the yellow October
Chief Commander Aristarchus glanced at the Prophet , twisting with a truncheon from a snow trolley - a seasonal running commodity - an 11% deviation of the sales forecast for 10 days on average (MAPE) impressed and, as we say in the chat , went into the role of the baseline. If he is as good as their Zuckerberg, then immediately in the prod - that was the first impulse. The prophet was looking at the chief commander, screwing up his right eye. He is so serious, in a suit, and he believes that innovation will be met with applause and immediately accepted - the thought turned in his head, gradually taking shape. And you know, young man, how many colleagues and counterparties with their innovations will you become? They dislike you immediately, do not go to the fortuneteller! In general, the rush lived by the usual cycle of innovation.

In the project management discipline, stakeholders call everyone who is affected by the project (as well as those who can influence it). People are different, with their own interests, expectations, and aspirations. Close your eyes in the hope that the project will not be noticed - very recklessly (remember the uninvited sorceress). The Boston Consulting Group estimates the proportion of IT projects that have died for non-technical reasons at 75%. The last two editions of the project management knowledge book (PMBOK) highlight the processes for managing stakeholders into a separate area of knowledge under happy number 13 and strongly recommend to take into account the connections between them, centers of influence, as well as the communication culture to increase the chances of success.
We will show how to evaluate stakeholders using machine learning. Let us single out groups of similar people and solve the clustering problem — customer segmentation in terms of marketing — in social structures that we build from: 1) message flows and 2) emotional coloring of the text. To do this, look into the correspondence, kindly provided by Ms. Clinton, in the manner proposed in the journal Bioinformatics.
Here is our plan:
- Setting bad luck
- The nature of the business and the first reaction (ignorance)
- The nature of the business and the second reaction (resistance)
- The nature of the business and the third reaction (compound)
- The nature of the business and the fourth reaction (fermentation)
- The nature of business and the fifth reaction (vacillation)
- Connected not by one network
- Data quality and wealth
- Memo to the replicator
- Debriefing
Setting bad luck
The chief commander Aristarchus will have to introduce modern information technologies in the organization, of which he directly supervises. Changes to existing processes are an inevitable consequence of the digital transformation into which he has become involved. A long time ago, in a distant galaxy, new products were welcome, in honor of innovators, every time they organized parties to the next rationalization offer, it was fun for everyone, and the changes came to a bang.
On Earth, everything is different. Innovations are not welcome here. And most often resist. Osprey
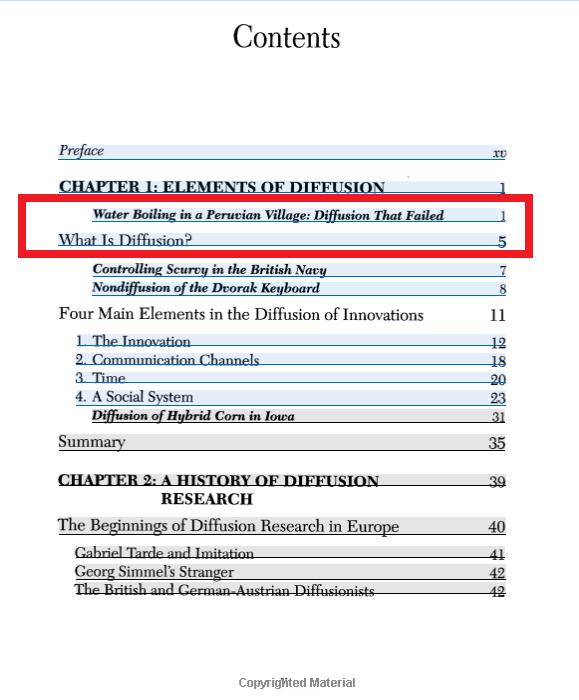
The modern view on change management is based on the work of Everett Rogers, his book "Diffusion of Innovations" (citing the title of content from google books - an art object itself) has gone through five editions since 1962.
Observing the process of adopting innovations in agriculture - for years farmers have been slow in moving to modern farming methods and their behavior, strange from an economic point of view, has puzzled and even annoyed the researcher. Rogers began to study the introduction of innovations in the real world in the mid-twentieth century, and before that he served in Korea in aviation, where he studied practical issues of sociology. It all started with hybrid corn - the spread of new seeds in two populations of farmers from Iowa became the starting point for conditional division of society into innovators, early users, early majority, late majority, and brakes, as well as the emergence of the role of the agent of change - the most important possible roles stakeholder (interested party).

The model of the distribution of changes in the social network has hardly changed, and we will show how to apply classical and modern methods in practice to analyze stakeholders.
Due to the fact that all stakeholders are different people, in different positions, and with different habits, the scale of the changes will vary for individuals. Five years ago, at some kind of change management training, I was struck by an amusing formula that sets the conditions for success:
A + B + C> D,
Where:
A - dissatisfaction with the current state of affairs;
B - general vision of the problem;
C is a safe action;
D - the effort required to move to a new state of affairs.
When this inequality is fulfilled for each stakeholder separately, change spreads quickly and steadily. Otherwise - wait for resistance.
The recipe for success is simple: convince everyone.
Yes, that's bad luck, Aristarkh - one, and stakeholders - a lot. Separately convince everyone individually, but gathering them all together is of little use, the approach to directors differs from that to warehouse workers. With the gift of persuasion from the chief commanders, everything is in order due to official duties, they will find an approach to everyone, but time is running out, sales need to be moved. Therefore, we will divide the population into groups whose members are as close to each other as possible. Each group Aristarkh will prepare his message, reducing the overall effort to reach the heart of everyone.
We limit the salesman's bad luck with the question: "How to segment the stakeholders?"
Ignorance is power
Not all seemingly obvious things are common and common everywhere.
At first, no one is informed. This is important to remember, because every stakeholder has an emotional journey ahead. Involvement, or willingness to cooperate, varies over time.

Here is the model (borrowed from SAP ), which in general describes the involvement (we need the qualitative result of all experiences) of an individual taken by your project. Initially, they do not know anything about you and calmly do their work, enjoying the current state of affairs. Then you appear, along with innovations, whether it is corn, or new kind of machine learning, the only reaction is irritation. 98% of the population dislike you immediately. For a short time, as it happens - they held a meeting for themselves, they spent time, and they forgot. Lunch was delicious, and annoyance vanished. An innovator with his innovations is about the same as before the meeting.
The next is better.
The inevitability of change becomes apparent and sadness increases. A sad stakeholder gradually loses interest in what is happening (some - frantically trying to get out, but it does not help) and slips into a state that in SAP implementation projects is called the "valley of tears" - panic, disbelief, torpor, emotional breakdowns - this is a short list of symptoms that I have seen in person.
All will be there.
Finally, the benefits of the project come to the individual, cooperation begins. Involvement is growing. Hurray, the productive stage of interaction begins! You can build a positive attitude of stakeholders to the project in four ways: 1) by establishing an effective communication structure for project information; 2) encouraging the desired behavior; 3) managing the organizational structure; and 4) people's skills. I am not aware of examples of manufacturers of information systems that pay any attention to organizational changes comparable with that of SAP .
We examined the dynamics of the emotions of individuals. With organization - more fun.
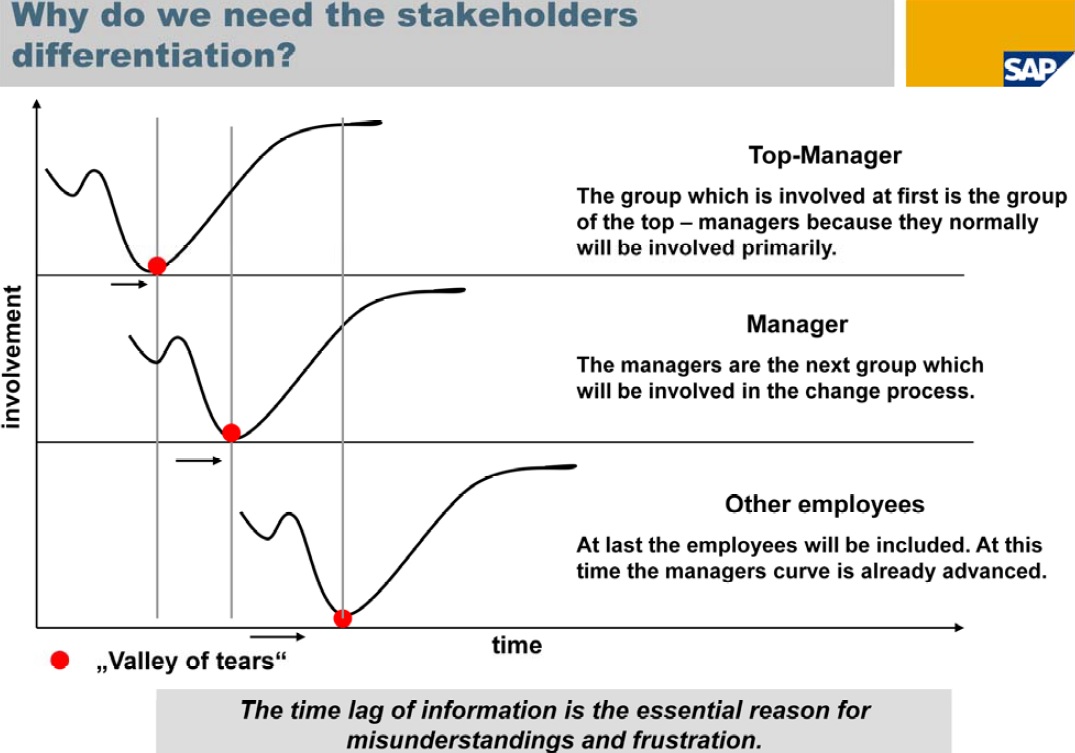
A situation when a top manager enthusiastically engaged in a project happily stomps into the canteen and faces a gloomy middle manager, just the day before yesterday, imbued with shades of a bright future, leading sullen employees at the bottom of enthusiasm - a natural result of neglecting the laws of nature and saving making organizational changes.
Spyware Gift
In 2008, the CIA published a 32-page brochure of 1944. Translated into many languages, the document spread from Greece to Norway. How to paralyze the work of the regime to minimize the effectiveness of everything? Tips are relevant today, and in the process of innovation, many practices are manifested in modern organizations. Bestseller what to say.

The proliferation of innovations and obstacles arising in their way has interested researchers for quite some time. In the social sciences, it is customary to reflect on why people act in a certain way and there is even a separate line of research based on traditional statistics and sociological research. In my opinion, this area of activity is looking for answers to the question "How do people rationalize their choice?". At times, questions posed by researchers are sensible and can indeed be applied in the real world.
- Homeostasis: a change for nature is an unnatural state.
- Burden of proof: presumption in favor of maintaining the status quo: proponents of change should prove their case.
- Inertia: it takes considerable energy to change course.
- Satisfaction: many people like the status quo.
- Immaturity: the prerequisites for change are not yet ripe, the time has not come.
- Fear: people fear the unknown.
- Own interests: change may be good for others, but not for us.
- Lack of self-confidence: we are not ready for new challenges.
- The shock of the future: too much change, and we begin to resist them.
- Vainness: changes appear to us superficial, cosmetic, illusory. Why bother?
- Lack of knowledge: we do not know how and what to change.
- Human nature: people are prone to competition, aggressive, envious, selfish, not prone to altruism.
- Cynicism: we suspect that the initiator of change has its own interests.
- Viciousness: change is attractive, but we fear that the unintended consequences of change will be dangerous.
- The genius individual is against group mediocrity: those of us who are not distinguished by the highest intellect cannot appreciate the wisdom of change.
- Ambitions: influential people do not want to admit that they were wrong.
- Immediate orientation: people want results immediately.
- Myopia: we are not able to see that in the long term, changes are beneficial for us.
- Sleepwalking: most of us don't understand which way to go.
- “Snow blindness”: group thinking, conformism.
- Collective fantasies: we often ignore real experience and are captured by preconceived opinions.
- Intra-group chauvinism: we are right, but those who want change are mistaken.
- The fallacy of exclusivity: change may work for others, but we differ from them.
- Ideology: we have a different worldview and values.
- Institutionalism: individuals can change, but groups can not.
- Natura no facit saltum - Nature does not like jumps.
- The virtue of the strong: who are we to challenge the decisions of the leaders who have chosen the current course.
- Change has no support: the minority defends the status quo more decisively than the majority protects the status quo.
- Determinism: Successful changes in the plan are impossible - everything goes naturally.
- Science: history lessons are a science that is not related to practice.
- Habit.
- Custom despotism: the ideas of agents of change are perceived as a reproach to society.
- Mindlessness
(O'Tool, J. (1996). Leading change: The argument for values-based leadership)
And still against change make friends
All those whose interests will affect the project optimization, against him make friends.

The consolidation of the collective in the face of external threat is a characteristic feature of the human race. History knows many examples of starting a witch hunt in difficult times. The main thing you need to know is that 1) existing social ties will affect how exactly the stakeholders will make friends and 2) bad luck can be described and measured by means of graph theory.
Time classics
Graph theory is a section of discrete mathematics that studies properties of graphs. In a general sense, a graph is represented as a set of vertices (nodes) connected by edges. In a strict definition, a graph is such a pair of sets G = (V, E), where V is a subset of any countable set, and E is a subset of V x V. Edges can be oriented (sending a message) and undirected (participating in a committee), have weight (number of messages), or sign (friendship / feud). Both nodes and edges can have additional properties that are limited only by imagination and the size of RAM.
In our current bad luck, the nodes will be the very stakeholders that need to be made happy, and the edges will be the connections between them.
Lyrical digression about project managers
Funny fact: project managers regularly use elements of graph theory, but most of them do not know about it. For example, network diagrams are one of the ways to display a project plan, where the nodes are tasks, and the edges are relationships between work, of which there are four types:
Finish-Start - the next task starts after the completion of the previous one;
Start Start - the next task starts simultaneously with the previous one;
Start-Finish - the next task can be completed only after the start of the previous one;
Finish-Finish - the next task can be completed only after the previous one is completed;
The practical benefits of presenting a project plan in the form of a graph are expressed in the implementation of the critical path method and finding a task sequence, delays in which will lead to the inevitable shift of the project’s final date the time margin on the critical path is not intended by definition. The problem is solved, for example, by the Dijkstra algorithm.
The study of social networks has been used for a long time to describe relationships between people, and so far, the resulting graphs have been analyzed separately.
For example, an excellent in all respects study of altruism among the "witches" in Chinese villages in comparison with simple peasants, showed that there is no difference, it operates with four bond graphs corresponding to different types of interaction:
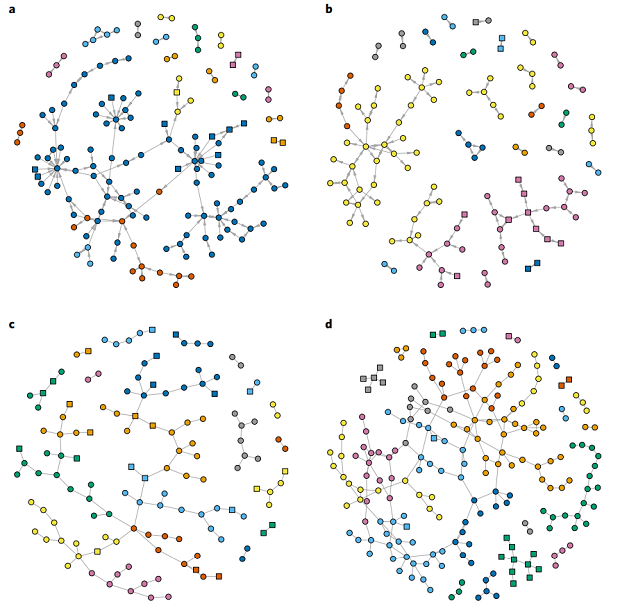
The relationship between "witches" (squares) and ordinary peasants (circles) in one of the settlements: a) assistance in agricultural work, b) gifts, c) sexual relations, d) biological relationship.
As it can be seen from the figure, relationships between people are formed non-uniformly - some are helped more, some are bullied, and some are more popular with the opposite sex than others.
Not all stakeholders are equally useful.
The traditional classification approach recommended by the PMBOK consists in ranking by several parameters: strength, project influence, interest — all these measurements are quite subjective and the question: “Who will fence whom: the chief account manager, or is it all stronger?” I personally ask myself a few years in a row.
Analysis of social networks (those same graphs of connections) allows us to assess the role and importance of individuals. For this purpose, centrality metrics are used, evaluating the nodes of the graph quantitatively.

An example of the distribution of centrality metrics for a single graph: A) Betweenness, B) Closeness, C) Eigenvector, D) Degree centrality.
Degree centrality is the number of connections for each node, for the directed graph, inbound and outgoing connections are allocated, respectively, in-degree / out-degree. The metric allows you to assess how “sociable” a single stakeholder is.
Closeness centrality - estimates the average distance from each node to all the others; here the measure of the distance is the minimum number of edges that you can walk between two nodes (the shortest path on the graph). The metric allows you to assess how quickly the message will be distributed from a single stakeholder.
Betweenness centrality - estimates the number of shortest paths passing through a node. The metric allows you to determine through whom information flows pass, for example, and to identify which of the stakeholders are “negotiated” by the departments.
Eigenvector centrality - assesses how the node is connected with the most connected nodes of the graph. The metric allows you to identify the most influential stakeholders.
Page Rank - estimates the probability of finding a random tramp walking along the edges between the nodes. The metric is one of the most important in the Google search results ranking algorithm.
These metrics are built into most of the packages for working with graphs (SAP BO, SNAP, Gephi, Pajek, NodeXL, and others), and the algorithms for calculating them are quite cheap in terms of computational load. You can keep all the connections in your mind, as I did when I was a project manager (the head swells and hurts from this), but you can take it and count it.
The practical benefit of assessing the centrality of the stakeholders is that the most popular nodes on the network are always visible, and as soon as you manage to agree with them about broadcasting the message you need (it can be a change of behavior), other participants will have the illusion that practice already uses the majority. There will be a network effect.
The most important thing to remember is Free Lunch Theorem (no optimization algorithm is universal), so in practice it is common to use several metrics simultaneously.
Divide and rule
Returning to the segmentation question, we divide it into two sub-questions: "How to divide the stakeholders into groups?" and "How to influence groups?" - The first is important because it’s ineffective to communicate with the whole mass, the second is aimed at increasing the chances of delivering a message (and making the necessary changes) by using the right people at the right place at the right time.
The division of the graph into clusters, or the task of finding the optimal cross section, is based on the assumption that there are groups in the social network that are more tightly connected inside - each node in the cluster has most of the connections inside. The task is not new and there are quite a few algorithms for its solution, one is more beautiful than the other.
The easiest way to assess the quality of separation is modularity — a measure of comparing the number of edges in the resulting clusters with a random graph (Erdos – Rainey model: the nodes are interconnected randomly, so that the average degree of the node — the number of links — remains unchanged).

An example of successful division of a graph into clusters, maximizing modularity.
In the resulting sections, we can single out the central nodes with one or several methods outlined earlier - so we get a list of candidates for the role of agent of change, or we can go a little further and try to analyze the nature of the connections of candidates and predict their chances of success.
One of the first large-scale studies (Battilana, Julie, and Tiziana Casciaro. "Overcoming Resistance to Organizational Change: Strong Ties and Affective Cooptation." Management Science 59, no. 4 (April 2013): 819–836.), Summarizing 68 large-scale cases changes in English hospitals, highlights several rules of success for agents of change:
- strong connections with neutrally-minded stakeholders increase the chances of success - it is easier to agree and convince when relationships are established;
- strong ties with hostile stakeholders (and you thought, will everyone be happy with innovations?) only help in case of minor changes;
- Strong connections with hostile stakeholders in the event of large-scale changes turn into commitments (inconvenient to colleagues) and reduce the likelihood of success;
- the structure of an individual network has a direct impact: the chances of success are higher for change agents with branched links, and vice versa, if the agent’s influence contacts are interconnected, then it is likely that they will be friends against innovations.

Green and blue have more chances than red and gray.
So far, we have considered methods and heuristics that allow conclusions to be drawn based on the structure of relations between stakeholders. The usual approach to solving such problems as: 1) link prediction in the future (Link Prediction Problem), 2) determining the role and popularity of a stakeholder, or 3) segmentation, was to create attributes for nodes and edges manually and then use the classical machine learning algorithm .
Times change, computational mathematics evolves. State of the art in the field of automatic creation of features from graphs is the work of node2vec, on the basis of which the study, which we will reproduce today, is built. Meet
Marinka Zhitnik method
The theory of graphs this year marks 300 years without 18, and so far, individual graphs have been the subject of analysis. Our world is somewhat more complicated and the connections between nodes can be of a different kind, and nodes also can be of different types. I have to analyze organizations by type of activity and, in this case, I cannot get by with just one kind of connections.
The question: “How to model a real organizational structure?”, Asked by the teacher in the first year of my second magistracy far back in 2014, found the answer only in the summer of 2017, a week before the diploma.
An article in the journal Bioinformatics (Predicting multicellular function through multi-layer tissue networks. Marinka Zitnik and Jure Leskovec. Bioinformatics, 33, 14: i190-i198, 2017) offers a new approach to modeling complex systems. The idea is to present the relationships between entities (in the original work, these are interactions between proteins in different parts of the brain), as well as a hierarchy of relationships (brain structure), and project them into multidimensional space so that the related entities are placed compactly.
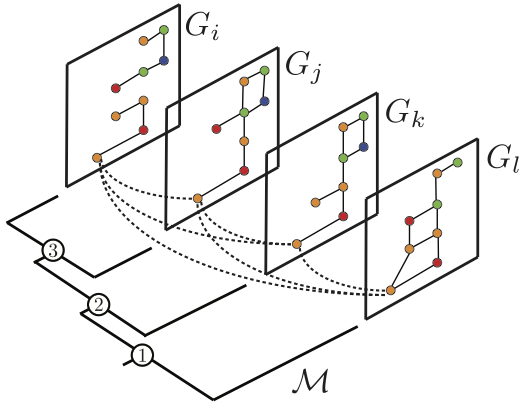
The mechanics of the method (and inside - all the same random vagabond) perfectly tells Yura Leskovek in the penultimate lecture of the CS224W course of the 2017 sample.
More important for us is that graph theory is a universal level of abstraction, operating on entities and their connections. This property allows you to apply the algorithm from the field of bioinformatics to project management, it is enough just to describe all those networks of relations between stakeholders.
And where is the data to take?
There are several approaches to describing social structures, and the first is sociological research. Graphs describing cooperation, trust, respect, can be constructed by asking questions, such as:
- Which colleagues do you most often interact with at work?
- Who do you ask for advice?
- Whose opinion should be considered when making decisions?
- Who will surely do the job on time?
- Who inspires accomplishments?
Not all links are equally useful, and existing conflicts can be identified and mapped organizations by asking:
- And who is hard to work with?
- From communication with someone you want to give up?
Negative connections, in general, occur much less frequently, but their effect is very destructive.
You can ask questions, and you can do without it and get relationships from a pile of data that is created in any organization every hour. For example, information flows that describe the most familiar way of communication between people can be obtained from:
- Correspondence - electronic messaging networks have been a subject of research for a long time; the data source can be e-mail or messaging tools.
- Detailing phone calls.
- Access logs - it is known that the most important things are discussed in the smoking room.
:
- ( ).
- ERP- — .
-
, , .
And there is.
, -, , .
.
— — ERP-. , , — . — , , .
, !
. , . – .
, - .
, , , .
!
- , : " , , , . — . , . , ROI ."
- Python 3.5, a SNAP — c 2.7, SAP Cloud Platform
: , /dev/null
( , )
')
Source: https://habr.com/ru/post/344598/
All Articles