IQ correlation with our life (Feature ranking)
Prologue
Sometimes each of us has a question that bothers us. And as a rule, the answer to such a question can be obtained only by analyzing the experience of a large number of people. I have a question: “What factors influence IQ and is it just a little advantage?”. Of course, the reader may exclaim that everyone has long known everything and can read articles on this topic. To some extent you will be right, but alas, articles on IQ turned out to be extremely controversial and forced on me even more questions. That's why I decided to conduct my modest research on this topic.

Cambridge study in delinquent development
In 1962, in England, a large-scale and long-term study (20 years) began on what factors influence antisocial behavior. About 500 10-year-old boys were selected as respondents, 890 parameters are attached to each respondent, which describe his youth, maturity, the life of his family and his environment. Among these parameters was the level of IQ, which led me to the idea of studying the dependencies between it and other variables.

')
Import libraries and load data:
import pandas as pd import matplotlib.pyplot as plt from sklearn import preprocessing import matplotlib.pyplot as plt import seaborn as sns import numpy as np from sklearn import preprocessing import warnings warnings.filterwarnings('ignore') import random as rn from sklearn.cross_validation import train_test_split from sklearn.naive_bayes import GaussianNB from sklearn.ensemble import RandomForestRegressor from sklearn.neighbors import KNeighborsClassifier from sklearn.linear_model import LogisticRegression from sklearn import svm data = pd.read_stata('/Users/####/Downloads/ICPSR_08488/DS0001/08488-0001-Data.dta') Data processing
IQ was chosen as the target variable, and it needed a small adjustment:
data['V288'].replace('IQ75',75,inplace=True ) data['V288'].replace('IQ129',129,inplace=True) data['V288'].replace('IQ128',128,inplace=True) Selection of required signs
# , ranks = {} # def ranking(ranks, names, order=1): minmax = MinMaxScaler() ranks = minmax.fit_transform(order*np.array([ranks]).T).T[0] ranks = map(lambda x: round(x,2), ranks) return dict(zip(names, ranks)) # (Y) Y = data['V288'].values # Y IQ = data.drop(['V288'], axis=1) X = data.as_matrix() # colnames = IQ.columns %matplotlib inline from sklearn.feature_selection import RFE, f_regression from sklearn.linear_model import (LinearRegression, Ridge, Lasso, RandomizedLasso) from sklearn.preprocessing import MinMaxScaler from sklearn.ensemble import RandomForestRegressor # rlasso = RandomizedLasso(alpha=0.04) Y = data['V288'].values rlasso.fit(X, Y) ranks["rlasso/Stability"] = ranking(np.abs(rlasso.scores_), colnames) print('finished') In order not to load the article with the code, I gave a fragment of only one test for assessing the signs.
We display all the importance values in our dictionary.
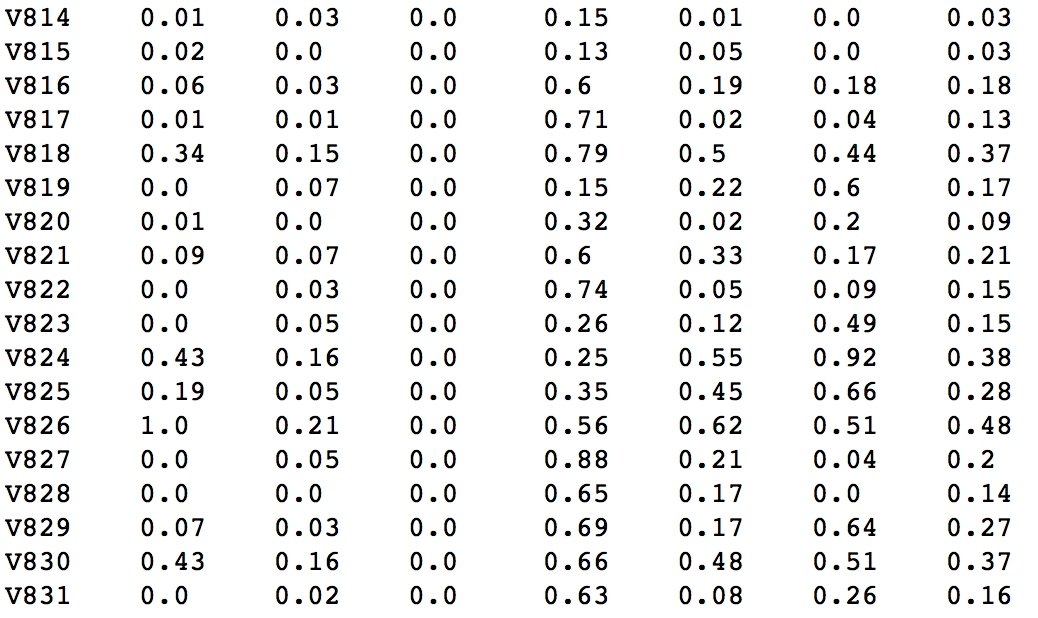
r = {} for name in colnames: r[name] = round(np.mean([ranks[method][name] for method in ranks.keys()]), 2) methods = sorted(ranks.keys()) ranks["Mean"] = r methods.append("Mean") print("\t%s" % "\t".join(methods)) for name in colnames: print("%s\t%s" % (name, "\t".join(map(str, [ranks[method][name] for method in methods])))) The matrix of results is as follows, and the last column displays the average importance value based on all tests:
Let's select the top 100 variables by average:
sorted(r, key=r.get, reverse=True)[:100] Description of the most significant signs of signs
Also, just in case, I rechecked these variables using the Pearson criterion.
1. Average IQ and state of life:
p_value 0.035
Normal: 98.171533
Awful: 103.934307
2. Average IQ and behavior:
p_value 0.005
Rowdy: 102.395833
Adequate: 98.286385
3. Middle IQ and Lies
p_value 0.004
Rarely lies: 94.357895
Periodically lying: 99.627907
Often lies: 101.702381
Always lying: 102.204545
4. Middle IQ and social support:
Implied subsidies and benefits.
p_value 0.004
Not supported by the state: 98.310976
Supported: 107.132530
5. Middle IQ and appearance:
p_value 0.011
Preppy: 96.295597
Average: 102.608696
Untidy: 100.526316
6.Medium IQ and concentration
p_value 0.007
Good concentration: 98.732218
Poor concentration: 105.186207
7. Middle IQ and developmental problems in infancy.
p_value 0.012
Normal: 99.294304
Development Delay: 104.562500
In the end, it was interesting to see the dependence of what kind of IQ the child had at school and how much he earns at the age of 30 (the average weekly income is taken)
IQ and salary:
111 and above: 17.500000
101-110: 16.906250
91-100: 17.364486
90 and below: 17.558140
Conclusion
There are factors that are really able to influence our IQ, but on the other hand, the IQ in the case of our sample could not affect the level of earnings.
Source: https://habr.com/ru/post/344560/
All Articles