30-hour hakaton Yandex. Weather, or how to predict precipitation on signals from users
Recently, we conducted a hackathon on the use of signals from users in weather prediction. Today I will tell you why arranging such a competition is almost a more difficult task than successfully performing it, what participants the participants managed to do in 30 hours and how we use the results of the hackathon.
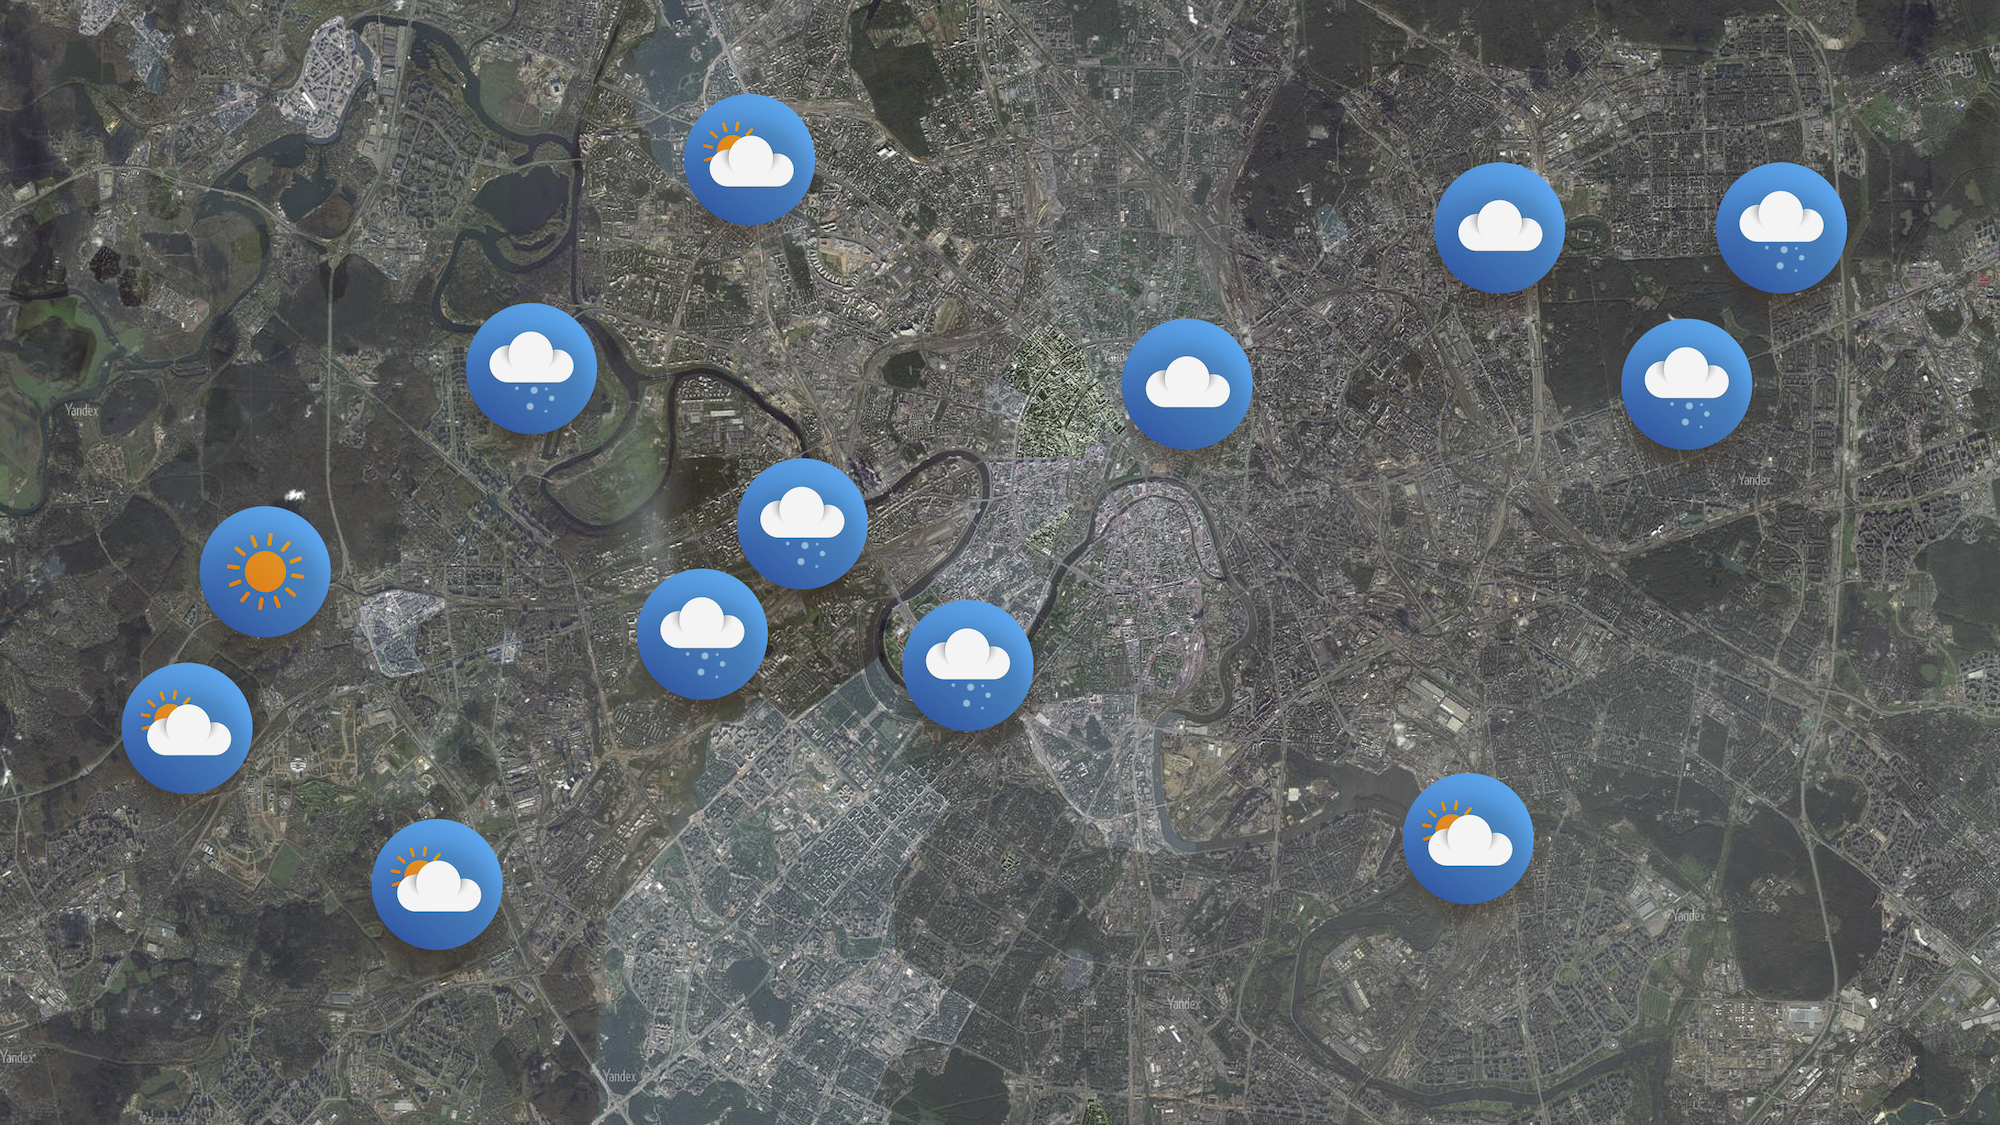
Yandeks.Pogoda today - a large combine for processing indications that are not tied to a specific user. The service builds a forecast accurate to home due to machine learning from data received from large meteorological organizations. Our recent launch of world weather maps is another important step in the development of this system. But there are other data that can positively affect the accuracy of the forecast.
')
Why not use the testimony of home weather stations (of course, anonymized)? Or you can use the pressure sensor readings in smartphones. Or start to take into account in real time the error messages that users send from the application. I gave some of the most obvious examples - add to them a lot of indirect signs of what the weather is around. Take at least the strength of a cellular signal: when the phone does not catch the network well, one of the reasons is sometimes high humidity. A couple of weeks ago, one startup even attracted a round of investment, promoting this idea.
We made the first approach to understanding how data from users are able to help us, in early 2017. For several days we studied the readings of the pressure sensors mentioned, as well as information from the error messages. It became clear that there are too many possible methods and there are pitfalls everywhere. The idea to host a hackathon was a logical decision: we were going to offer participants a non-standard task, and at the same time get to know them and use the results to find out which areas of work are the most promising.
Any data scientist, including from Yandex (not from the Weather team), could participate in the hackathon, but with the condition that solutions from yandexoids would not fall into the overall ranking.
We came up with the concept of the hackathon in the spring, but decided to hold it in the fall: first, to provide the teams with information gathered during the summer months, and second, that all potential participants have time to return from holidays. Since we did not use user signals on a regular basis until then, we had to get them first. We, as always , reached all the suppliers (inside and outside Yandex) - and, as always, we ran into some problems. The pressure sensor readings were unloaded, but not for the entire required time interval. We also decided not to provide messages from users to the teams: the data turned out to be too “dirty”. The unprepared data scientist, as we believed, would not have been able to lay them in the basis of a serious algorithm in 30 hours, but would only spend his time.
As a result, we prepared for the participants two sets of data for July and August of the current year. The first array consisted of testimony from amateur weather stations Netatmo. The manufacturer sells the testimony of each station, the owner of which has given its consent to this, and Yandex simply acted as one of the buyers. The second array is an open base of mobile operators. The database in an impersonal form indicates where the device was located and what was the strength of the signal from a particular cellular tower.
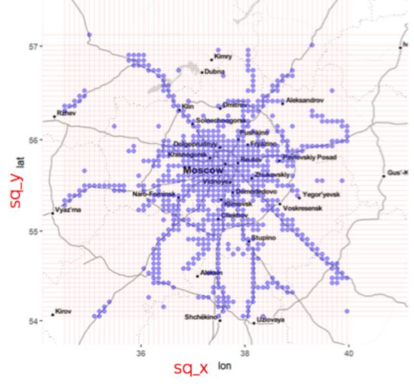
For the competition were used figures collected in Moscow, St. Petersburg and Kazan. In these cities there are radars whose readings have become an excellent target metric of the hackathon.
To simplify the lives of the participants, we have provided them with a basic solution, extracting features from all available data. In particular, we showed how to add values from meteorological stations to data from phones and train the model without spending too much memory. Briefly about the decision itself:
It took us less than a day to write the baseline, but then we realized that we used extra data: the predicted values “accidentally” got into the training sample. I had to urgently arrange a nightly mini-hackathon before the main hackathon - the final version of the basic solution, where we do not break our own rules, was ready in a matter of hours before the competition. In total, two employees of Yandex.Pogoda spent about two full working weeks on data preparation and baseline development.
The data provided to all teams occupied about 30 gigabytes. We did not prohibit supplementing them, but demanded that the training sample contain only data from users - simply because it was in them that the whole meaning of the hackathon lay. In other words, the base of indications of telephone pressure sensors would fit - if someone from the participants could get it. But as has already been said, it’s not for nothing that we limited ourselves to figures from amateur weather stations and from operators. Almost no one managed to find other suitable information on the Internet - and those who succeeded did not benefit from it anyway.
30 gigabytes in a very limited time - not so little. We warned participants that they would either have to use their laptops for machine learning, or rent cloud capacity.
The solution proposed by my colleagues from the YT project was reduced to the generation of good features and learning by the classical method (gradient boosting over decisive trees). The guys used CatBoost - perhaps because of patriotism towards Yandex, but according to them, our library showed “much more” successful results than others.
The best signs were data from amateur weather stations. Based on them, various statistics were considered: average, maximum, minimum, variance, etc. It is worth noting that the readings of the nearest stations were used and a few more - distributed around the target square. This distribution was not truly uniform: in Russia there are not so many Netatmo devices, and those that are always online and with the user's permission broadcast readings to the Internet, even less.
Custom signs, such as the average speed of movement of people in the target square, also played a role, although not very large. A total of about 7 thousand signs turned out - which, of course, could be filtered without losing as a model. But the team had enough resources to train with so many, so optimization was not really required. CatBoost itself was trained practically on default parameters: tuning led to absolutely insignificant changes in quality, and took a lot of time.
Feature set enhancement
Firstly, the search for the nearest meteorological stations in the base solution was, of course, the most naive: the distance was calculated using the Euclidean metric. It is not entirely correct to compare geographic coordinates in this way; therefore, many immediately suggested a correct calculation of the distance on a sphere.
Secondly, as mentioned above, the number of stations is small, and the information from the next few of them does not always give a complete picture. It so happens that all stations are located in the northeast, where it is now raining, and the weather in the west is completely different. One of the teams divided each square into six sectors and set up a search for the nearest weather stations in all sectors separately.
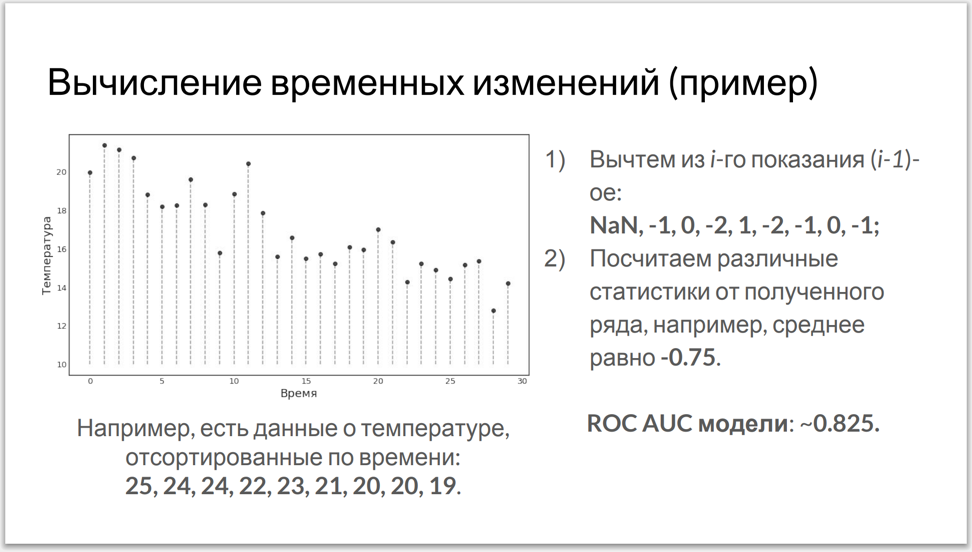
Thirdly, the base model processed data for each next hour, regardless of the values obtained earlier. Members of another team have adjusted the counting of various statistics from time series - which, in turn, were built on the basis of the data we provided.
The base of mobile operators was less useful. Some of the teams added additional features based on the signal strength data, but it turned out that they did not give a significant increase. On the other hand, during the discussion of the results, the first place holders reported that the current average speed of movement of users provided a good contribution to the model. And it's true - in case of rain, people tend to move faster to hide somewhere. And another participant improved the result a bit when he took into account that during the precipitation there are fewer people on the street.
Improving the model itself
After some time, all the teams found that a model trained on the general data set for three cities works much better than if trained in each city separately.
Then, according to the laws of the genre, you should try several libraries and play with the settings of the hyper parameters. In addition to the traditional XGBoost team decided to use Microsoft's LightGBM. Opinion of participants: CatBoost works no worse, but somewhat slower than competitors. But many noted that the CatBoost based model is less prone to retraining: the result on the hidden test sample was almost the same as the result on the debug sample.
The teams didn’t have enough time for stacking (i.e., building an ensemble of algorithms) - although the fourth-place owner used the gradient boosting predictions to train a model similar to a convolutional neural network (!).
* * *
All prize winners did a great job with the factors and especially the readings of amateur weather stations Netatmo. It was not easy: two neighboring stations, one of which is located under direct sunlight, and the other in the shade, can show the temperature with a difference of 15–20 degrees. Once the participants understood such data in a short time, it means that the task could be complicated - and, for example, completely excluded Netatmo readings from the training set.
As regards the use of results, the signs received by the teams will be the first candidates for signs in the service itself. And of course, the experience of preparing a basic solution helped us a lot. It combined several types of data collected around the desired area, according to the kd tree principle. This is exactly the way to aggregate different signals that directly or indirectly indicate the development of a weather situation.
We enjoyed the data science competition in the weather. A possible topic for the next competition (not necessarily a hackathon) is long-term forecasts. We have information about weather conditions around the world over the past 40 years. In these data it is worth looking for patterns: it seems that very soon the system will be able to tell you that in a month and a half the temperature will fall below the norm and it will snow.

Yandeks.Pogoda today - a large combine for processing indications that are not tied to a specific user. The service builds a forecast accurate to home due to machine learning from data received from large meteorological organizations. Our recent launch of world weather maps is another important step in the development of this system. But there are other data that can positively affect the accuracy of the forecast.
')
Why not use the testimony of home weather stations (of course, anonymized)? Or you can use the pressure sensor readings in smartphones. Or start to take into account in real time the error messages that users send from the application. I gave some of the most obvious examples - add to them a lot of indirect signs of what the weather is around. Take at least the strength of a cellular signal: when the phone does not catch the network well, one of the reasons is sometimes high humidity. A couple of weeks ago, one startup even attracted a round of investment, promoting this idea.
We made the first approach to understanding how data from users are able to help us, in early 2017. For several days we studied the readings of the pressure sensors mentioned, as well as information from the error messages. It became clear that there are too many possible methods and there are pitfalls everywhere. The idea to host a hackathon was a logical decision: we were going to offer participants a non-standard task, and at the same time get to know them and use the results to find out which areas of work are the most promising.
Any data scientist, including from Yandex (not from the Weather team), could participate in the hackathon, but with the condition that solutions from yandexoids would not fall into the overall ranking.
Training
We came up with the concept of the hackathon in the spring, but decided to hold it in the fall: first, to provide the teams with information gathered during the summer months, and second, that all potential participants have time to return from holidays. Since we did not use user signals on a regular basis until then, we had to get them first. We, as always , reached all the suppliers (inside and outside Yandex) - and, as always, we ran into some problems. The pressure sensor readings were unloaded, but not for the entire required time interval. We also decided not to provide messages from users to the teams: the data turned out to be too “dirty”. The unprepared data scientist, as we believed, would not have been able to lay them in the basis of a serious algorithm in 30 hours, but would only spend his time.
As a result, we prepared for the participants two sets of data for July and August of the current year. The first array consisted of testimony from amateur weather stations Netatmo. The manufacturer sells the testimony of each station, the owner of which has given its consent to this, and Yandex simply acted as one of the buyers. The second array is an open base of mobile operators. The database in an impersonal form indicates where the device was located and what was the strength of the signal from a particular cellular tower.
For the competition were used figures collected in Moscow, St. Petersburg and Kazan. In these cities there are radars whose readings have become an excellent target metric of the hackathon.
Task
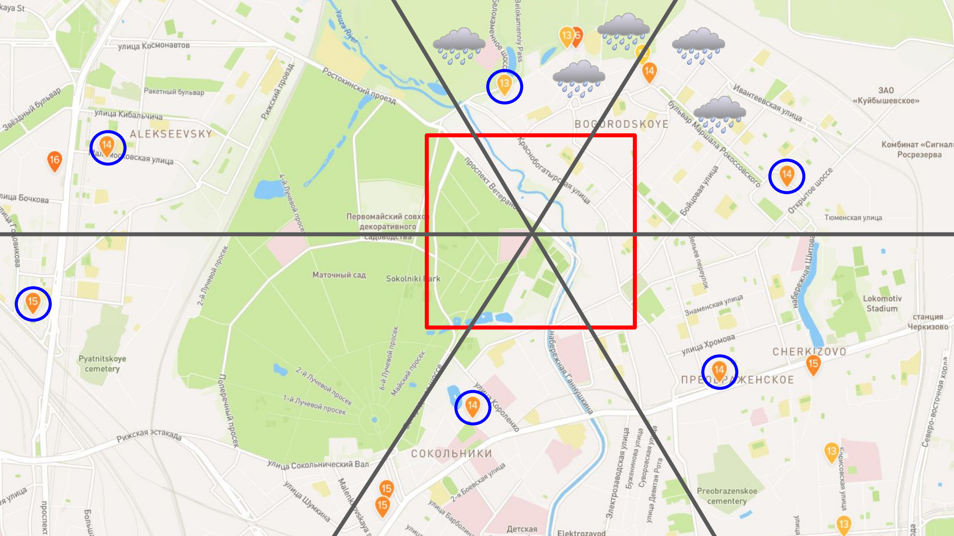
Each city is divided into squares. The task of the team is to determine whether it was raining for each square and each hour. In the training sample for each square known precipitation - the amount of precipitation in millimeters, fell at the end of an hour. It is believed that rain fell if precipitation> 0.25.Note: the task required to predict precipitation, while Netatmo meteorological stations do not know how to register precipitation - they only record temperature, pressure, humidity, etc.
Our baseline solution
To simplify the lives of the participants, we have provided them with a basic solution, extracting features from all available data. In particular, we showed how to add values from meteorological stations to data from phones and train the model without spending too much memory. Briefly about the decision itself:
In order to save resources, we will build a separate classifier for each of the three cities. Based on the data from the phones in each square, we calculate simple signs: the number of users, the average value and the signal level dispersion. Dispersion here acts as the easiest option to estimate the change in signal over time.Here is a good video about the principle of kd tree:
Add to these signs the average weather data from the ten nearest weather stations. Since the stations are not in every square, we use a k-dimensional tree (kd tree) to quickly find the nearest neighbors. On top of all the signs, we will train the classifier on CatBoost with default parameters and look at the resulting metrics.
It took us less than a day to write the baseline, but then we realized that we used extra data: the predicted values “accidentally” got into the training sample. I had to urgently arrange a nightly mini-hackathon before the main hackathon - the final version of the basic solution, where we do not break our own rules, was ready in a matter of hours before the competition. In total, two employees of Yandex.Pogoda spent about two full working weeks on data preparation and baseline development.
Decisions of the participants
The data provided to all teams occupied about 30 gigabytes. We did not prohibit supplementing them, but demanded that the training sample contain only data from users - simply because it was in them that the whole meaning of the hackathon lay. In other words, the base of indications of telephone pressure sensors would fit - if someone from the participants could get it. But as has already been said, it’s not for nothing that we limited ourselves to figures from amateur weather stations and from operators. Almost no one managed to find other suitable information on the Internet - and those who succeeded did not benefit from it anyway.
30 gigabytes in a very limited time - not so little. We warned participants that they would either have to use their laptops for machine learning, or rent cloud capacity.
Idea Yandex
The solution proposed by my colleagues from the YT project was reduced to the generation of good features and learning by the classical method (gradient boosting over decisive trees). The guys used CatBoost - perhaps because of patriotism towards Yandex, but according to them, our library showed “much more” successful results than others.
The best signs were data from amateur weather stations. Based on them, various statistics were considered: average, maximum, minimum, variance, etc. It is worth noting that the readings of the nearest stations were used and a few more - distributed around the target square. This distribution was not truly uniform: in Russia there are not so many Netatmo devices, and those that are always online and with the user's permission broadcast readings to the Internet, even less.
Custom signs, such as the average speed of movement of people in the target square, also played a role, although not very large. A total of about 7 thousand signs turned out - which, of course, could be filtered without losing as a model. But the team had enough resources to train with so many, so optimization was not really required. CatBoost itself was trained practically on default parameters: tuning led to absolutely insignificant changes in quality, and took a lot of time.
Winner Ideas
Feature set enhancement
Firstly, the search for the nearest meteorological stations in the base solution was, of course, the most naive: the distance was calculated using the Euclidean metric. It is not entirely correct to compare geographic coordinates in this way; therefore, many immediately suggested a correct calculation of the distance on a sphere.
Secondly, as mentioned above, the number of stations is small, and the information from the next few of them does not always give a complete picture. It so happens that all stations are located in the northeast, where it is now raining, and the weather in the west is completely different. One of the teams divided each square into six sectors and set up a search for the nearest weather stations in all sectors separately.
Thirdly, the base model processed data for each next hour, regardless of the values obtained earlier. Members of another team have adjusted the counting of various statistics from time series - which, in turn, were built on the basis of the data we provided.
The base of mobile operators was less useful. Some of the teams added additional features based on the signal strength data, but it turned out that they did not give a significant increase. On the other hand, during the discussion of the results, the first place holders reported that the current average speed of movement of users provided a good contribution to the model. And it's true - in case of rain, people tend to move faster to hide somewhere. And another participant improved the result a bit when he took into account that during the precipitation there are fewer people on the street.
Improving the model itself
After some time, all the teams found that a model trained on the general data set for three cities works much better than if trained in each city separately.
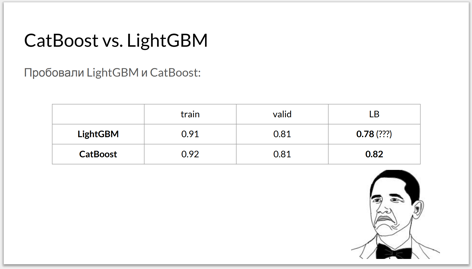
Then, according to the laws of the genre, you should try several libraries and play with the settings of the hyper parameters. In addition to the traditional XGBoost team decided to use Microsoft's LightGBM. Opinion of participants: CatBoost works no worse, but somewhat slower than competitors. But many noted that the CatBoost based model is less prone to retraining: the result on the hidden test sample was almost the same as the result on the debug sample.
Slide from the presentation of participants
The teams didn’t have enough time for stacking (i.e., building an ensemble of algorithms) - although the fourth-place owner used the gradient boosting predictions to train a model similar to a convolutional neural network (!).
* * *
All prize winners did a great job with the factors and especially the readings of amateur weather stations Netatmo. It was not easy: two neighboring stations, one of which is located under direct sunlight, and the other in the shade, can show the temperature with a difference of 15–20 degrees. Once the participants understood such data in a short time, it means that the task could be complicated - and, for example, completely excluded Netatmo readings from the training set.
As regards the use of results, the signs received by the teams will be the first candidates for signs in the service itself. And of course, the experience of preparing a basic solution helped us a lot. It combined several types of data collected around the desired area, according to the kd tree principle. This is exactly the way to aggregate different signals that directly or indirectly indicate the development of a weather situation.
We enjoyed the data science competition in the weather. A possible topic for the next competition (not necessarily a hackathon) is long-term forecasts. We have information about weather conditions around the world over the past 40 years. In these data it is worth looking for patterns: it seems that very soon the system will be able to tell you that in a month and a half the temperature will fall below the norm and it will snow.
Source: https://habr.com/ru/post/344366/
All Articles