Trading supervised: an example of a business monitoring system
There are many dozens, if not hundreds, of IT infrastructure monitoring tools. There are indisputable folk favorites like Zabbix, with which you can pile monitoring for a medium-sized company, and a legion of utilities, services and powerful packages for every taste and size.
But with business monitoring all the more difficult. The market does not say that many finished products, on the basis of which you can quickly assemble a dashboard, so that high authorities can track the level of sales and promptness of delivery. Usually, business monitoring is a highly specialized project that is being done for this particular company, taking into account the characteristics of its information systems. About this project - our story.
One of our clients needed a business monitoring system, which conveniently reduces and clearly shows the current business indicators. For example, how are sales going, have they grown or have fallen compared to the same time of the previous period, in which branches does business go faster, how do different services work, how are loans for purchases made, volume of payments through online channels, distribution by type of delivery and Further.
')
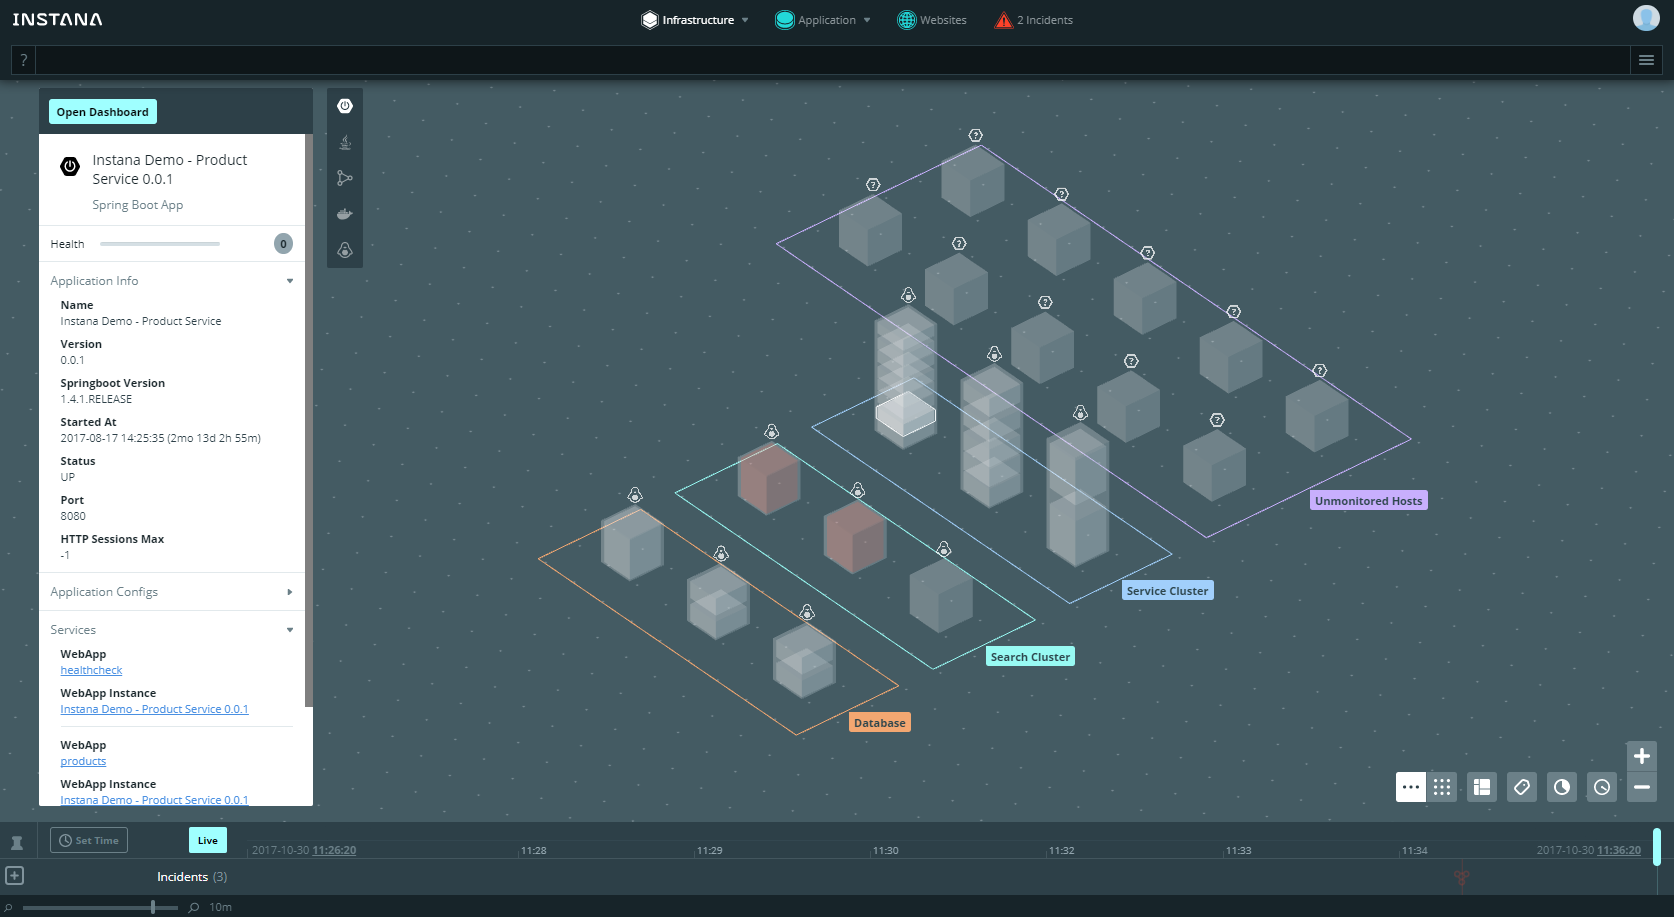
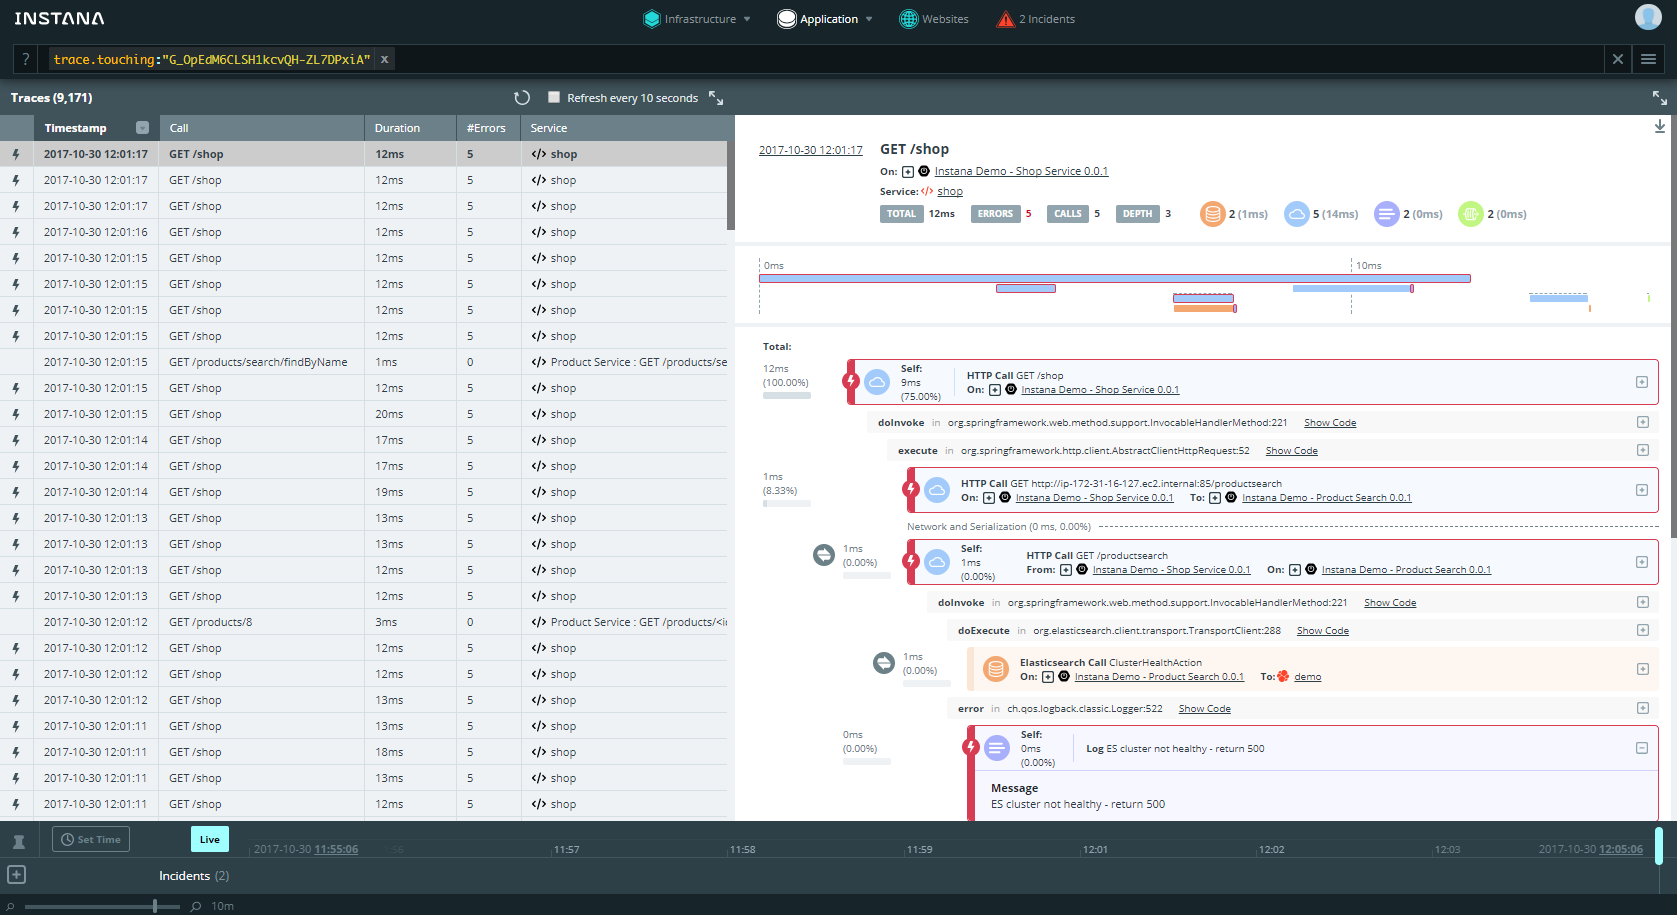
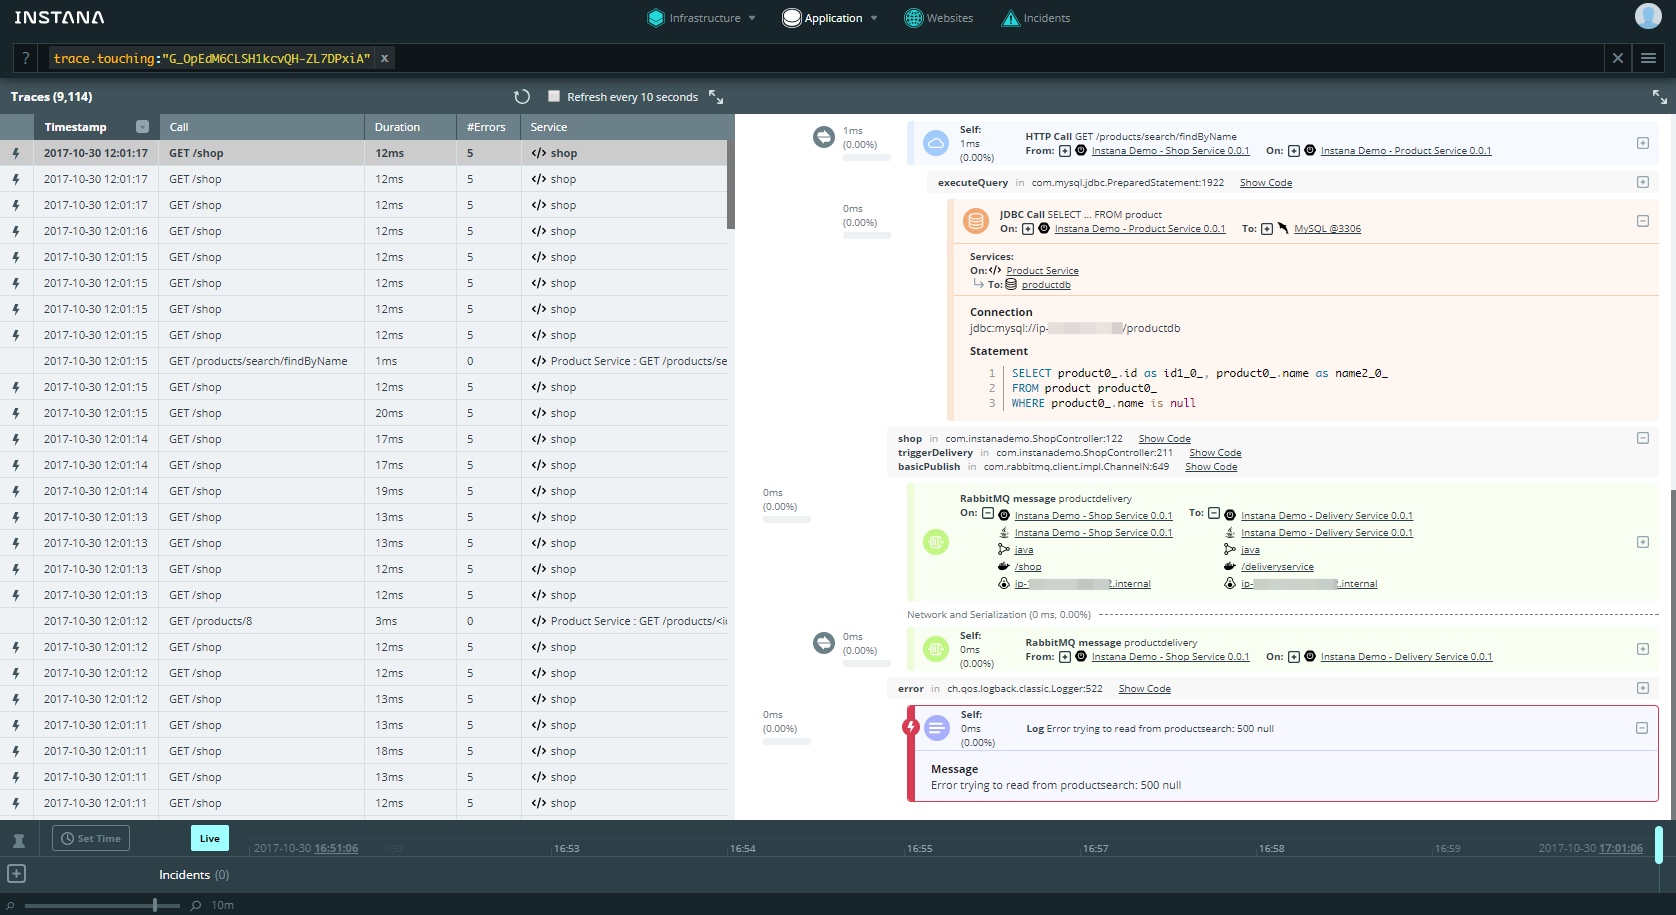
At that time, we just tried different APM solutions (application performance monitoring). And among them we liked Instana. Quite a fresh product, which is probably why cheaper competitors. In addition, the technology in Instana used fresh - Cassandra, Kafka, Elastic Search. The system is able to track everything through from the hardware to the end service and the end user. Also in Instana two levels of display of monitoring data. The first level is infrastructure, hardware and software: operating systems, applications, containers, and so on. The second level is business logic: services in the application, their interaction with each other. For example, you can track the work of the cart service in an online store. At the same time, the service may consist of a group of microservices: one calculates the total cost, the second pulls promotions, the third calculates the shipping cost.
For administration, Instana is very convenient: there are various types of search, the granularity of the data (as opposed to competitors) is only 1 second. Competitors usually average data per minute, while the load grows to 30%, and the smaller the granularity, the higher the load. At Instana, data is collected every second and the load on the application is minimal - up to 5%. This allows you to track the shortest interruptions, errors, load growth, and more.
Another advantage of the product is the correlation of events. Suppose there was a problem on the server that pulled the application application and the corresponding service behind it - as a result, the end users encountered errors and errors on the site. Instana correlates all the events for which triggers are triggered, and gives the engineer a single incident describing the entire causal chain. It helps to immediately find the source of the trouble.
In general, we liked Instana and we came with her to the customer. They looked at her and said that everything is very beautiful. For admin. And they need a simpler and more visual tool - for business users. So that they can see in real time the reasons for the fall of certain business indicators.
We began to think how to implement all the requirements for business monitoring and ease of display. I was pleased that Instana has convenient APIs for getting all the necessary metrics from the customer’s existing systems.
We tried a bunch of algorithms and approaches. The finished solution was written on Ruby on Rails, using Redis, a bunch of Elastic Search and data from the database. Logic based machine learning for all kinds of triggers was stitched there. That is, the system itself learns which threshold values need to include “red lights”: it conducts a technical analysis of all the data for which triggers are needed, compares various factors, and automatically sets thresholds. Suppose the day is 100 orders in five minutes, and at night - 10 orders. In Zabbix, threshold values are written manually. But the business is growing, changing, and you have to constantly adjust the threshold values for many indicators. Thanks to machine learning, Instana is able to understand that during the day orders are clearly more than at night, and independently calculate adequate threshold values.
This is with business metrics. If we take technical metrics, the monitoring system should know how each technology behaves, how it uses resources, how drastic changes can be. If the behavior does not match the pattern, the red light comes on. In this case, the "template" is a complex algorithm, and not just some threshold values.
Instana collects metrics from various customer systems and transmits to our dashboards, where all this is clearly and simply visualized.
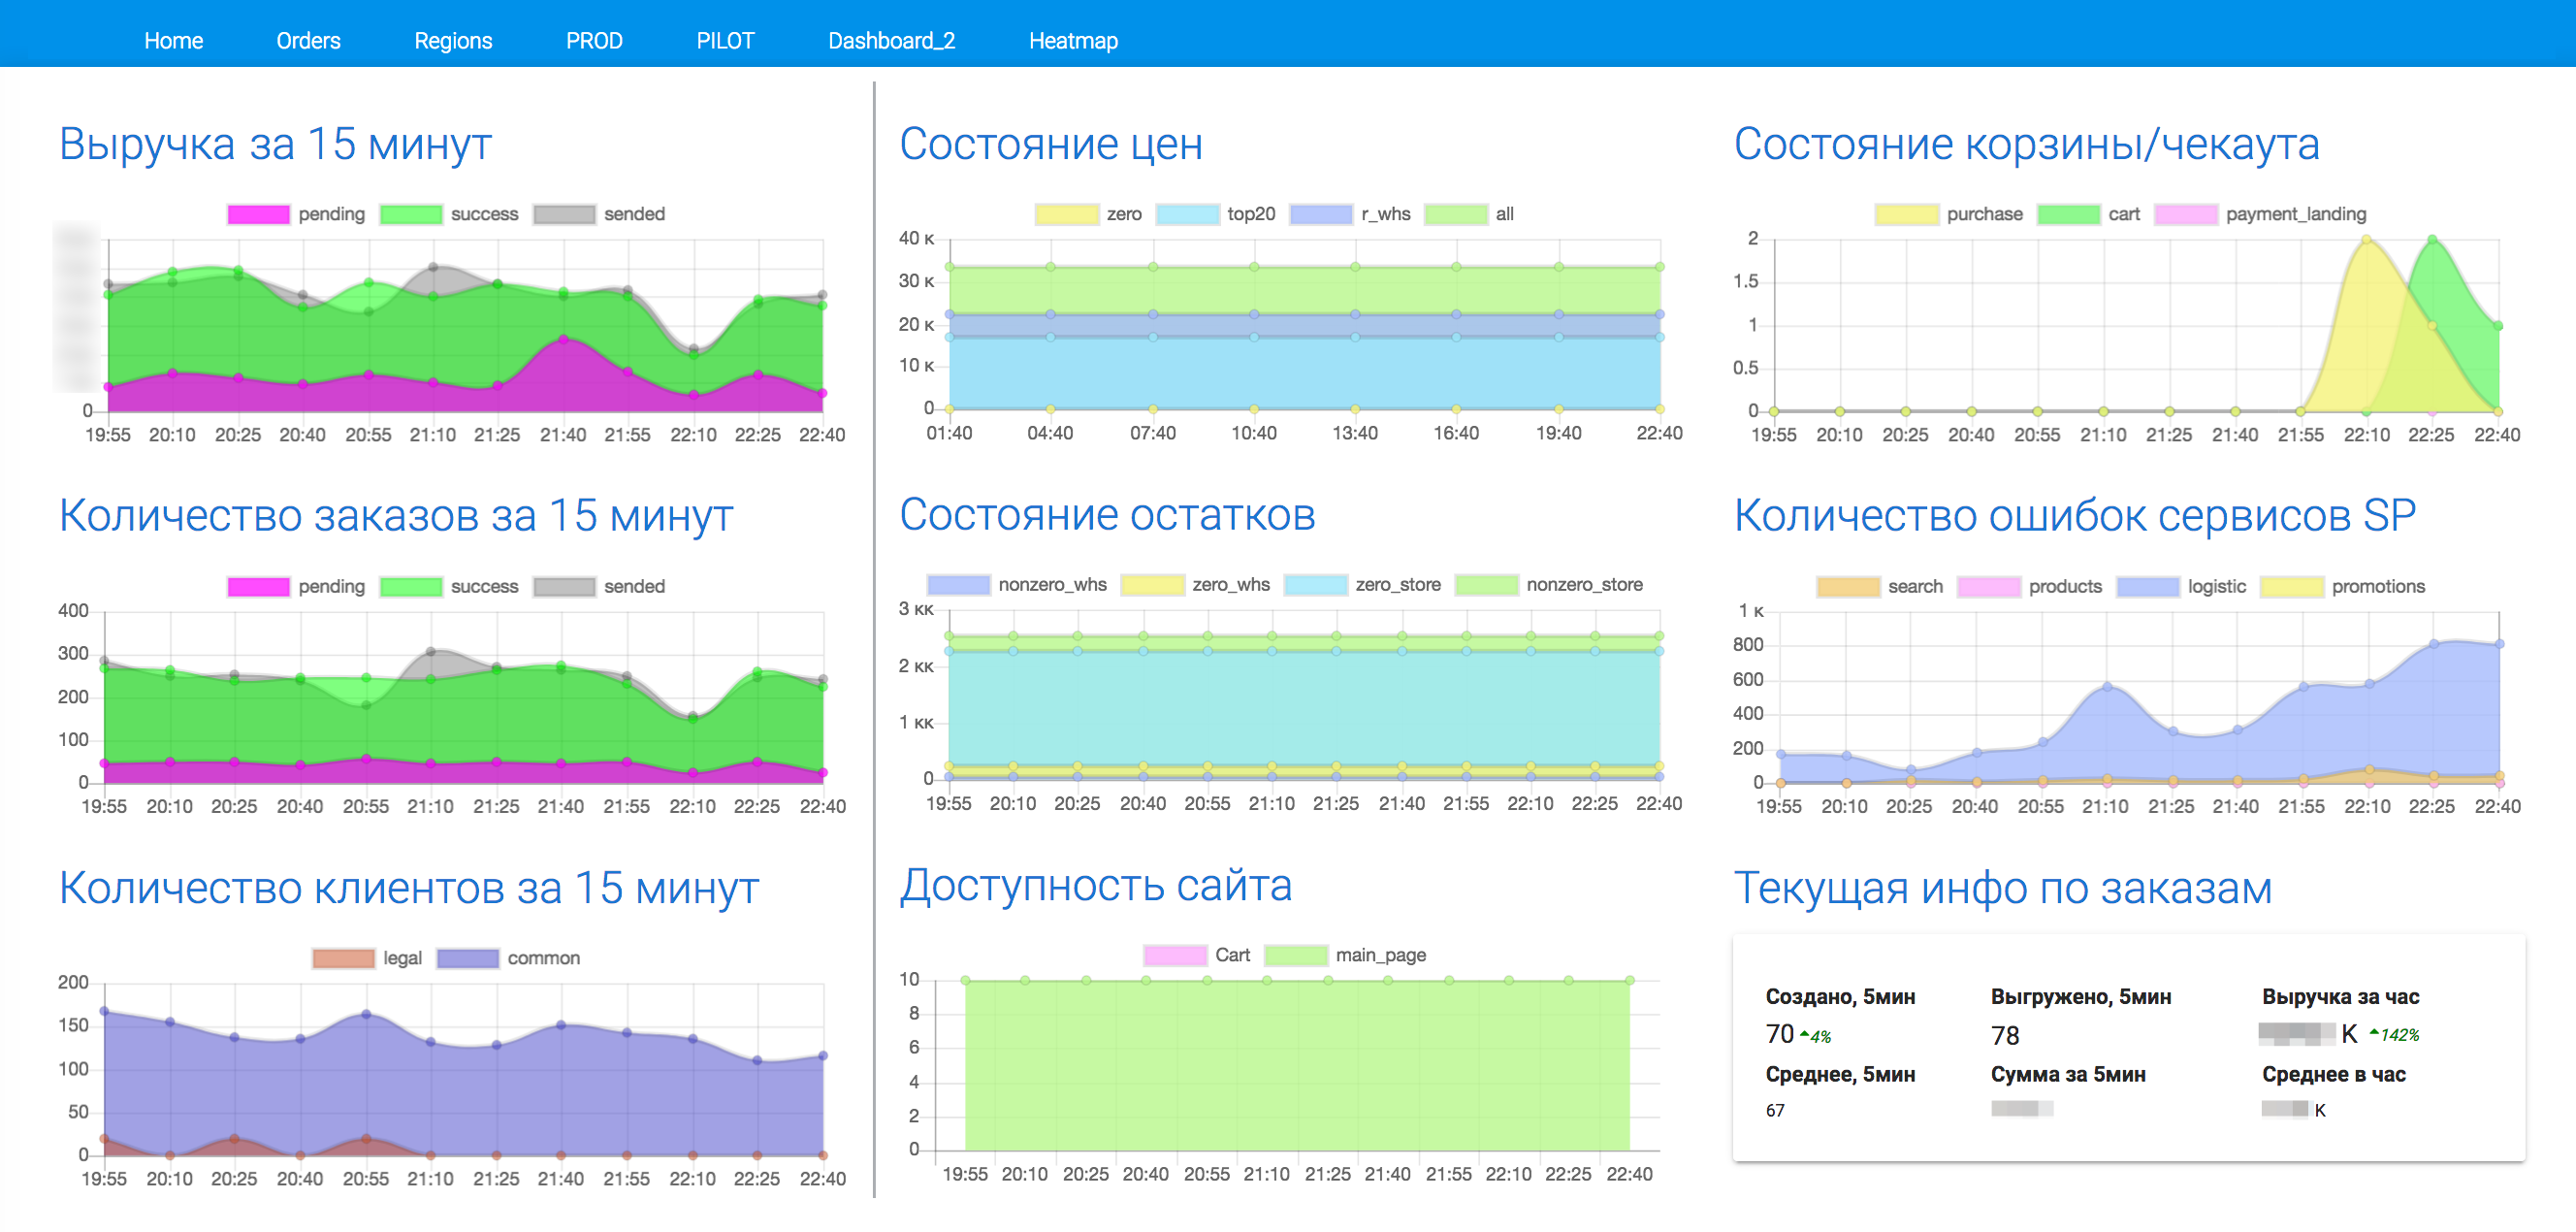
On the main page you can see the number of orders, revenue, number of customers. All this is correlated with prices and stock balances. You can also see the availability of the site and the number of errors in various services.
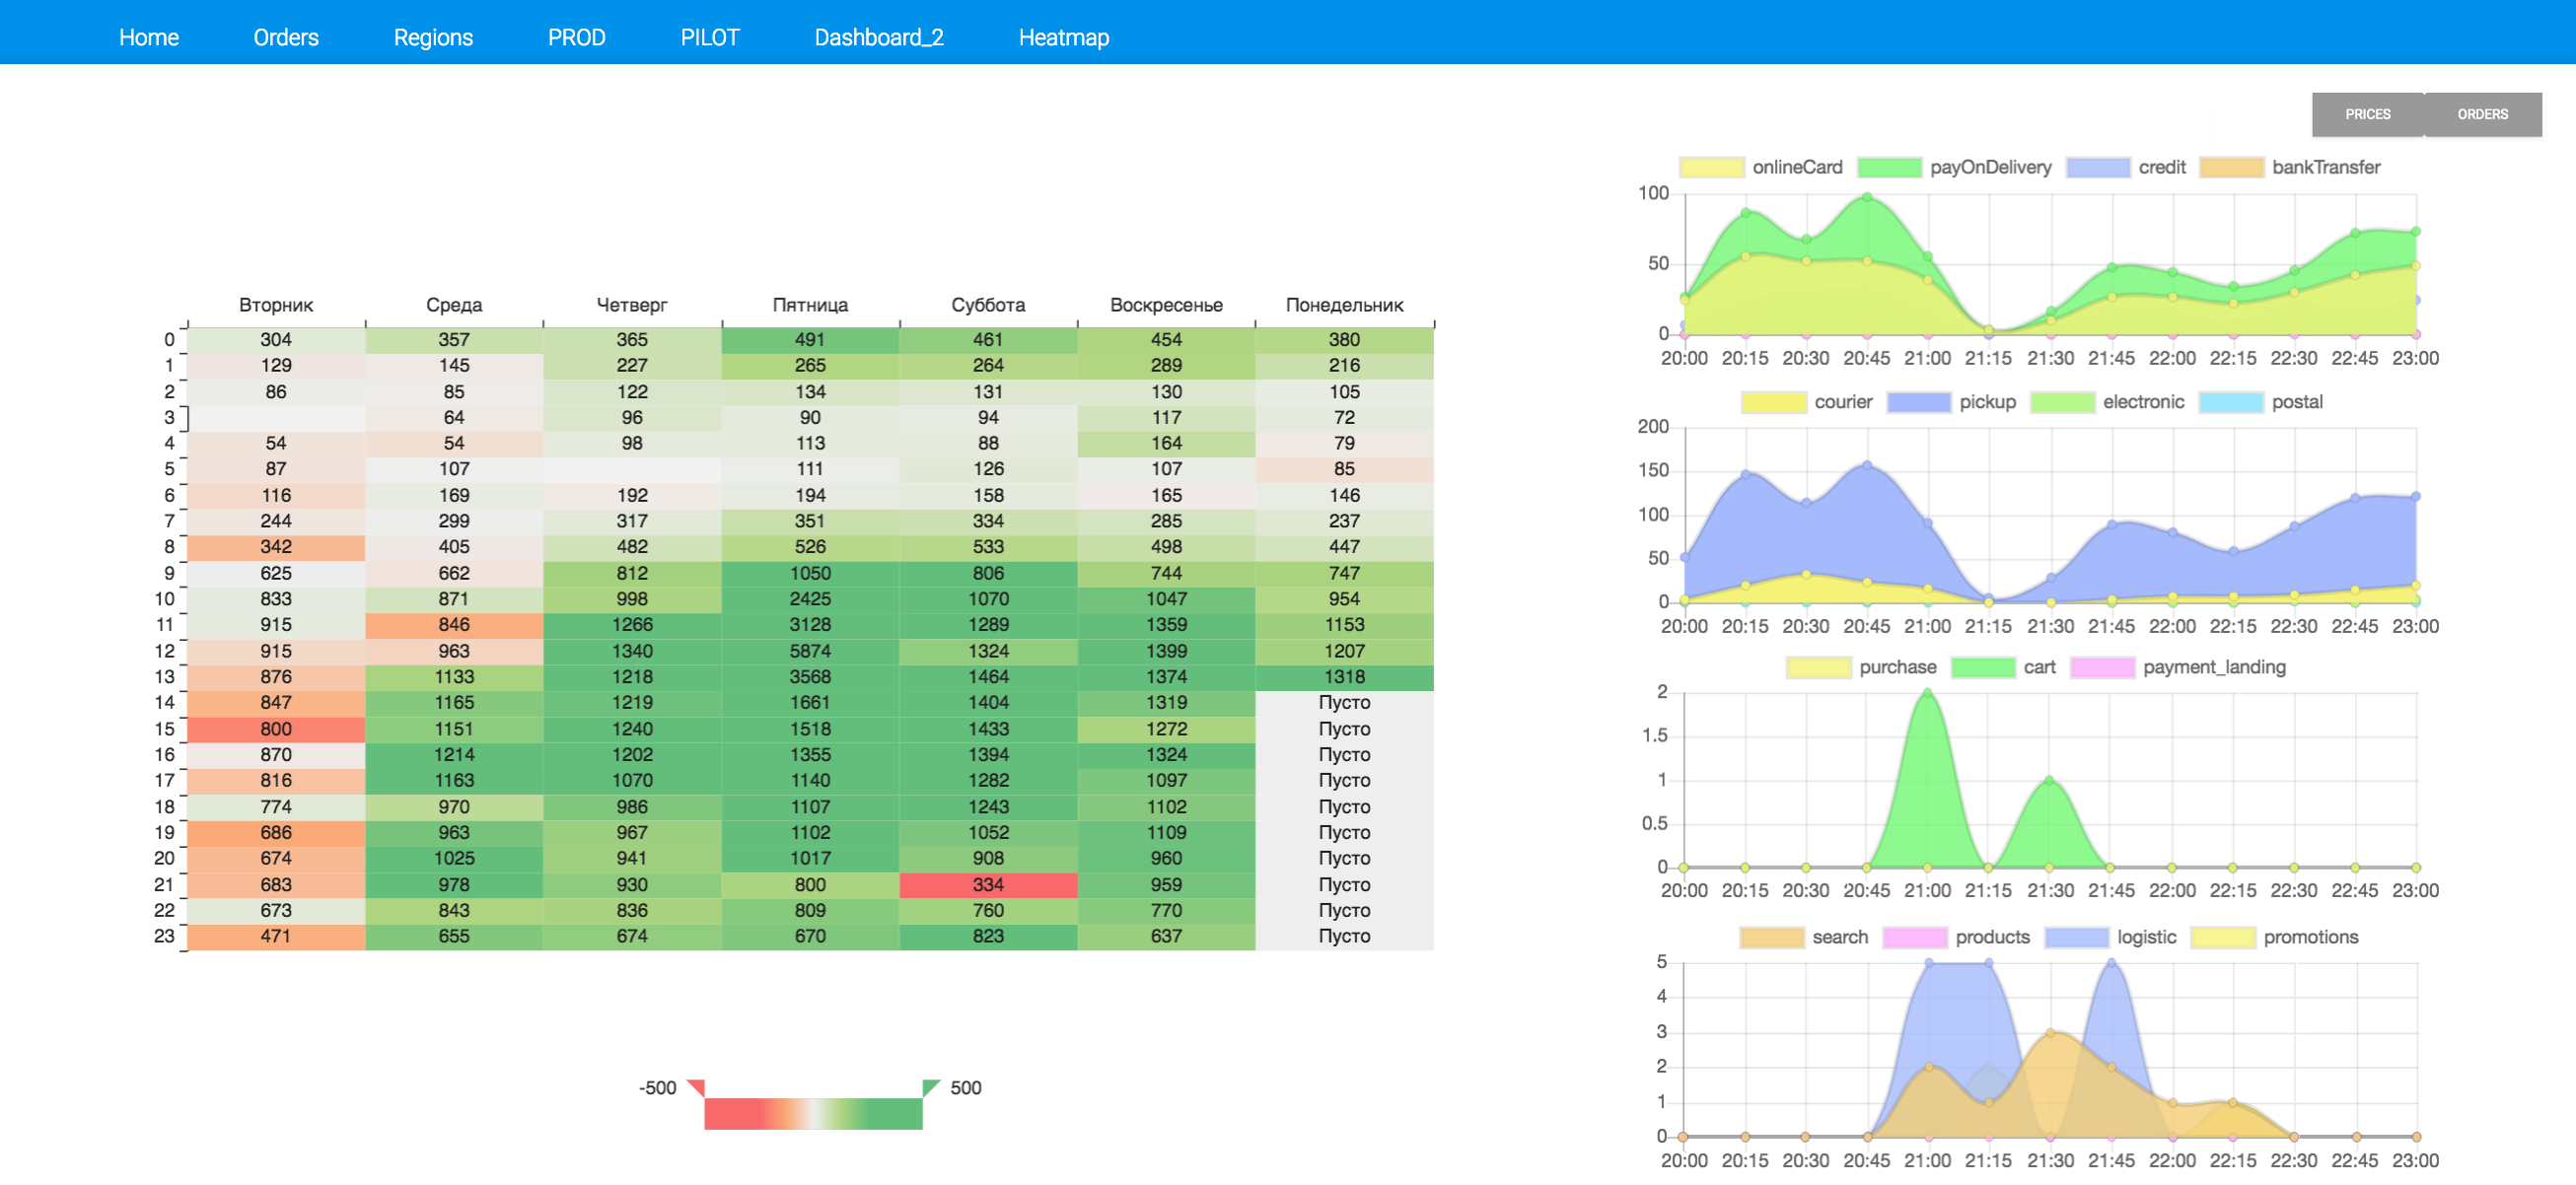
Here you can see the average number of orders for each hour, and the cell color reflects the difference between the current and average values for the same hour on the same day of the week during the month. If today orders are more than the average value for the previous period, the cell is green, if less - red. Right graphics on the type of payment and delivery of completed orders, as well as errors on the main services responsible for processing. You can apply a filter and select the most problematic periods, then look for reasons.
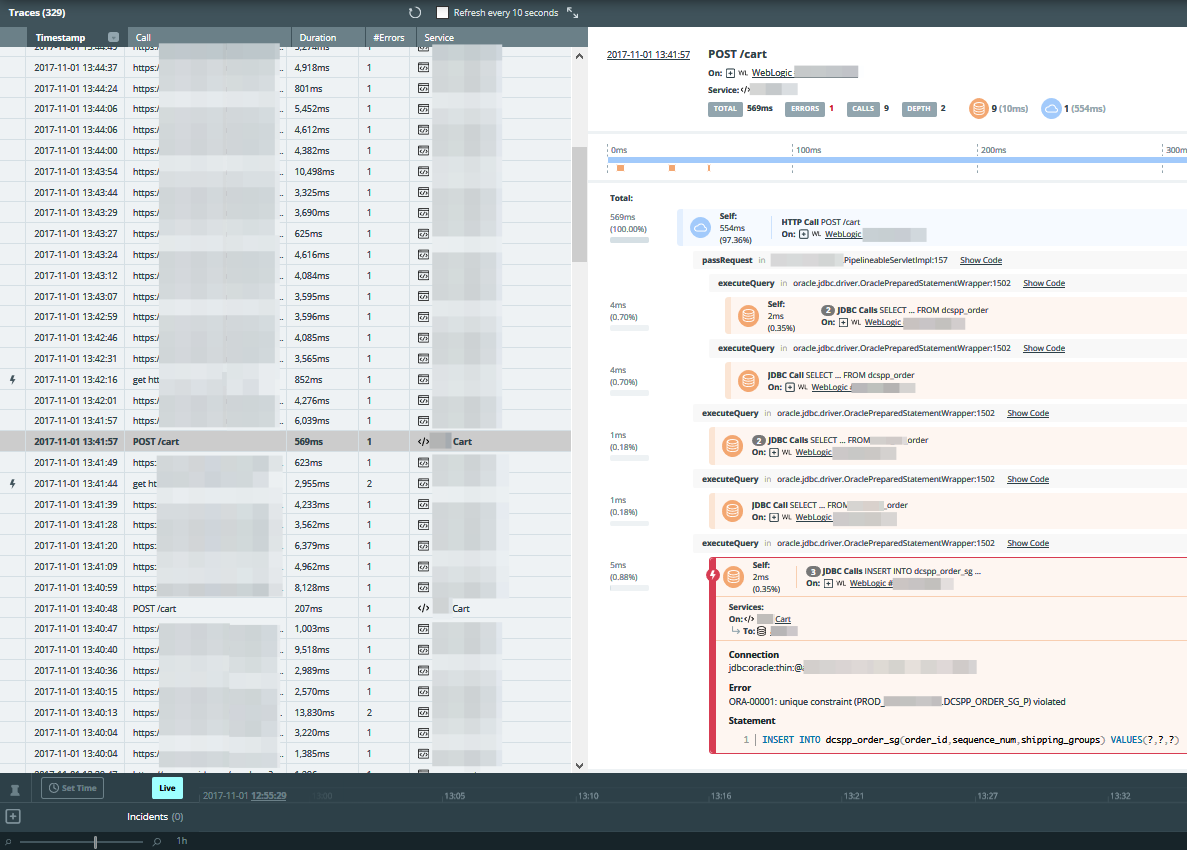
If you click on the chart, we “fall through” into it and see specific errors with errors during this period. Details are displayed: where errors occurred, which ones, up to and including decompilation of the code: on which method and in which class.
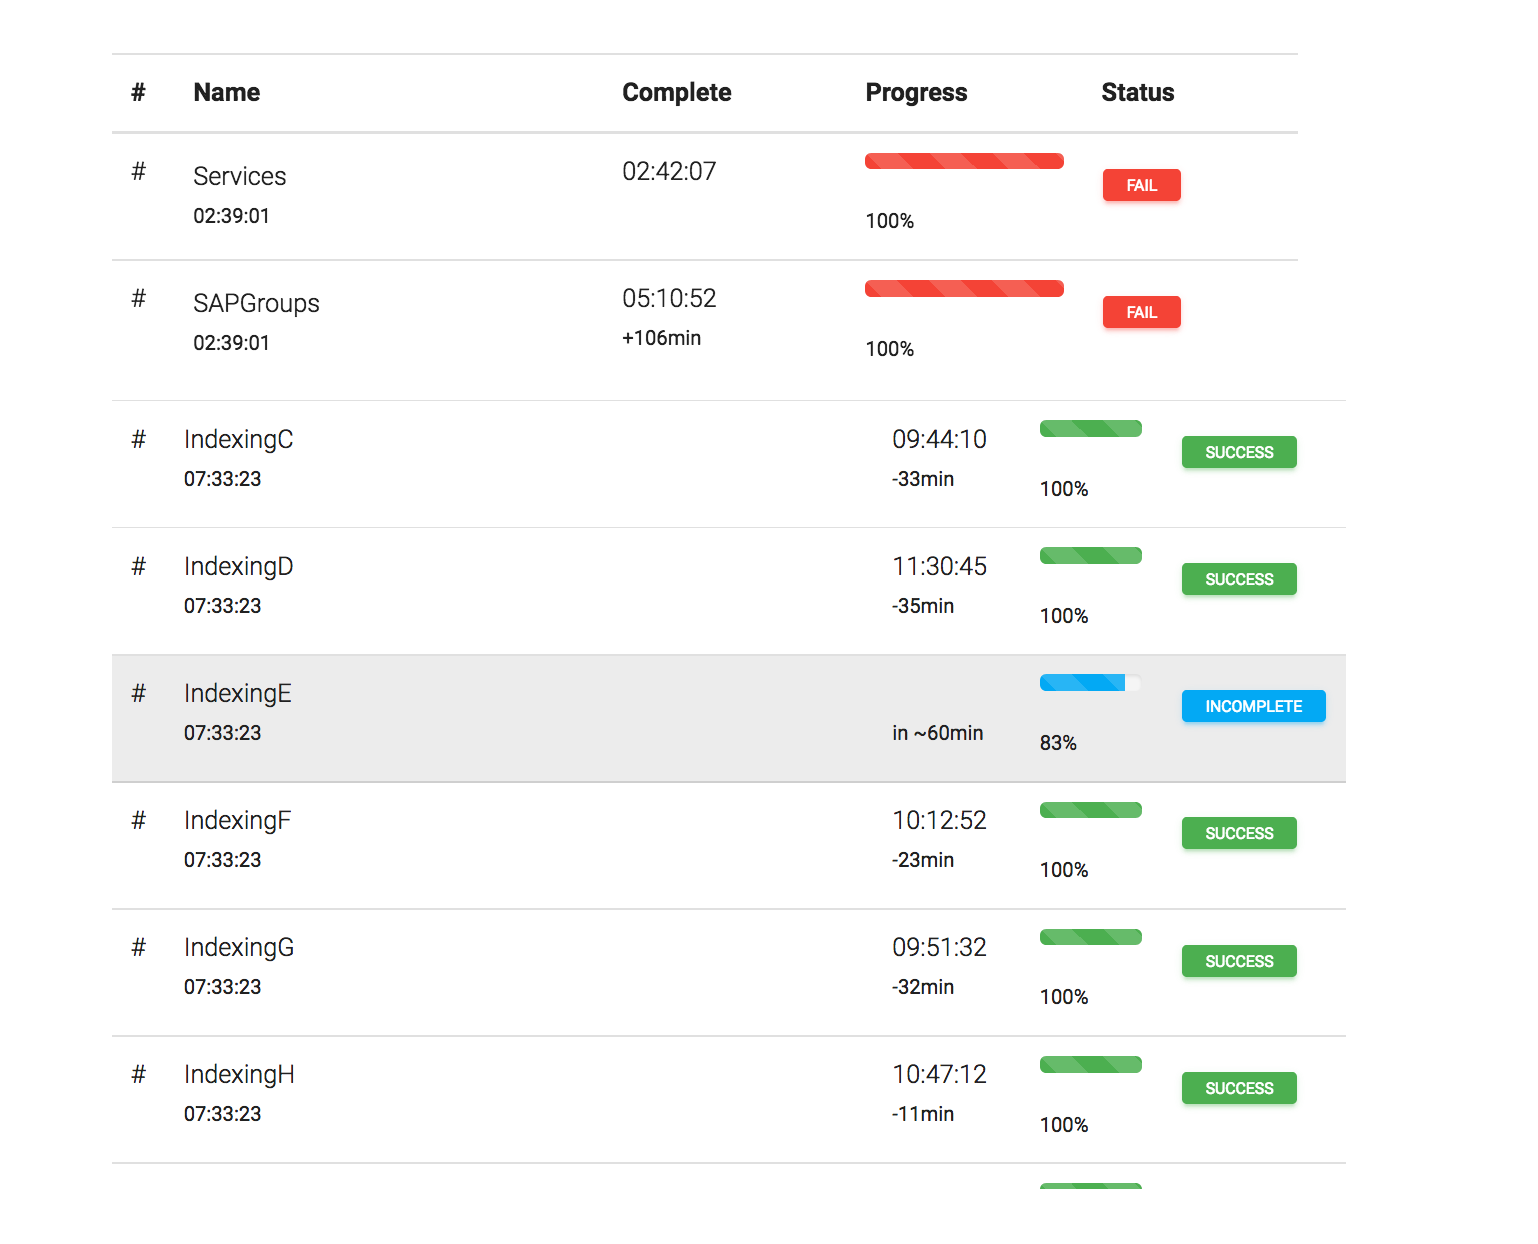
In the dashboard, you can track the success of the execution of the main tasks of data processing, and if they are still executed, then how many will be completed. For example, you need to update the prices and range on the site. Information about products and prices during the day is unloaded from several systems, and is processed at night. 43 tasks are completed within 6 hours: some take minutes, others take hours. And business users need to understand which tasks have been completed, which have fallen when they have ended.
We have implemented an interesting function: in the dashbor, you can see which of the users left the online store without buying anything because of errors on the site itself or in the associated software. Moreover, it is shown exactly which mistake tore each of the transactions. By the way, the task is not at all idle, given the number of visits and sales through the online store.
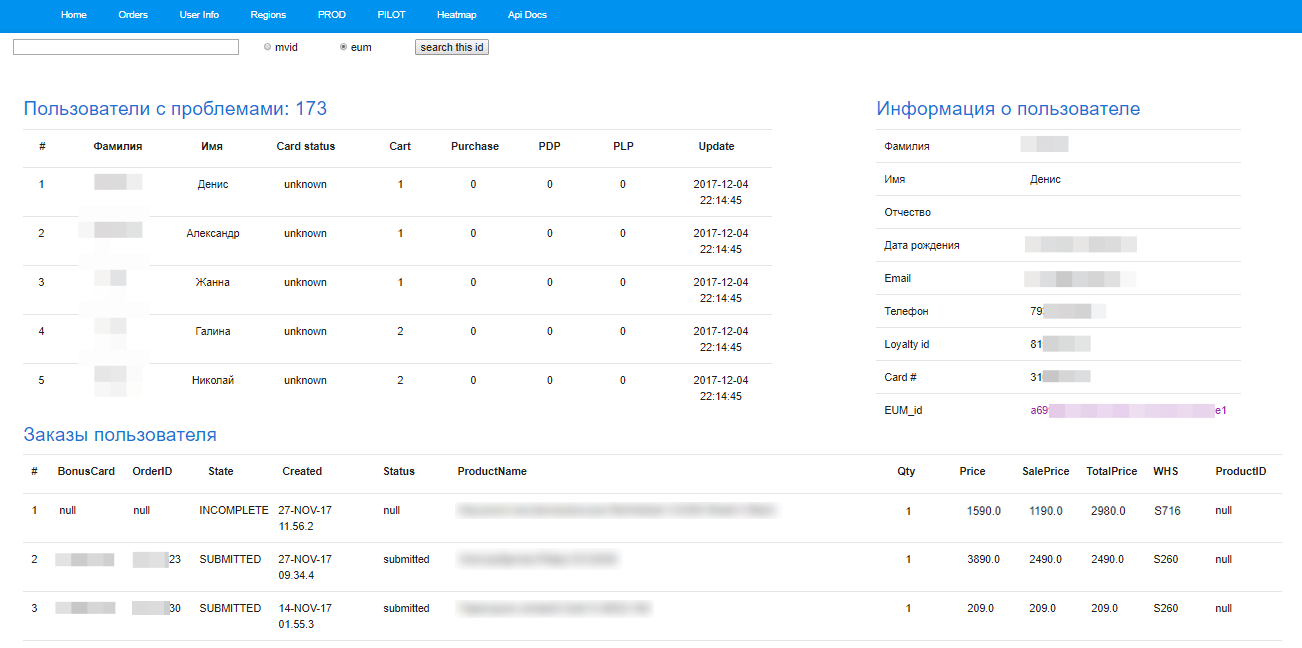
All information on each client who left is displayed: contact information, completed orders and those that could not be issued. Call center employees can call, send an SMS or email, like this: “ We see that you wanted to buy a smartphone from us, but encountered difficulty. Engineers are already sorting this out. Here's a promo code for you, come back tomorrow and buy a smartphone with a discount . ”
On another tab, you can see the situation in the branches: sales, number of orders, stock balances, processing status of new prices, and so on. All this in close connection with Instana.
Our system can correlate a variety of business metrics with technical metrics, collecting data from different systems - the same Instana (but not necessarily, in its place there may be another monitoring system), from various databases, from the log repository.
The customer is testing our system. As for the future prospects of the solution - it, of course, needs to be adapted to the tasks of a particular business. But after a number of rakes already collected on this field, it will be much faster and easier to do this. And the scope of application of business monitoring is essentially any business where there is a need to monitor the real-time operation of business applications and associated business metrics.
Jet Infosystems service center. CRM and web applications support team.
Source: https://habr.com/ru/post/344180/
All Articles