How I came up with and used the format of storing the results of experiments Measurelook
Due to the specifics of scientific activity, I need to measure the time of the algorithms and build on the resulting graph data. Previously, the process looked like this:
- Algorithm prepared.
- Run the experiment, the output goes to the log.
- Transfer data to Excel.
- Postprocessing: split, group, sort.
- Build a graph, and it is a curve - an error in the experiment, go to step 1.
The first problem - just to see how the experiment went took a very long time.
Okay, we survived, the graphs were built, time is running, we are preparing a publication, and it turns out that some experimental parameters of the algorithm are not saved in the experimental results. Did not watch. This is the second problem - the storage of metadata about the experiment.
As a programmer, I was always annoyed by the need for “manual work”. Yes, the schedule is ready, but we will manually move something else, repaint it, then draw it. Every time new data arrives, this process has to be repeated. The third problem - rebuilding charts should be fully automated.
To solve these problems, I came up with a format for storing data in JSON and called it Measurelook. In this article I will talk about Measurelook and its use in the preparation of a scientific publication.
Principles - Format and Viewer
Format and viewer are two key components of Measurelook. The format describes the data storage scheme of the experiment. The viewer is a stand-alone web page that visualizes the experiment data. You load the file with the experiment data into it and the viewer draws graphics on it.
The viewer also includes a validator and a migrator. The validator checks with JSON Schema the correctness of the uploaded file. Migrator automatically updates the version of the file with the experiment. On the one hand, this ensures backward compatibility with the current version of the viewer. On the other hand, you do not need to update your source code to the new version of the format, if the old one suits you.
The format and viewer work together, but when they are created, different goals are pursued. The format is designed so that the researcher can save the data he needs. The viewer is made to visualize simple data. It builds two-dimensional graphics, but there are no three-dimensional or more dimensional ones. In the format description, I will indicate what the format can store and cannot display the viewer.
Measurelook format
Measurelook describes the structure of a JSON file for storing information about a computational experiment.
Meta is an arbitrary JSON object for storing data about an experiment. Examples of data: the name of the implementation of the algorithm, compilation parameters, parameters of the hardware and software environment, the name of the dataset. Here you can also display some parameters of the algorithm run, but more on that later.
Note: The viewer currently does not know how to handle arbitrary metadata. It assumes that all metadata are strings.
Example:
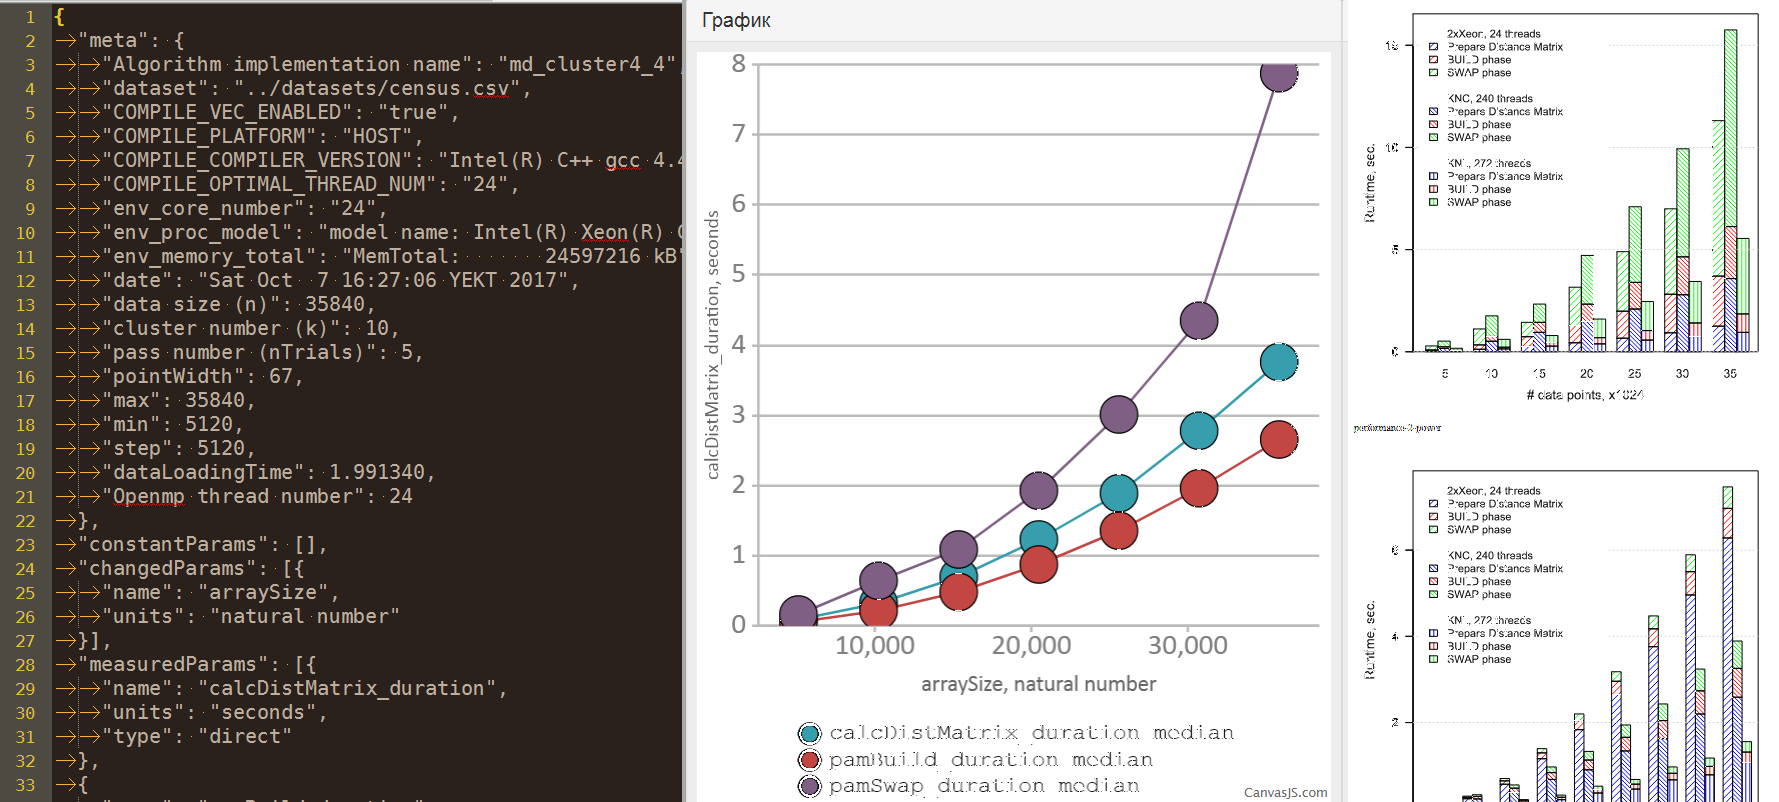
{ "meta": { "Algorithm implementation name": "md_cluster4_4", "dataset": "../datasets/power.csv", "COMPILE_COMPILER_VERSION": "Intel(R) C++ gcc 4.4 mode", "env_core_number": "24", "env_proc_model": "model name: Intel(R) Xeon(R) CPU X5680 @ 3.33GHz", "max": 35840, "min": 5120, "step": 5120, "dataLoadingTime": 0.062945, "Openmp thread number": 24 } } Algorithm parameters . Previously, my idea of experiments was somewhat naive - we change one parameter, measure another, build a graph. Well, well, we change one, measure several, build several graphs. But when I got acquainted with the thesis of Teplova A.M. “Analysis of the scalability of parallel applications based on supercomputer code design technologies” has changed the concept. In his study, graphs are built in two variable parameters and one measured. For example, we change the size of the input data and the number of processes, and measure the performance. Accordingly, it should be visualized by the surface in three-dimensional space.
I decided that this is an important generalization and singled out three groups of algorithm parameters: constants, variable parameters and measured parameters.
A constant is a parameter of an algorithm that does not change during an experiment. The constant is described by a triple: name, units, value. It is preferable to store constants in this block, but it may be more convenient for you to store them in metadata. Example: dataset dimension.
Variable parameter is a parameter of the algorithm that changes during the experiment. It is described by a pair: name, unit of measurement. Example: input data, number of streams.
The measured parameter is a parameter of the algorithm, which is measured during the experiment. Previously, it was also described by the pair: name, unit of measurement. Later, the division into fixed and indirect parameters was added. The fixed parameter is the value directly measured during the experiment. Example: data load time, the time of the algorithm. An indirect parameter is a parameter that is calculated as the sum of the values of fixed parameters. For them, a list of fixed parameters. Example: the total running time of an algorithm is the sum of the data loading time and the running time of the algorithm.
Note: currently, the viewer is able to build graphs using only one variable and several measurable parameters. The case with two variable parameters needs to be drawn as a surface in three-dimensional space or transformed into a series of graphs in two-dimensional space by translating one variable parameter into a measurable one. This is realizable, but I did not have such a need.
Examples:
{ "constantParams": [{ "name": "dimensionality", "units": "natural number", "value": 3 }], "changedParams": [{ "name": "arraySize", "units": "natural number" }], "measuredParams": [{ "name": "calcDistMatrix_duration", "units": "seconds", "type": "direct" }, { "name": "pamTotal_duration", "units": "seconds", "type": "indirect", "sumOf": ["pamBuild_duration", "pamSwap_duration"] }], } After describing the parameters of the experiment go to the measurements . The structure of the metering record:
- measureKey, a string is a unique key of each measurement. It is recommended to collect it as a set of values for all variable parameters and the run number.
- passId, number - number of the pass.
- changedParams.name, number — values of all changeable parameters fixed at the time of the run.
- measuredParams.name, number - the values of all measured parameters obtained during the run.
- The raw object is arbitrary run data you want to keep. For example, in the future to double-check the values of measured parameters.
Example:
{ "measures": { "5120_0": { "measureKey": "5120_0", "raw": { }, "passId": 0, "arraySize": 5120, "calcDistMatrix_duration": 0.033690, "pamBuild_duration": 0.054846, "pamSwap_duration": 0.199832, "iterationCount": 5, "avgIterationTime_duration": 0.039966 } } } Other values:
- version, string - format version. The system has a built-in migrator that automatically updates files in the old format to the new one to ensure backward compatibility.
- name, string - the name of the experiment. Added to the format, but currently is not used by the viewer.
- timestamp, string - the time of the experiment. Indicated in free form. Added to the format, but currently is not used by the viewer.
Example:
{ "version": "0.3.0", "name": "PAM performance 1", "timestamp": "27.11.2017 22:33:44", } Viewer
The viewer is a web page that displays basic information about the experiment and you can see the primary graphs.
Functions implemented:
- Graph display for each run
- Display of graphs by mean and / or median
- Selection of any subset of changeable parameters for drawing
- Replacing the values of variable parameters on their logarithms
- Display of currently drawn data in a table with the ability to download CSV
- And the most important feature - pasting the results of the experiment from the clipboard. Very handy during the debugging process.
From data to final plots
JSON is a common thing, the format is simple. I suppose you can organize data output in this form in many programming languages. For myself, I made an auxiliary printer in the C language using bstring. It is published with an example of use on a githab (see links).
Whereupon I consider that I completed the “How to do it?” Part and turn to the “What to do with it?” Part.
As it was with me - there are a lot of files, measurement results. It is necessary to process them into beautiful graphics.
I did this as follows:
- The nodejs program reads data and performs post processing. For example, recalculates the time of the algorithm in acceleration.
- Called Mustache template engine. He is given a template of a program in the R language for plotting into which our data is embedded. At the output we get a program for R drawing the desired schedule.
- R program is executed, and its result is saved in the vector format svg.
- svg is converted using Inkscape to the final presentation: pdf image for the article or png for the presentation.
Anticipating questions:
Q: Why R, not d3.js?
A: Because I had a little experience on R before that, and because programming d3 seemed subjective to me to be too low-level.
Q: Why does R save svg instead of pdf and png right away?
A: R it certainly can, but when I tried it, pdf he tried to print smartly with fonts. Apparently, he did not find the Cyrillic alphabet and the graphics were obtained without inscriptions. So, yes, another superfluous program, but it is guaranteed to work and I trust the quality of the Inkscape transformation more.
From my large repository for drawing 8 types of graphs, I made a small drawing of one type and published it on a githaba (see links).
Conclusion
The project Measurelook solved the tasks set for it - the organization of data storage for computational experiments and a simple preview tool. It also served as the basis for solving the third task - a fully automated rebuilding of graphs.
Links
')
Source: https://habr.com/ru/post/344174/
All Articles