Visual Studio extension to render instances of custom classes in debug mode. Part 2
This article is a continuation of an article from the distant 2014. Let me remind you of what was discussed in the last article .
We write software in C ++ , in the environment of Visual Studio 2015 . We in the project, naturally, have user data types. As an example of such types I can give the class MbSolid . This class is part of the mathematical core C3D and is an abstraction of a solid body. The body is described by faces, faces by some surfaces, etc. Those. the class structure is quite complicated, and in the process of debugging my own algorithms, I would like to visually estimate what kind of body has turned out at the moment.
Picture from last article. As an example of a custom class, the straight line class is used there.

')
To solve this problem, an extension for VisualStudio was written. There is nothing interesting, links are in the last article. But there was a problem - how in the extension VisualStudio to get data from the address space of the process being debugged (another)?
In the case of simple data types, such as arrays, everything is not so difficult, and Microsoft even prepared an example for std :: vector . In our case, MbSolid has an impressive inheritance hierarchy and a large number of data fields.
In the last article, an invasive solution was proposed to solve this problem. A marker field is added to each custom class (which we want to visualize during debugging). And in each non-constant class method, code is added to serialize the class data into shared memory . In the marker field, the address is stored in shared memory , where we saved the class data. At the time of debugging, when viewing the contents of a variable of interest to us, the VisualStudio extension finds a marker field and deserializes the data from the shared memory , and then somehow it visualizes the received data.
For obvious reasons, this solution is not applicable in practice. Especially if there is no access to the source text of the classes that we want to debug in this way. Nothing better came up at that time failed, and this topic stalled for several years.
And recently, the idea came to write a simple server that will live in a user process in a separate thread and respond to requests that came from our extension VisualStudio. The server was based on the Microsoft C ++ REST SDK project. This project allowed you to quickly write your http-server, which receives GET requests and returns a description of an instance of a custom class in json-format. Let me remind you that we are interested in a visual representation of instances of the MbSolid class (solids).
In the request to the server, the address of the variable in the address space of the process being debugged is transmitted. Since the server lives in the same process, it can easily access the data at the requested address. The server, having received the address of the class instance, leads this pointer to the type MbSolid * . Next, the server creates an approximation of this body in the form of a polygonal mesh. Serializes the computed vertices and indices of triangles in json and sends the answer. On the VisualStudio side, the extension receives the response, deserializes the data, and draws the resulting polygon mesh in the VisualStudio window.
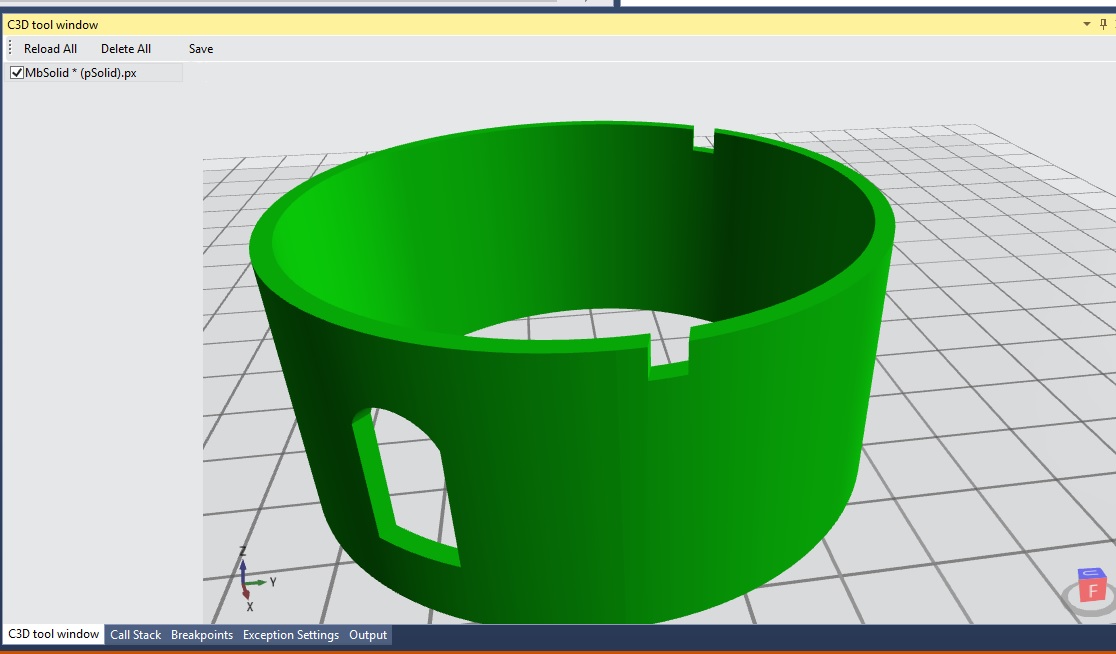
As a result, an extension in VisualStudio does not even need to know the structure of user data; it only needs to know how to send the correct GET requests, deserialize the answer and draw the triangles in the VisualStudio window. The server can be expanded. In this way, you can debug any custom classes that can be represented in the form of a polygonal mesh or a set of straight segments, and the VisualStudio extension will be able to visualize them:
Moreover, in this way you can even send requests to our server from a browser and visualize process data using WebGL.
Made a simple demo. Run our application. Open the example page in the browser, on the page enter the address of the variable, send a request to the server and draw the answer. I do not know why this may be needed, but the thing is cool

Everything is good. But there is one problem. When a breakpoint is triggered, the studio stops all threads of the user process. As a result, our server also stops and cannot respond to requests. To work around this problem, we use the following crutch: the current thread at which the breakpoint was triggered is frozen, and the user process is started. At this moment our server comes to life and the extension sends it a request with the address of the variable of interest. After receiving the response, the execution of the user process is again suspended, and the debugger is set to the initial stream, at which the breakpoint was triggered. For the user, it looks like nothing happened and the program stopped at a breakpoint.
In the VisualStudio extension code, this crutch looks like this. A breakpoint has been triggered. The user requests the data of his variable. At this point, we freeze the current thread and run the debager:
We send request to the server. We get the answer. Stop the process, defrost our stream:
Everything! We received the data from the server and rendered it in the VisualStudio window. Program execution is at the initial breakpoint.
In conclusion, I want to note that while I do not understand the side effects that this approach generates. I would be glad if you share your thoughts in the comments to this article.
What problem will we solve?
We write software in C ++ , in the environment of Visual Studio 2015 . We in the project, naturally, have user data types. As an example of such types I can give the class MbSolid . This class is part of the mathematical core C3D and is an abstraction of a solid body. The body is described by faces, faces by some surfaces, etc. Those. the class structure is quite complicated, and in the process of debugging my own algorithms, I would like to visually estimate what kind of body has turned out at the moment.
Picture from last article. As an example of a custom class, the straight line class is used there.
')
To solve this problem, an extension for VisualStudio was written. There is nothing interesting, links are in the last article. But there was a problem - how in the extension VisualStudio to get data from the address space of the process being debugged (another)?
In the case of simple data types, such as arrays, everything is not so difficult, and Microsoft even prepared an example for std :: vector . In our case, MbSolid has an impressive inheritance hierarchy and a large number of data fields.
Modifying user types
In the last article, an invasive solution was proposed to solve this problem. A marker field is added to each custom class (which we want to visualize during debugging). And in each non-constant class method, code is added to serialize the class data into shared memory . In the marker field, the address is stored in shared memory , where we saved the class data. At the time of debugging, when viewing the contents of a variable of interest to us, the VisualStudio extension finds a marker field and deserializes the data from the shared memory , and then somehow it visualizes the received data.
For obvious reasons, this solution is not applicable in practice. Especially if there is no access to the source text of the classes that we want to debug in this way. Nothing better came up at that time failed, and this topic stalled for several years.
Server in user process
And recently, the idea came to write a simple server that will live in a user process in a separate thread and respond to requests that came from our extension VisualStudio. The server was based on the Microsoft C ++ REST SDK project. This project allowed you to quickly write your http-server, which receives GET requests and returns a description of an instance of a custom class in json-format. Let me remind you that we are interested in a visual representation of instances of the MbSolid class (solids).
In the request to the server, the address of the variable in the address space of the process being debugged is transmitted. Since the server lives in the same process, it can easily access the data at the requested address. The server, having received the address of the class instance, leads this pointer to the type MbSolid * . Next, the server creates an approximation of this body in the form of a polygonal mesh. Serializes the computed vertices and indices of triangles in json and sends the answer. On the VisualStudio side, the extension receives the response, deserializes the data, and draws the resulting polygon mesh in the VisualStudio window.
As a result, an extension in VisualStudio does not even need to know the structure of user data; it only needs to know how to send the correct GET requests, deserialize the answer and draw the triangles in the VisualStudio window. The server can be expanded. In this way, you can debug any custom classes that can be represented in the form of a polygonal mesh or a set of straight segments, and the VisualStudio extension will be able to visualize them:
Moreover, in this way you can even send requests to our server from a browser and visualize process data using WebGL.
Made a simple demo. Run our application. Open the example page in the browser, on the page enter the address of the variable, send a request to the server and draw the answer. I do not know why this may be needed, but the thing is cool
Animate server
Everything is good. But there is one problem. When a breakpoint is triggered, the studio stops all threads of the user process. As a result, our server also stops and cannot respond to requests. To work around this problem, we use the following crutch: the current thread at which the breakpoint was triggered is frozen, and the user process is started. At this moment our server comes to life and the extension sends it a request with the address of the variable of interest. After receiving the response, the execution of the user process is again suspended, and the debugger is set to the initial stream, at which the breakpoint was triggered. For the user, it looks like nothing happened and the program stopped at a breakpoint.
In the VisualStudio extension code, this crutch looks like this. A breakpoint has been triggered. The user requests the data of his variable. At this point, we freeze the current thread and run the debager:
if (dte.Debugger.CurrentMode != EnvDTE.dbgDebugMode.dbgBreakMode) return; currentThread = dte.Debugger.CurrentThread; currentThread.Freeze(); dte.Debugger.Go(false); We send request to the server. We get the answer. Stop the process, defrost our stream:
if (dte.Debugger.CurrentMode == EnvDTE.dbgDebugMode.dbgBreakMode) return; dte.Debugger.Break(); if (currentThread != null) { currentThread.Thaw(); dte.Debugger.CurrentThread = currentThread; } Everything! We received the data from the server and rendered it in the VisualStudio window. Program execution is at the initial breakpoint.
In conclusion, I want to note that while I do not understand the side effects that this approach generates. I would be glad if you share your thoughts in the comments to this article.
Source: https://habr.com/ru/post/344156/
All Articles