Debugging an evil bug in Go runtime

I'm a big fan of Prometheus and Grafana . After working SRE at Google, I learned to appreciate good monitoring and over the past year I preferred to use a combination of these tools. I use them to monitor my personal servers (black-box and white-box monitoring), external and internal events of Euskal Encounter , to monitor client projects and much more. Prometheus makes it very easy to write custom export modules to monitor my own data, and you can also find a suitable module right out of the box. For example, to create a nice panel of available metrics for Encounter events, we use sql_exporter .
Event panel for Euskal Encounter (false staging data)
You can easily node_exporter to any machine and set up an instance of Prometheus to get the basic system metrics (CPU, memory, network, disk, file system, etc.). I thought, why not monitor your laptop this way? I have a “gaming” laptop, Clevo, which I use as the main workstation. He usually stands at home, but sometimes he goes to big events with me like the Chaos Communication Congress. And since I already have a VPN between the laptop and one of my servers running Prometheus, I can simply emerge prometheus-node_exporter , pick up the service and point it to the Prometheus instance. It will automatically configure alerts, and my phone will start breaking when I open too many tabs in Chrome and exhaust all 32 GB of RAM. Wonderful.
Problem on the horizon
About an hour after setting up, my phone reported that the newly added monitoring object was unavailable. Alas, I perfectly connected to the laptop via SSH, so the whole thing was about the node_exporter .
fatal error: unexpected signal during runtime execution [signal SIGSEGV: segmentation violation code=0x1 addr=0xc41ffc7fff pc=0x41439e] goroutine 2395 [running]: runtime.throw(0xae6fb8, 0x2a) /usr/lib64/go/src/runtime/panic.go:605 +0x95 fp=0xc4203e8be8 sp=0xc4203e8bc8 pc=0x42c815 runtime.sigpanic() /usr/lib64/go/src/runtime/signal_unix.go:351 +0x2b8 fp=0xc4203e8c38 sp=0xc4203e8be8 pc=0x443318 runtime.heapBitsSetType(0xc4204b6fc0, 0x30, 0x30, 0xc420304058) /usr/lib64/go/src/runtime/mbitmap.go:1224 +0x26e fp=0xc4203e8c90 sp=0xc4203e8c38 pc=0x41439e runtime.mallocgc(0x30, 0xc420304058, 0x1, 0x1) /usr/lib64/go/src/runtime/malloc.go:741 +0x546 fp=0xc4203e8d38 sp=0xc4203e8c90 pc=0x411876 runtime.newobject(0xa717e0, 0xc42032f430) /usr/lib64/go/src/runtime/malloc.go:840 +0x38 fp=0xc4203e8d68 sp=0xc4203e8d38 pc=0x411d68 github.com/prometheus/node_exporter/vendor/github.com/prometheus/client_golang/prometheus.NewConstMetric(0xc42018e460, 0x2, 0x3ff0000000000000, 0xc42032f430, 0x1, 0x1, 0x10, 0x9f9dc0, 0x8a0601, 0xc42032f430) /var/tmp/portage/net-analyzer/prometheus-node_exporter-0.15.0/work/prometheus-node_exporter-0.15.0/src/github.com/prometheus/node_exporter/vendor/github.com/prometheus/client_golang/prometheus/value.go:165 +0xd0 fp=0xc4203e8dd0 sp=0xc4203e8d68 pc=0x77a980 node_exporter , like many Prometheus components, is written in Go. This is a relatively safe language: it allows you to shoot yourself in the leg if you wish, and its security guarantees are incomparable with Rust, for example, but still it is not so easy to call segfault in Go. In addition, node_exporter is a fairly simple Go application, for the most part using purely pure dependencies. Hence, the case of the fall will be interesting. Especially considering that the drop occurred in mallocgc , which should not fall at all under normal conditions.
After a few restarts, it became even more interesting:
2017/11/07 06:32:49 http: panic serving 172.20.0.1:38504: runtime error: growslice: cap out of range goroutine 41 [running]: net/http.(*conn).serve.func1(0xc4201cdd60) /usr/lib64/go/src/net/http/server.go:1697 +0xd0 panic(0xa24f20, 0xb41190) /usr/lib64/go/src/runtime/panic.go:491 +0x283 fmt.(*buffer).WriteString(...) /usr/lib64/go/src/fmt/print.go:82 fmt.(*fmt).padString(0xc42053a040, 0xc4204e6800, 0xc4204e6850) /usr/lib64/go/src/fmt/format.go:110 +0x110 fmt.(*fmt).fmt_s(0xc42053a040, 0xc4204e6800, 0xc4204e6850) /usr/lib64/go/src/fmt/format.go:328 +0x61 fmt.(*pp).fmtString(0xc42053a000, 0xc4204e6800, 0xc4204e6850, 0xc400000073) /usr/lib64/go/src/fmt/print.go:433 +0x197 fmt.(*pp).printArg(0xc42053a000, 0x9f4700, 0xc42041c290, 0x73) /usr/lib64/go/src/fmt/print.go:664 +0x7b5 fmt.(*pp).doPrintf(0xc42053a000, 0xae7c2d, 0x2c, 0xc420475670, 0x2, 0x2) /usr/lib64/go/src/fmt/print.go:996 +0x15a fmt.Sprintf(0xae7c2d, 0x2c, 0xc420475670, 0x2, 0x2, 0x10, 0x9f4700) /usr/lib64/go/src/fmt/print.go:196 +0x66 fmt.Errorf(0xae7c2d, 0x2c, 0xc420475670, 0x2, 0x2, 0xc420410301, 0xc420410300) /usr/lib64/go/src/fmt/print.go:205 +0x5a So, already interesting. This time Sprintf broke. Shta
runtime: pointer 0xc4203e2fb0 to unallocated span idx=0x1f1 span.base()=0xc4203dc000 span.limit=0xc4203e6000 span.state=3 runtime: found in object at *(0xc420382a80+0x80) object=0xc420382a80 k=0x62101c1 s.base()=0xc420382000 s.limit=0xc420383f80 s.spanclass=42 s.elemsize=384 s.state=_MSpanInUse <snip> fatal error: found bad pointer in Go heap (incorrect use of unsafe or cgo?) runtime stack: runtime.throw(0xaee4fe, 0x3e) /usr/lib64/go/src/runtime/panic.go:605 +0x95 fp=0x7f0f19ffab90 sp=0x7f0f19ffab70 pc=0x42c815 runtime.heapBitsForObject(0xc4203e2fb0, 0xc420382a80, 0x80, 0xc41ffd8a33, 0xc400000000, 0x7f0f400ac560, 0xc420031260, 0x11) /usr/lib64/go/src/runtime/mbitmap.go:425 +0x489 fp=0x7f0f19ffabe8 sp=0x7f0f19ffab90 pc=0x4137c9 runtime.scanobject(0xc420382a80, 0xc420031260) /usr/lib64/go/src/runtime/mgcmark.go:1187 +0x25d fp=0x7f0f19ffac90 sp=0x7f0f19ffabe8 pc=0x41ebed runtime.gcDrain(0xc420031260, 0x5) /usr/lib64/go/src/runtime/mgcmark.go:943 +0x1ea fp=0x7f0f19fface0 sp=0x7f0f19ffac90 pc=0x41e42a runtime.gcBgMarkWorker.func2() /usr/lib64/go/src/runtime/mgc.go:1773 +0x80 fp=0x7f0f19ffad20 sp=0x7f0f19fface0 pc=0x4580b0 runtime.systemstack(0xc420436ab8) /usr/lib64/go/src/runtime/asm_amd64.s:344 +0x79 fp=0x7f0f19ffad28 sp=0x7f0f19ffad20 pc=0x45a469 runtime.mstart() /usr/lib64/go/src/runtime/proc.go:1125 fp=0x7f0f19ffad30 sp=0x7f0f19ffad28 pc=0x430fe0 Now the problems began with the garbage collector. Already another failure.
Here you could make two logical conclusions: either I have a serious problem with the hardware, or in the binary a memory bug. At first, I decided that the first is unlikely, because the laptop was processing very different types of loads at the same time and there were no signs of unstable work that could be associated with the equipment (I had software dropped, but this never happened by chance). Since Go binaries like node_exporter are statically linked and do not depend on any other libraries, I downloaded the official release of the binary and tried to make sure that most of my system was not a variable. But still got a crash:
unexpected fault address 0x0 fatal error: fault [signal SIGSEGV: segmentation violation code=0x80 addr=0x0 pc=0x76b998] goroutine 13 [running]: runtime.throw(0xabfb11, 0x5) /usr/local/go/src/runtime/panic.go:605 +0x95 fp=0xc420060c40 sp=0xc420060c20 pc=0x42c725 runtime.sigpanic() /usr/local/go/src/runtime/signal_unix.go:374 +0x227 fp=0xc420060c90 sp=0xc420060c40 pc=0x443197 github.com/prometheus/node_exporter/vendor/github.com/prometheus/client_model/go.(*LabelPair).GetName(...) /go/src/github.com/prometheus/node_exporter/vendor/github.com/prometheus/client_model/go/metrics.pb.go:85 github.com/prometheus/node_exporter/vendor/github.com/prometheus/client_golang/prometheus.(*Desc).String(0xc4203ae010, 0xaea9d0, 0xc42045c000) /go/src/github.com/prometheus/node_exporter/vendor/github.com/prometheus/client_golang/prometheus/desc.go:179 +0xc8 fp=0xc420060dc8 sp=0xc420060c90 pc=0x76b998 Brand new crash. It looks like a problem with node_exporter or one of its dependencies, so I filled out a bug report on GitHub. Perhaps, developers already faced the similar? It is necessary to attract their attention and listen to what they say.
Not-so-short workaround
It is not surprising that at first they assumed: it is a matter of equipment. It is quite reasonable, because I ran into a problem on only one computer. All the rest of my cars drove fine node_exporter . I had no other evidence of iron failure on this host, or even an explanation of what exactly node_exporter could have caused. Memtest86 + still did not harm anyone, so I decided to use it.
And then it happened:
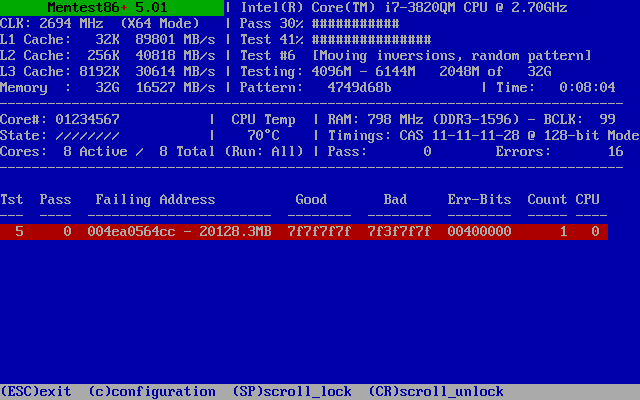
That's what happens when you use consumer goods for serious tasks.
Oops! Broken memory. More precisely, one bit. I drove the test entirely and found this bit and a few false positives in test No. 7 (blocks move in it, which can lead to the reproduction of a single error).
Further testing in Memtest86 + revealed that test No. 5 in SMP mode quickly detects a problem, but usually not on the first pass. The problem always occurred with one bit at the same address. It looks like a weak memory cell, which, when heated, begins to act up. Logically: a rise in temperature increases leakage in memory cells, and the likelihood that some marginal cell will start to fail will increase.
To make it clearer: this is one bad bit of 274,877,906,944. Great value! Hard drives and flash memory have a much higher error rate — in these devices, broken blocks are marked in factories, and during operation, new broken blocks are unnoticed by users and transferred to the backup zone. The RAM has no such mechanisms, so the broken block remains forever.
Alas, this bit is unlikely to result in malfunctions in my node_exporter . The application uses very little memory, so the probability of hitting the bad bit (and time after time) is extremely small. The problem of this bit would manifest itself, in the worst case, leading to a broken pixel in the image, or the loss of one character in the letter, or the failure of any instruction, or a rare segfault, if something bad had to be done on a bad bit. Nevertheless, this means long-term problems with reliability, and therefore servers and other devices for which reliability is important, use ECC RAM - memory with error correction.
I have no such luxury in my laptop. But then I can mark the broken block as bad and tell the OS not to use it. GRUB 2 has a little-known ability to change the memory scheme that is transferred to the loaded OS kernel. You should not buy a new line of memory because of one bad bit (besides, DDR3 is already outdated, and it is likely that the new memory will also be with weak cells).
But I can do something else. As the situation worsens with temperature, what will happen if I heat my memory?


100 ° C
Having set the temperature of the hair dryer to 130 ° C, I warmed up two memory modules (the other two are hiding under the back cover, there are four slots in my laptop). Having played with the order of the modules, I found three more weak bits that were scattered in three modules and only manifested themselves when they were heated.
I also found that the location of the errors remained almost unchanged even when modules were rearranged: the upper bits of the address were the same. The whole thing is in the alternation of RAM: instead of each module assigning a whole quarter of the address space, data is distributed across all four modules. This is convenient, then you can put a mask on the memory area, covering all possible addresses for each bad bit, and not worry that everything is messed up if you swap the modules in places. I found out that if you put a mask on a solid area of 128 KB, then this is enough to close all possible permutations of addresses for every bad bit. But rounded up to 1 MB. It turned out three megabyte equalized blocks for masking (one of them covers two bad bits, and all I wanted to cover four):
0x36a700000 – 0x36a7fffff0x460e00000 – 0x460efffff0x4ea000000 – 0x4ea0fffff
I set the masks in /etc/default/grub using the address masking syntax:
GRUB_BADRAM="0x36a700000,0xfffffffffff00000,0x460e00000,0xfffffffffff00000,0x4ea000000,0xfffffffffff00000" Then he quickly executed grub-mkconfig and turned off 3 MB of memory with four bad bits. Of course, not ECC RAM, and yet the reliability of my Shirpotreb's memory should be higher, because I know that the other cells behave stably when heated to 100 ° C.
As you understand, node_exporter continued to fall, but we knew that this problem was not serious, right?
Digging deeper
In this bug, I was annoyed by the fact that the reason was clearly a memory corruption that crashed the executable code. It is very difficult to debug, because it is impossible to predict what will be damaged (floating problem), and you can not catch a bad code by the hand.
At first, I tried to split the available node_exporter releases in node_exporter and turn on / off different collectors, but this did not give me anything. Tried to run an instance under strace . The falls have stopped, indicating a race condition. Later it turned out that strace instance also falls, but this had to wait much longer. I assumed it was a parallelization. Set GOMAXPROCS=1 so that Go uses only one system thread of execution. The crashes stopped again, so I had arguments for the problem of paralleling.
By that time, I had collected a large number of logs of falls and began to notice some patterns. Although the places and the order of falls changed greatly, but in general, error messages could be divided into three groups, and one of the errors occurred more than once. I climbed into a search engine and came across a problem in Go No. 20427 . It seems that she belonged to another part of Go, but led to the same segfault and random failures. The ticket was closed without analysis, because the situation could not be reproduced in Go 1.9. No one knew what the root of the problem was, it just stopped.
I took the code from the error report that caused the crashes, and I started it. Oh, a miracle, in seconds I got a fall. Got it! So much better than node_exporter hours waiting for the node_exporter to fall.
This did not bring me closer to debugging on the Go side, but it allowed me to test solutions much faster. Let's try the other side
Check on the machines
Crashes occur on my laptop, but not on my other computers. I tried to reproduce the bug on all servers that were easily accessed, and did not encounter a single crash. So, on my laptop there is something special. Go statically links the binaries, so the rest of the user space doesn't matter. There are two candidates left: the hardware or the OS kernel.
Only my computers are accessible to me from hardware, but I can test the kernels. First question: will there be a fall in the virtual machine?
I made a minimal initramfs (initial ram file system) in order to run the crash playback code very quickly in the QEMU virtual machine without installing the distribution or downloading the full version of Linux. My initramfs was built on Linux scripts/gen_initramfs_list.sh and contained the files:
dir /dev 755 0 0 nod /dev/console 0600 0 0 c 5 1 nod /dev/null 0666 0 0 c 1 3 dir /bin 755 0 0 file /bin/busybox busybox 755 0 0 slink /bin/sh busybox 755 0 0 slink /bin/true busybox 755 0 0 file /init init.sh 755 0 0 file /reproducer reproducer 755 0 0 /init is the Linux-initramfs entry point, in my case it was a simple shell script to run the test and measure time:
#!/bin/sh export PATH=/bin start=$(busybox date +%s) echo "Starting test now..." /reproducer ret=$? end=$(busybox date +%s) echo "Test exited with status $ret after $((end-start)) seconds" /bin/busybox is a statically linked version of BusyBox, typically used in minimized systems like mine to provide all the basic Linux shell utilities (including the shell itself).
Initramfs can be done like this (based on the source tree of the Linux kernel), where list.txt is the above list of files:
scripts/gen_initramfs_list.sh -o initramfs.gz list.txt And QEMU can directly load the kernel and initramfs:
qemu-system-x86_64 -kernel /boot/vmlinuz-4.13.9-gentoo -initrd initramfs.gz -append 'console=ttyS0' -smp 8 -nographic -serial mon:stdio -cpu host -enable-kvm Nothing was displayed in the console ... then I realized that I didn’t even compile support for the 8250 serial port in my kernel on my laptop. Damn. He doesn't have a physical serial port, right? Okay, I quickly rebuilt the kernel with the port support (and crossed my fingers, so as not to change anything important), tried again, successfully loaded and launched the reproducing bug code.
Fell down? Yeah. Well, the crash can be played in a virtual machine on the same computer. I tried the same QEMU command on my home server, on its own core, and ... nothing. Then I copied the kernel from the laptop, downloaded and ... crashed. It's all about the core. This is not iron.
Juggling cores
I realized that I would have to compile a lot of cores in order to catch the problem. I decided to do it on my most powerful computer: a rather old 12-core Xeon with 24 threads of execution (it no longer works, unfortunately). I copied the source code of the failed kernel, compiled and tested it.
Did not fall.
What?
Scratched in the head, checked if the original kernel binary falls (fell). Is it really iron? Does it really matter what computer I build the kernel on? I tried to build on the home server, a fall soon happened. If you assemble one core on two machines, then there are drops, and if you assemble on the third, there are no drops. Why is that?
On all three machines, there is a Linux Gentoo with Hardened Gentoo changes. But on a laptop and a home server is ~ amd64 (unstable version), and on a Xeon server - amd64 (stable). That is, the GCC is different. On the laptop and the home server was gcc (Gentoo Hardened 6.4.0 p1.0) 6.4.0, and on Xeon it was gcc (Gentoo Hardened 5.4.0-r3 p1.3, pie-0.6.5) 5.4.0.
But the kernel on the home server, almost the same version as on the laptop, compiled using the same GCC, did not reproduce the crash. It turns out that both compilers used to build the kernel are important, as well as the kernel itself (or its configuration)?
To find out, I compiled on the home server exactly the same kernel tree from my laptop (linux-4.13.9-gentoo), it fell. Therefore I copied .config from the home server and compiled it - it did not fall. So, you need to take into account the difference in configurations and compilers:
linux-4.13.9-gentoo + gcc 5.4.0-r3 p1.3 + laptop .config- does not crash.linux-4.13.9-gentoo + gcc 6.4.0 p1.0 + laptop .config- crashes .linux-4.13.9-gentoo + gcc 6.4.0 p1.0 + server .config- does not crash.
Two configs, one good and one bad. Of course, they were very different (I prefer to include in the configuration of my kernel only those drivers that are needed on a specific computer), so I had to rebuild the kernel one by one, looking for differences.
I decided to start with the “definitely bad” config and began to throw out different things from it. Since the reproducing failure code fell at different intervals, it was easier to test for “still falling” (just waiting for the fall) than “not falling” (how long would you have to wait to confirm the absence of failure?). Over the course of 22 kernel builds, I simplified the configuration so much that the core lost network support, file system, block device foundation, and even PCI support (and continued to work fine in a virtual machine!). My builds now took less than 60 seconds, and the core was about 3/4 less than usual.
Then I went to the “exactly good” configuration and removed all unnecessary junk, checking whether the repro code falls (it was harder and longer than the previous test). I had a few false branches when I changed something (I don’t know what) that destroys the repro code. I mistakenly marked them as “not falling”, and when I ran into crashes, I had to go back to the previously assembled cores and find out when exactly the falls occurred. I collected seven cores.
In the end, I narrowed down the search area to a small number of different options. Some attracted attention, for example CONFIG_OPTIMIZE_INLINING . After careful checking, I made sure that this option was the culprit. If you turn it off, the reproducing code falls, and if you turn it on, there are no failures. Enabling this option allows GCC to determine which inline functions really need to be inline, and not to force it. This explains the connection with GCC: the behavior of the inlining is probably different in different versions of the compiler.
/* * Force always-inline if the user requests it so via the .config, * or if gcc is too old. * GCC does not warn about unused static inline functions for * -Wunused-function. This turns out to avoid the need for complex #ifdef * directives. Suppress the warning in clang as well by using "unused" * function attribute, which is redundant but not harmful for gcc. */ #if !defined(CONFIG_ARCH_SUPPORTS_OPTIMIZED_INLINING) || \ !defined(CONFIG_OPTIMIZE_INLINING) || (__GNUC__ < 4) #define inline inline __attribute__((always_inline,unused)) notrace #define __inline__ __inline__ __attribute__((always_inline,unused)) notrace #define __inline __inline __attribute__((always_inline,unused)) notrace #else /* A lot of inline functions can cause havoc with function tracing */ #define inline inline __attribute__((unused)) notrace #define __inline__ __inline__ __attribute__((unused)) notrace #define __inline __inline __attribute__((unused)) notrace #endif What's next? We know that the CONFIG_OPTIMIZE_INLINING option results in crashes, but it can change the behavior of each inline function in the entire kernel. How to calculate the root of evil?
I have an idea.
Differential Hash Based Compilation
The idea is to compile one part of the kernel with the option turned on, and the other part with the option turned off. After verification, it is possible to understand which subset of kernel computational modules contain the problem code.
. - GCC:
#!/bin/bash args=("$@") doit= while [ $# -gt 0 ]; do case "$1" in -c) doit=1 ;; -o) shift objfile="$1" ;; esac shift done extra= if [ ! -z "$doit" ]; then sha="$(echo -n "$objfile" | sha1sum - | cut -d" " -f1)" echo "${sha:0:8} $objfile" >> objs.txt if [ $((0x${sha:0:8} & (0x80000000 >> $BIT))) = 0 ]; then echo "[n]" "$objfile" 1>&2 else extra=-DCONFIG_OPTIMIZE_INLINING echo "[y]" "$objfile" 1>&2 fi fi exec gcc $extra "${args[@]}" SHA-1, 32 ( $BIT). 0, CONFIG_OPTIMIZE_INLINING . 1, CONFIG_OPTIMIZE_INLINING . , 685 ( ), 10 . : ( 0), , ( ).
32 , SHA-1, 29 . SHA-1, . ( ) , . .
$ grep '^[0246][012389ab][0189][014589cd][028a][012389ab][014589cd]' objs_0.txt 6b9cab4f arch/x86/entry/vdso/vclock_gettime.o vDSO. Well, of course.
vDSO
vDSO . , . vDSO . , .
, vDSO — GCC , . . , : , , ! Go vDSO . Go ( , ) , vDSO Linux- glibc, ( ).
CONFIG_OPTIMIZE_INLINING vDSO? .
CONFIG_OPTIMIZE_INLINING=n :
arch/x86/entry/vdso/vclock_gettime.o.no_inline_opt: file format elf64-x86-64 Disassembly of section .text: 0000000000000000 <vread_tsc>: 0: 55 push %rbp 1: 48 89 e5 mov %rsp,%rbp 4: 90 nop 5: 90 nop 6: 90 nop 7: 0f 31 rdtsc 9: 48 c1 e2 20 shl $0x20,%rdx d: 48 09 d0 or %rdx,%rax 10: 48 8b 15 00 00 00 00 mov 0x0(%rip),%rdx # 17 <vread_tsc+0x17> 17: 48 39 c2 cmp %rax,%rdx 1a: 77 02 ja 1e <vread_tsc+0x1e> 1c: 5d pop %rbp 1d: c3 retq 1e: 48 89 d0 mov %rdx,%rax 21: 5d pop %rbp 22: c3 retq 23: 0f 1f 00 nopl (%rax) 26: 66 2e 0f 1f 84 00 00 nopw %cs:0x0(%rax,%rax,1) 2d: 00 00 00 0000000000000030 <__vdso_clock_gettime>: 30: 55 push %rbp 31: 48 89 e5 mov %rsp,%rbp 34: 48 81 ec 20 10 00 00 sub $0x1020,%rsp 3b: 48 83 0c 24 00 orq $0x0,(%rsp) 40: 48 81 c4 20 10 00 00 add $0x1020,%rsp 47: 4c 8d 0d 00 00 00 00 lea 0x0(%rip),%r9 # 4e <__vdso_clock_gettime+0x1e> 4e: 83 ff 01 cmp $0x1,%edi 51: 74 66 je b9 <__vdso_clock_gettime+0x89> 53: 0f 8e dc 00 00 00 jle 135 <__vdso_clock_gettime+0x105> 59: 83 ff 05 cmp $0x5,%edi 5c: 74 34 je 92 <__vdso_clock_gettime+0x62> 5e: 83 ff 06 cmp $0x6,%edi 61: 0f 85 c2 00 00 00 jne 129 <__vdso_clock_gettime+0xf9> [...] CONFIG_OPTIMIZE_INLINING=y :
arch/x86/entry/vdso/vclock_gettime.o.inline_opt: file format elf64-x86-64 Disassembly of section .text: 0000000000000000 <__vdso_clock_gettime>: 0: 55 push %rbp 1: 4c 8d 0d 00 00 00 00 lea 0x0(%rip),%r9 # 8 <__vdso_clock_gettime+0x8> 8: 83 ff 01 cmp $0x1,%edi b: 48 89 e5 mov %rsp,%rbp e: 74 66 je 76 <__vdso_clock_gettime+0x76> 10: 0f 8e dc 00 00 00 jle f2 <__vdso_clock_gettime+0xf2> 16: 83 ff 05 cmp $0x5,%edi 19: 74 34 je 4f <__vdso_clock_gettime+0x4f> 1b: 83 ff 06 cmp $0x6,%edi 1e: 0f 85 c2 00 00 00 jne e6 <__vdso_clock_gettime+0xe6> [...] , CONFIG_OPTIMIZE_INLINING=y GCC , : vread_tsc , CONFIG_OPTIMIZE_INLINING=n . vread_tsc inline , GCC , .
? What is the problem? …
30: 55 push %rbp 31: 48 89 e5 mov %rsp,%rbp 34: 48 81 ec 20 10 00 00 sub $0x1020,%rsp 3b: 48 83 0c 24 00 orq $0x0,(%rsp) 40: 48 81 c4 20 10 00 00 add $0x1020,%rsp GCC 4 ? , (stack probe), — GCC -fstack-check .
Linux Gentoo Hardened -fstack-check . Stack Clash . -fstack-check — GCC , ( , Stack Clash GCC 8). : , (, ), 4 . , -fstack-check , 4 , -«» ( , ).
Go .
TEXT runtime·walltime(SB),NOSPLIT,$16 // Be careful. We're calling a function with gcc calling convention here. // We're guaranteed 128 bytes on entry, and we've taken 16, and the // call uses another 8. // That leaves 104 for the gettime code to use. Hope that's enough! , 104 . .
, vDSO , Go , .
Conclusion
. — orq , 0. , ( , segfault). vDSO segfaults, Go ? , 0 . orq , . . , orq . , , , . GOMAXPROCS=1 , Go.
')
Source: https://habr.com/ru/post/344080/
All Articles