Dimension vs Illusions
The article is written for both managers and programmers, because The methods described are applicable both for subordinates and for themselves.
First, a brief methodology (not all worked with it), then - the main thing, why use it.
The technique itself has been known for a long time, it does not constitute any secret - this is planning poker from Scrum. To apply it, you do not need to apply the entire Scrum.
The measurement algorithm is simple, like a Kalashnikov machine gun. Each task you are going to solve should receive a score in points - numbers from the Fibonacci series. These numbers are: 1, 2, 3, 5, 8, 13, 21, 34, etc. Each digit is the sum of the two previous ones (one element of the series is omitted, for obvious reasons). Some guys call numbers not points, but story points (story points). Here, as you like, it's closer and easier for me to say "points."
')
The Fibonacci series is chosen by the Scrum developers because the neighboring estimates are quite far apart, and allow us to more accurately identify the difference in the complexity of the tasks. It’s one thing to choose between grades 7 and 8, quite another between 5 and 8.
If you have a team, then it is desirable that all its members evaluate. You make out of paper or buy cards for planning poker - these are just pieces of paper on which numbers from a number are written. Get together, each puts his assessment on the task - puts the card face up. Turning around, look - if there are assessments that are farther apart from each other than one element of the series (for example, 3 and 8) - you discuss the problem again, because Someone did not understand something. Or overestimated the complexity, because does not know the details or mechanisms of implementation, or underestimated, for the same reason. Repeat assessment.
As soon as we managed to achieve the correct difference in the estimates - not more than one element of the series - consider the average, this will be the assessment of the problem.
If you do not have a team, or they do not want to develop with you, put your own estimates. In this case, you do not need maps.
So that the estimates do not float upwards or downwards, think up an anchor for yourself. The easiest anchor is to decide that there is a task for 1 point. This is the bit of your work, the simplest thing you have to do. For example, add an input field. You can come up with not one, but several anchors, if it's easier for you.
There are no rules here. The main thing is that the rating system does not float away, otherwise it will not be a measurement, but an illusion. In this sense, it is easier when there is a command, because several people usually follow the coordinate system more carefully than one.
Of course, the system of accounting estimates must be automated. It is very simple - it’s enough for the object of the system that contains tasks in you to attach a numeric field and fill it in.
If you conduct your tasks in GitHub, then you can use labels. It is enough to add a series of numbers to the tags, and assign a suitable tag to each task, and then collect the estimates through the API. I myself conduct tasks in GitHub and collect evaluation from there with a simple script.
It is also worth noting that in your system the task must have a due date, otherwise it will be difficult to analyze the effectiveness. What is the date of implementation - you know better on the spot. This may be the date of the mark by the performer, the date of acceptance by the customer, the date of verification by the tester - which is closer to you.
Personally, the contractor’s date is closer to me + condition that the task is accepted by the customer, because several days can pass from execution to acceptance, and if we take the date of acceptance, the tasks will not fall in the period when they are completed. To know the period when the task is completed is important - it will become clear from the further presentation.
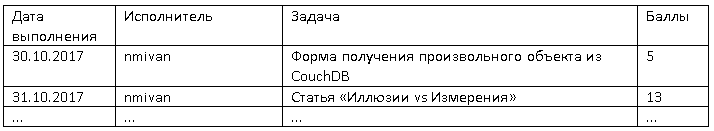
At the output, the measurement system should give us the following label:
In reports, dates are best grouped by different periods to see the dynamics. I have a weekly sprint, so usually I look at the weeks. But sometimes for months to make the picture more complete.
Let's talk a little about how to look at it.
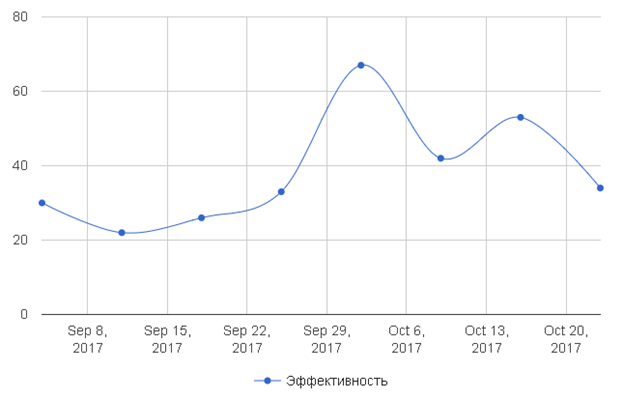
Personally, my closest graphics. For example, this is how my performance graph looks, drawn through Google Charts in flowcon:
The diagram immediately shows the trends, the dynamics are clear, it is easy to visually compare two points in height.
It is also useful to display on the chart not the amount of points per week, but points per person a day - it is enough to divide the amount of points by the number of days that the person worked. This is in case people work on different schedules, or, for example, take a day without maintenance, or stick out for a long time at meetings. But more important, of course, is the amount of work done for the entire period.
It is extremely important that the schedule be viewed during the week, and the points of completed tasks immediately appear on it - what is called a “Chart of combustion of tasks” in Scrum. This is the main controlling tool during the week, allowing you to see current performance and take timely measures to improve it.
Now let's talk about how management of oneself and a team without measurements looks, i.e. about illusions.
You have measurements, or you have no measurements — you still have some idea of the effectiveness of the work, your team and your team.
One of the methods used consciously and unconsciously is a flash-durilka. It is done very simply - it is necessary to give out Something at the end of the reporting period, and it is something that will be remembered as the main result of the period.
For example, a programmer is stupid all week, gives out nothing, picks his nose, and on Friday gives a “decision” on the mountain. As a leader, you see this decision at the end of the week, and the whole week is remembered in its context. If you ask after 1, 2 or 3 weeks how the programmer worked in such and such a period, you will recall this decision issued “on the mountain” - a flash-durilka.
The tool flash-fool has several names, one of the most common is IBD, an imitation of vigorous activity, which is used by almost all employees, especially large enterprises. You yourself will find a lot of examples in the life of your enterprise.
For example, I saw a company that made a strategic development plan for each quarter. All heads of services and departments got some projects designed to raise the enterprise to a new level. It was obvious that no one remembered this plan until the end of the quarter, and in the end a seething began. Everyone chose the simplest tasks from his plan, and tried to give something up to the strategic session, even if it was a semi-finished product. The goal is to have something to show at a strategic session at the end of the quarter. Let one of the 10 projects be made - the quarter will be remembered as successful (or at least not a failure).
This technique is constantly used in the state government of villages, like our Chelyabinsk. We have big environmental problems in the city - sometimes it is simply impossible to breathe from emissions. Guess when in our city is clean, beautiful and the air, like in the mountains of the Caucasus? When the president or prime minister arrives. This is a flash-fool for them. The last date is November 9th, some forum was held. We waited with impatience, we were able to run for a beer without a gas mask. What did the guests of Chelyabinsk remember about the visit? The city is clean, there are no stalls with shawarma, the air is beautiful, the exhaust gases are a little faint — well, where can it go without it, a million-plus city. The simplest measurement system - the percentage of days when it is impossible to breathe - would kill the ability to show flash duryls.
What is important - flash-durilki work not only for others, but also for themselves. It is even easier to deceive yourself than others - you do agree with yourself faster and easier than with your boss. You can just sit for a week, picking on the Internet, to give out Something on Friday, and to remember this period as successful.
The most paradoxical option is a virtual flash-frill, applied both to himself and to his superiors. This is when you give out Something at the end of a period, and supplement with the promise that everything will be even better. "I agree, I understand that I can do better and more, but look at what I gave out on Friday, I now realized how to work better, and next week everything will change for the better, I now understand , and my dynamics are excellent."
The traditional system for measuring the work of programmers and not only is time management. In our language, the completed task or project has a calculated parameter - “completed on time”. You understand that this parameter is of type Boolean.
And on these Boolean controls are built. The source data table looks like this:
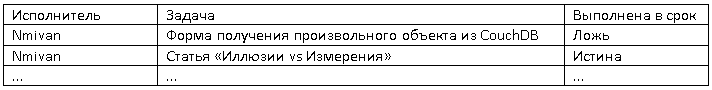
For each specific task, boolean has some kind of physical meaning. To evaluate the work for the period, you need a more complex function. It is necessary to add a virtual column “Number of tasks”, put the formula there, which will give one in the task completed on time, and zero for the task not completed.
Some kind of digital assessment will turn out - how many tasks for the period were completed on time, or the percentage of tasks completed on time.
Is it possible to manage yourself and the team, knowing only such a figure? Of course, most people do this. A few years ago, I myself believed that this was necessary, and even built a task management system for all employees of an enterprise on such a system. I still feel ashamed.
Reality has shown me that control over a Boolean number is pointless. The efficiency curve very quickly becomes smooth, and ceases to give at least some useful information for corrective actions, because it answers only one question - whether a person is on time.
The answer to the question “Does a person work effectively?” Does not give a boolean figure. She says - “the person completed all the tasks on time”. Next week he repeats - “the person completed all the tasks on time”. Etc.
I ask, “did the person work better at what week?”, Or “did this person work better or worse?”. The Boolean number responds - “I don’t know, I found something to ask. Both completed all tasks on time. ” I say - "Siri is a boolean figure, are you a fool?". “Actually, it’s very disappointing,” the mindless machine responds.
The nastiest thing is that such an approach to measurement kills the motivation to increase efficiency, both for the boss and for the subordinate. Efficiency is not at all in the formula. One goal - to complete the deadline, do Boolean = Truth.
The easiest options to achieve Boolean = Truth:
• Take on less tasks;
• Press time longer;
• Require TK, prototyping, a million approvals;
• Create time transfer algorithms when requirements and resources change;
• Dilute the bureaucracy wherever possible;
• Add unnecessary steps to solve the problem, in which you can dissolve the increase in time (for example, testing the whole row);
• Etc.
The difference between Boolean and Tsifra was invented, tested and demonstrated by the Japanese in their quality management systems.
The meaning is simple. Japanese measure a detail, receiving figure - for example, diameter of a shaft of 26.34 mm. From this figure, they build a smart quality management system (the results drive on the roads). The base of the entire quality management system in Japan is numbers. Cleverly, this is called a "quantitative attribute of quality."
Our brothers from the automotive industry do not measure the details, they use the so-called. caliber - iron pieces with two sizes, the minimum and maximum. The detail into the caliber either passes or does not pass - i.e. we have the same Boolean. In an intelligent way, this is called an "alternative sign of quality."
The Japanese and for alternative signs came up with a control system, because also use them. For example, “the appearance of the part meets the requirements” is difficult to measure in numbers. But these are auxiliary signs, but the basis is a figure.
You must have seen a lot of managers who are engaged in only one thing - management. And they are busy with this business constantly, all day, even after work they linger.
The reason is often simple - they are hooked on Booleo, but life demands more. Managers have to compensate for the shortcomings of the measurement system with their direct participation and personal presence.
This is especially true of healthy, adequate, but stuck in the past managers. They subconsciously understand that something is missing, something is missing in the system of assessment and management. Their common sense and responsibility say - they demand real results from you, and not a combination of flags and reports.
And how to understand that the work goes well, if you only have a Boolean? Tools are known and widely used:
• Hold meetings;
• Approach and ask how are you;
• Personally verify results and process;
• Require progress reports (usually as text);
• Prepare and maintain schedules;
• Etc.
This kind of work takes up all the free time of the manager, and it has become so common for everyone that you wonder. You can estimate for yourself how much money is spent on such management in companies.
It’s even pitiful to have such healthy managers, because unhealthy managers who understand the rules of the game are bureaucrats nearby.
Bureaucrats know that it is not necessary to produce useful results - it is enough that the Boolean is equal to Truth. And sometimes you need to do flash-durku.
You can observe the conflicts and relationships between healthy and unhealthy managers in your own company. This is very entertaining, though sad, because the unhealthy are usually more successful in their careers.
As mentioned above, without numbers there is no concept of efficiency. Once there is no concept of efficiency, there will be no development.
Development is an increase in efficiency, one way or another. Efficiency, in the classics - is the cost of producing the result.
If you are a programmer and you get paid a salary, then the cost to you is constant. So, to increase efficiency, it is necessary to increase the result.
Although in life, of course, the salary is usually reduced - it's not just about programmers. Misunderstanding of the development of efficiency through an increase in the useful result, i.e. KPD, leads to the fact that the first measure of increase in efficiency, we always consider a reduction in wages. This is very sad, and this is a consequence of the victory of illusions.
But let's not talk about sad things, back to development. It's very simple - as long as you do not measure the amount of the result produced for a period, you do not know anything about your effectiveness.
Further even easier. If you do not know your effectiveness, then you do not know its dynamics - it grows or falls.
Well, quite simply - if you do not know the effectiveness and its dynamics, then you can not do anything with it. You will not come up with measures to improve efficiency, you will not follow the events and the context, to understand their impact on efficiency, etc.
The most disgusting is not that you can not , but that you will not . Even try.
And your team will not try, because it is also a captive of illusions.
If we reject illusions and start measuring, then work on efficiency will become real.
The topic is extensive and deep, and usually - strictly individual. I will definitely tell you everything I know about improving efficiency in subsequent articles. While I will tell one universal reception.
It was not I who invented the method, but the same Japanese (from whom, by the way, the author Scrum took a lot of useful things and did not hesitate to talk about it).
The method is simple - to record all changes and significant events occurring with the process, and mark them on the performance graph. The Japanese draw such things on their control cards.
Here is a graph of my performance with superimposed events:
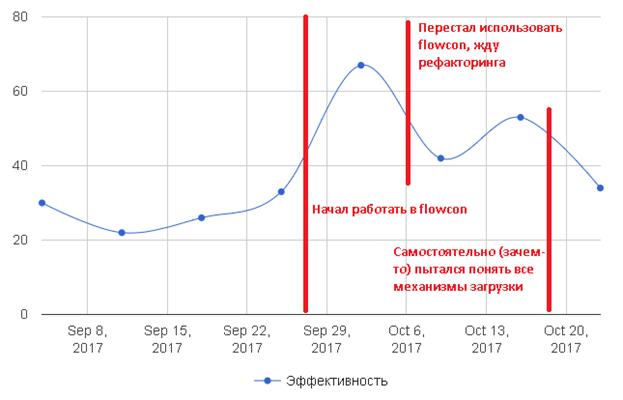
What are the markers talking about? Getting started at flowcon, in essence, means that I will show off my performance. I used to keep her a secret. What is the conclusion? For me personally, it is useful for someone to see my effectiveness - it spurs me on.
The second marker proves it. While refactoring was going on, I looked at the effectiveness of my old, hidden from the public, tool - and it went down.
The third marker says that I have violated one of my rules - not to dig into large mechanisms alone, especially if I need to solve a small problem. I dug in for three days, and by the results I made a task for 8 points. It seems to be okay, I rummaged - it means I figured it out, next time I will solve the problem faster. But for me personally, this is not effective - I know that I will forget all this in a month, and the tasks of this mechanism occur every six months, because everything is already written and debugged.
But the chart with the markers of my Padawan (he learns programming):
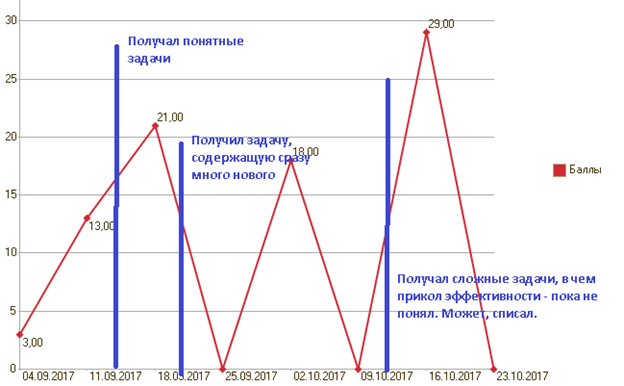
The first marker told me that when I give him tasks for already known mechanisms, he solves them well and quickly. So we fix the material.
The second marker says that if the Padawan is given a big task, containing not one, but several new mechanisms at once, then a bottleneck appears. He, roughly speaking, masters one new mechanism in 3 hours, two new mechanisms in 8 hours, three new mechanisms in 16 hours, etc., the dependence is non-linear. On the second marker, I gave a task containing more than 5 new mechanisms, and the Padawan could not solve this problem in a week. What is the conclusion specifically for this Padawan - do not drop it with a large amount of knowledge in one sitting.
The third marker, I still do not understand, it happened a week ago. The tasks were complex, new mechanisms, serious algorithms (for his level), but he gave the highest efficiency in history. I will analyze. Perhaps there was some kind of elation, not at all related to work.
Events on the diagrams are necessary and important, if only because if they are not recorded, they will be forgotten. Understanding the reasons for both growth and failure in efficiency is the essence of improvement management. You make a change to the work, mark this event on the chart, and see the result in numbers. If the result has worsened or remained in place - the change does not make sense, or it needs to be finalized. If the result has improved - the change must be fixed, made part of the process.
If the process has changed for the better without making changes - it is necessary to understand the reason, to see the changes that occurred without your participation, and to make them part of the system. It is possible that someone from your team quietly improved something, and waits for you to notice and praise, and you miss this. Well, in the end, it may turn out that the main impairment of efficiency is yourself with your foolish changes. Then the best change will be to stop the change, at least for a while, and the system will adjust itself. Exactly in this mode, I am now, after the third Padawan marker.
Start with yourself (if you want, of course).
Nobody forbids you to measure your effectiveness and work to improve it. Working in silence, without telling anyone, you will quickly achieve a result, because you don’t need to explain and prove anything to anyone.
Just evaluate the tasks that you solve, in points, and keep statistics. Mark the changes you have made to the environment. Analyze the reasons for the growth and fall in efficiency.
Well, or make sure that it is not yours, and so is normal for you.
It is possible, even likely, that your leadership does not ask for it, does not wait, and will not understand. But working on your own efficiency is personally your product, product. You can sell it to your employer, or you can leave it your secret. This is not the last your employer.
In my practice, it happened all the time that the management somehow somewhere learned about what is written in this article - the need to measure results and improve efficiency. At such moments my silent system of measuring my own efficiency came in handy. For example, it was when management read Scrum and remembered that programmers had a board with stickers. There was an excellent occasion to talk, which turned into a leap along the career ladder.
But the main thing, of course, is its own efficiency and ability to manage it. Nobody takes that.
First, a brief methodology (not all worked with it), then - the main thing, why use it.
Measurement Method
The technique itself has been known for a long time, it does not constitute any secret - this is planning poker from Scrum. To apply it, you do not need to apply the entire Scrum.
The measurement algorithm is simple, like a Kalashnikov machine gun. Each task you are going to solve should receive a score in points - numbers from the Fibonacci series. These numbers are: 1, 2, 3, 5, 8, 13, 21, 34, etc. Each digit is the sum of the two previous ones (one element of the series is omitted, for obvious reasons). Some guys call numbers not points, but story points (story points). Here, as you like, it's closer and easier for me to say "points."
')
The Fibonacci series is chosen by the Scrum developers because the neighboring estimates are quite far apart, and allow us to more accurately identify the difference in the complexity of the tasks. It’s one thing to choose between grades 7 and 8, quite another between 5 and 8.
If you have a team, then it is desirable that all its members evaluate. You make out of paper or buy cards for planning poker - these are just pieces of paper on which numbers from a number are written. Get together, each puts his assessment on the task - puts the card face up. Turning around, look - if there are assessments that are farther apart from each other than one element of the series (for example, 3 and 8) - you discuss the problem again, because Someone did not understand something. Or overestimated the complexity, because does not know the details or mechanisms of implementation, or underestimated, for the same reason. Repeat assessment.
As soon as we managed to achieve the correct difference in the estimates - not more than one element of the series - consider the average, this will be the assessment of the problem.
If you do not have a team, or they do not want to develop with you, put your own estimates. In this case, you do not need maps.
So that the estimates do not float upwards or downwards, think up an anchor for yourself. The easiest anchor is to decide that there is a task for 1 point. This is the bit of your work, the simplest thing you have to do. For example, add an input field. You can come up with not one, but several anchors, if it's easier for you.
There are no rules here. The main thing is that the rating system does not float away, otherwise it will not be a measurement, but an illusion. In this sense, it is easier when there is a command, because several people usually follow the coordinate system more carefully than one.
Of course, the system of accounting estimates must be automated. It is very simple - it’s enough for the object of the system that contains tasks in you to attach a numeric field and fill it in.
If you conduct your tasks in GitHub, then you can use labels. It is enough to add a series of numbers to the tags, and assign a suitable tag to each task, and then collect the estimates through the API. I myself conduct tasks in GitHub and collect evaluation from there with a simple script.
It is also worth noting that in your system the task must have a due date, otherwise it will be difficult to analyze the effectiveness. What is the date of implementation - you know better on the spot. This may be the date of the mark by the performer, the date of acceptance by the customer, the date of verification by the tester - which is closer to you.
Personally, the contractor’s date is closer to me + condition that the task is accepted by the customer, because several days can pass from execution to acceptance, and if we take the date of acceptance, the tasks will not fall in the period when they are completed. To know the period when the task is completed is important - it will become clear from the further presentation.
At the output, the measurement system should give us the following label:
In reports, dates are best grouped by different periods to see the dynamics. I have a weekly sprint, so usually I look at the weeks. But sometimes for months to make the picture more complete.
Let's talk a little about how to look at it.
How to watch results
Personally, my closest graphics. For example, this is how my performance graph looks, drawn through Google Charts in flowcon:
The diagram immediately shows the trends, the dynamics are clear, it is easy to visually compare two points in height.
It is also useful to display on the chart not the amount of points per week, but points per person a day - it is enough to divide the amount of points by the number of days that the person worked. This is in case people work on different schedules, or, for example, take a day without maintenance, or stick out for a long time at meetings. But more important, of course, is the amount of work done for the entire period.
It is extremely important that the schedule be viewed during the week, and the points of completed tasks immediately appear on it - what is called a “Chart of combustion of tasks” in Scrum. This is the main controlling tool during the week, allowing you to see current performance and take timely measures to improve it.
Now let's talk about how management of oneself and a team without measurements looks, i.e. about illusions.
Flash durilka
You have measurements, or you have no measurements — you still have some idea of the effectiveness of the work, your team and your team.
One of the methods used consciously and unconsciously is a flash-durilka. It is done very simply - it is necessary to give out Something at the end of the reporting period, and it is something that will be remembered as the main result of the period.
For example, a programmer is stupid all week, gives out nothing, picks his nose, and on Friday gives a “decision” on the mountain. As a leader, you see this decision at the end of the week, and the whole week is remembered in its context. If you ask after 1, 2 or 3 weeks how the programmer worked in such and such a period, you will recall this decision issued “on the mountain” - a flash-durilka.
The tool flash-fool has several names, one of the most common is IBD, an imitation of vigorous activity, which is used by almost all employees, especially large enterprises. You yourself will find a lot of examples in the life of your enterprise.
For example, I saw a company that made a strategic development plan for each quarter. All heads of services and departments got some projects designed to raise the enterprise to a new level. It was obvious that no one remembered this plan until the end of the quarter, and in the end a seething began. Everyone chose the simplest tasks from his plan, and tried to give something up to the strategic session, even if it was a semi-finished product. The goal is to have something to show at a strategic session at the end of the quarter. Let one of the 10 projects be made - the quarter will be remembered as successful (or at least not a failure).
This technique is constantly used in the state government of villages, like our Chelyabinsk. We have big environmental problems in the city - sometimes it is simply impossible to breathe from emissions. Guess when in our city is clean, beautiful and the air, like in the mountains of the Caucasus? When the president or prime minister arrives. This is a flash-fool for them. The last date is November 9th, some forum was held. We waited with impatience, we were able to run for a beer without a gas mask. What did the guests of Chelyabinsk remember about the visit? The city is clean, there are no stalls with shawarma, the air is beautiful, the exhaust gases are a little faint — well, where can it go without it, a million-plus city. The simplest measurement system - the percentage of days when it is impossible to breathe - would kill the ability to show flash duryls.
What is important - flash-durilki work not only for others, but also for themselves. It is even easier to deceive yourself than others - you do agree with yourself faster and easier than with your boss. You can just sit for a week, picking on the Internet, to give out Something on Friday, and to remember this period as successful.
The most paradoxical option is a virtual flash-frill, applied both to himself and to his superiors. This is when you give out Something at the end of a period, and supplement with the promise that everything will be even better. "I agree, I understand that I can do better and more, but look at what I gave out on Friday, I now realized how to work better, and next week everything will change for the better, I now understand , and my dynamics are excellent."
Boolean vs Number
The traditional system for measuring the work of programmers and not only is time management. In our language, the completed task or project has a calculated parameter - “completed on time”. You understand that this parameter is of type Boolean.
And on these Boolean controls are built. The source data table looks like this:
For each specific task, boolean has some kind of physical meaning. To evaluate the work for the period, you need a more complex function. It is necessary to add a virtual column “Number of tasks”, put the formula there, which will give one in the task completed on time, and zero for the task not completed.
Some kind of digital assessment will turn out - how many tasks for the period were completed on time, or the percentage of tasks completed on time.
Is it possible to manage yourself and the team, knowing only such a figure? Of course, most people do this. A few years ago, I myself believed that this was necessary, and even built a task management system for all employees of an enterprise on such a system. I still feel ashamed.
Reality has shown me that control over a Boolean number is pointless. The efficiency curve very quickly becomes smooth, and ceases to give at least some useful information for corrective actions, because it answers only one question - whether a person is on time.
The answer to the question “Does a person work effectively?” Does not give a boolean figure. She says - “the person completed all the tasks on time”. Next week he repeats - “the person completed all the tasks on time”. Etc.
I ask, “did the person work better at what week?”, Or “did this person work better or worse?”. The Boolean number responds - “I don’t know, I found something to ask. Both completed all tasks on time. ” I say - "
The nastiest thing is that such an approach to measurement kills the motivation to increase efficiency, both for the boss and for the subordinate. Efficiency is not at all in the formula. One goal - to complete the deadline, do Boolean = Truth.
The easiest options to achieve Boolean = Truth:
• Take on less tasks;
• Press time longer;
• Require TK, prototyping, a million approvals;
• Create time transfer algorithms when requirements and resources change;
• Dilute the bureaucracy wherever possible;
• Add unnecessary steps to solve the problem, in which you can dissolve the increase in time (for example, testing the whole row);
• Etc.
The difference between Boolean and Tsifra was invented, tested and demonstrated by the Japanese in their quality management systems.
The meaning is simple. Japanese measure a detail, receiving figure - for example, diameter of a shaft of 26.34 mm. From this figure, they build a smart quality management system (the results drive on the roads). The base of the entire quality management system in Japan is numbers. Cleverly, this is called a "quantitative attribute of quality."
Our brothers from the automotive industry do not measure the details, they use the so-called. caliber - iron pieces with two sizes, the minimum and maximum. The detail into the caliber either passes or does not pass - i.e. we have the same Boolean. In an intelligent way, this is called an "alternative sign of quality."
The Japanese and for alternative signs came up with a control system, because also use them. For example, “the appearance of the part meets the requirements” is difficult to measure in numbers. But these are auxiliary signs, but the basis is a figure.
The impact of Boolean management
You must have seen a lot of managers who are engaged in only one thing - management. And they are busy with this business constantly, all day, even after work they linger.
The reason is often simple - they are hooked on Booleo, but life demands more. Managers have to compensate for the shortcomings of the measurement system with their direct participation and personal presence.
This is especially true of healthy, adequate, but stuck in the past managers. They subconsciously understand that something is missing, something is missing in the system of assessment and management. Their common sense and responsibility say - they demand real results from you, and not a combination of flags and reports.
And how to understand that the work goes well, if you only have a Boolean? Tools are known and widely used:
• Hold meetings;
• Approach and ask how are you;
• Personally verify results and process;
• Require progress reports (usually as text);
• Prepare and maintain schedules;
• Etc.
This kind of work takes up all the free time of the manager, and it has become so common for everyone that you wonder. You can estimate for yourself how much money is spent on such management in companies.
It’s even pitiful to have such healthy managers, because unhealthy managers who understand the rules of the game are bureaucrats nearby.
Bureaucrats know that it is not necessary to produce useful results - it is enough that the Boolean is equal to Truth. And sometimes you need to do flash-durku.
You can observe the conflicts and relationships between healthy and unhealthy managers in your own company. This is very entertaining, though sad, because the unhealthy are usually more successful in their careers.
Development on numbers
As mentioned above, without numbers there is no concept of efficiency. Once there is no concept of efficiency, there will be no development.
Development is an increase in efficiency, one way or another. Efficiency, in the classics - is the cost of producing the result.
If you are a programmer and you get paid a salary, then the cost to you is constant. So, to increase efficiency, it is necessary to increase the result.
Although in life, of course, the salary is usually reduced - it's not just about programmers. Misunderstanding of the development of efficiency through an increase in the useful result, i.e. KPD, leads to the fact that the first measure of increase in efficiency, we always consider a reduction in wages. This is very sad, and this is a consequence of the victory of illusions.
But let's not talk about sad things, back to development. It's very simple - as long as you do not measure the amount of the result produced for a period, you do not know anything about your effectiveness.
Further even easier. If you do not know your effectiveness, then you do not know its dynamics - it grows or falls.
Well, quite simply - if you do not know the effectiveness and its dynamics, then you can not do anything with it. You will not come up with measures to improve efficiency, you will not follow the events and the context, to understand their impact on efficiency, etc.
The most disgusting is not that you can not , but that you will not . Even try.
And your team will not try, because it is also a captive of illusions.
If we reject illusions and start measuring, then work on efficiency will become real.
Work on efficiency
The topic is extensive and deep, and usually - strictly individual. I will definitely tell you everything I know about improving efficiency in subsequent articles. While I will tell one universal reception.
It was not I who invented the method, but the same Japanese (from whom, by the way, the author Scrum took a lot of useful things and did not hesitate to talk about it).
The method is simple - to record all changes and significant events occurring with the process, and mark them on the performance graph. The Japanese draw such things on their control cards.
Here is a graph of my performance with superimposed events:
What are the markers talking about? Getting started at flowcon, in essence, means that I will show off my performance. I used to keep her a secret. What is the conclusion? For me personally, it is useful for someone to see my effectiveness - it spurs me on.
The second marker proves it. While refactoring was going on, I looked at the effectiveness of my old, hidden from the public, tool - and it went down.
The third marker says that I have violated one of my rules - not to dig into large mechanisms alone, especially if I need to solve a small problem. I dug in for three days, and by the results I made a task for 8 points. It seems to be okay, I rummaged - it means I figured it out, next time I will solve the problem faster. But for me personally, this is not effective - I know that I will forget all this in a month, and the tasks of this mechanism occur every six months, because everything is already written and debugged.
But the chart with the markers of my Padawan (he learns programming):
The first marker told me that when I give him tasks for already known mechanisms, he solves them well and quickly. So we fix the material.
The second marker says that if the Padawan is given a big task, containing not one, but several new mechanisms at once, then a bottleneck appears. He, roughly speaking, masters one new mechanism in 3 hours, two new mechanisms in 8 hours, three new mechanisms in 16 hours, etc., the dependence is non-linear. On the second marker, I gave a task containing more than 5 new mechanisms, and the Padawan could not solve this problem in a week. What is the conclusion specifically for this Padawan - do not drop it with a large amount of knowledge in one sitting.
The third marker, I still do not understand, it happened a week ago. The tasks were complex, new mechanisms, serious algorithms (for his level), but he gave the highest efficiency in history. I will analyze. Perhaps there was some kind of elation, not at all related to work.
Events on the diagrams are necessary and important, if only because if they are not recorded, they will be forgotten. Understanding the reasons for both growth and failure in efficiency is the essence of improvement management. You make a change to the work, mark this event on the chart, and see the result in numbers. If the result has worsened or remained in place - the change does not make sense, or it needs to be finalized. If the result has improved - the change must be fixed, made part of the process.
If the process has changed for the better without making changes - it is necessary to understand the reason, to see the changes that occurred without your participation, and to make them part of the system. It is possible that someone from your team quietly improved something, and waits for you to notice and praise, and you miss this. Well, in the end, it may turn out that the main impairment of efficiency is yourself with your foolish changes. Then the best change will be to stop the change, at least for a while, and the system will adjust itself. Exactly in this mode, I am now, after the third Padawan marker.
Where to begin
Start with yourself (if you want, of course).
Nobody forbids you to measure your effectiveness and work to improve it. Working in silence, without telling anyone, you will quickly achieve a result, because you don’t need to explain and prove anything to anyone.
Just evaluate the tasks that you solve, in points, and keep statistics. Mark the changes you have made to the environment. Analyze the reasons for the growth and fall in efficiency.
Well, or make sure that it is not yours, and so is normal for you.
It is possible, even likely, that your leadership does not ask for it, does not wait, and will not understand. But working on your own efficiency is personally your product, product. You can sell it to your employer, or you can leave it your secret. This is not the last your employer.
In my practice, it happened all the time that the management somehow somewhere learned about what is written in this article - the need to measure results and improve efficiency. At such moments my silent system of measuring my own efficiency came in handy. For example, it was when management read Scrum and remembered that programmers had a board with stickers. There was an excellent occasion to talk, which turned into a leap along the career ladder.
But the main thing, of course, is its own efficiency and ability to manage it. Nobody takes that.
Source: https://habr.com/ru/post/343910/
All Articles