Performance analysis of React 16 applications using Chrome developer tools
React is one of the leading front-end frameworks, not only because Facebook is behind it, but also because of its high performance. Virtual DOM React is known for efficiently rendering components. But what if these components suddenly become not so fast? Where to look? How to fix it?
In this article, using the example of a real React-application, new powerful tools for monitoring code performance using the Chrome developer tools will be shown. These tools can be used by any React developer to find problems in slow components.

In order to reproduce what we are going to talk about, you will need the following:
')
To get started, you'll need plenty of work space, so open the Chrome developer tools in a separate window and maximize this window as much as your monitor screen allows.

Customize Chrome Developer Tools
When performing performance tests, it is important to strive for modeling the real conditions in which the application will run. Not everyone has $ 3000 computers or the latest phone models.
Fortunately, Chrome developers have taken care of such testing scenarios, there is an opportunity to slow down the execution of JavaScript. This will make the performance problems more obvious. In addition, if you manage to make the code fast on a slow (or specially slow) device, this code will fly on a regular computer.

Artificial slowdown performance
If you slow down the modern MacBook, at least 4 times, its performance will be comparable to the Motorola Moto G4.
When React 16 is in development mode, it generates for each component the
In order to create a performance profile, go to the page you want to try (on the local host) and click on the
This will start recording performance information for the current page. Chrome will automatically stop recording data after the page has completely loaded and displayed on the screen.

Start profiling
After the performance data is written, you will see something resembling the following figure.

Profiling results
Here, from left to right, you can see what happens to the page during the loading and initialization process.
Spend some time reviewing information about the performance profile, the meaning of which may not be obvious to those who are faced with performance analysis for the first time in Chrome. In the figure, what we are going to talk about is marked with numbers 1 and 2.
Today we will focus on what's called
Application Performance Profile Analysis
Let's open the window, open the
Now we are going to study the area where there is a red stripe described above. We can see that elements are displayed on the page at this time.
Zoom in on the desired area. See the badges?
When zooming in, the information from the
Below the
Having decided on the component that we will investigate, let's search for slow functions. In the figure below you can see the Chrome developer tools window with numbered steps, the contents of which we will now describe.
Search for slow features
Switch to source code
The code, the execution of which takes the most time, is marked by the corresponding indicator on the left (perhaps this is not my best code, which should be put on public display). Now that you know exactly where the problem lies, you can fix it.
Using this approach over the last couple of weeks, I accelerated the execution of code areas for a second, which I thought about: “No, it’s difficult, probably, to improve anything here, it will take a lot of time” Now I know exactly how and where to look for problems with JavaScript performance and I am sure that in the future I will write better code.
React publishes metrics through the
So, Chrome doesn’t have React debugging tools built in, but support for the generic API that React uses. In addition, all major browsers support the
As for the speed of the applications, there are no trifles - every fraction of a second is important here. We hope this material has helped you improve your research skills and optimize application performance.
Dear readers! How do you analyze web application performance?
In this article, using the example of a real React-application, new powerful tools for monitoring code performance using the Chrome developer tools will be shown. These tools can be used by any React developer to find problems in slow components.
Prerequisites
In order to reproduce what we are going to talk about, you will need the following:
')
- React 16 application running in development mode.
- Code maps generated during project export (optional, but highly recommended).
- Developer Tools Google Chrome or Chromium (they are in all current releases).
Tool setting
To get started, you'll need plenty of work space, so open the Chrome developer tools in a separate window and maximize this window as much as your monitor screen allows.
Customize Chrome Developer Tools
When performing performance tests, it is important to strive for modeling the real conditions in which the application will run. Not everyone has $ 3000 computers or the latest phone models.
Fortunately, Chrome developers have taken care of such testing scenarios, there is an opportunity to slow down the execution of JavaScript. This will make the performance problems more obvious. In addition, if you manage to make the code fast on a slow (or specially slow) device, this code will fly on a regular computer.
Artificial slowdown performance
If you slow down the modern MacBook, at least 4 times, its performance will be comparable to the Motorola Moto G4.
Performance analysis
When React 16 is in development mode, it generates for each component the
mark and measure events that are part of the User Timing API .In order to create a performance profile, go to the page you want to try (on the local host) and click on the
Start profiling and reload page button in the developer tools.This will start recording performance information for the current page. Chrome will automatically stop recording data after the page has completely loaded and displayed on the screen.
Start profiling
After the performance data is written, you will see something resembling the following figure.
Profiling results
Here, from left to right, you can see what happens to the page during the loading and initialization process.
Spend some time reviewing information about the performance profile, the meaning of which may not be obvious to those who are faced with performance analysis for the first time in Chrome. In the figure, what we are going to talk about is marked with numbers 1 and 2.
- The indicator in the form of a red bar shows that in this place on the time scale there is a serious load on the processor (performing long tasks). Perhaps this is exactly what slows down the application, and what we need to explore in more detail.
- The colors used in the diagram at the top of the window correspond to the different activities. The drop in productivity during the performance of various types of activities has its own reasons, there are special ways to fix various problems and means of analyzing them.
Today we will focus on what's called
Scripting — here Scripting — that is, on the performance of JavaScript.Application Performance Profile Analysis
Let's open the window, open the
User Timing group and use the opportunity to view screenshots of the page taken during its loading in order to explore how the page is displayed.Now we are going to study the area where there is a red stripe described above. We can see that elements are displayed on the page at this time.
Zoom in on the desired area. See the badges?
When zooming in, the information from the
User Timing section and the component labeled Pulse (the one that takes 500 ms to output) is displayed.Below the
Pulse component, you can notice information about the rendering of child components, but the size of the corresponding elements indicates that they do not create a special load on the system.Search for slow features
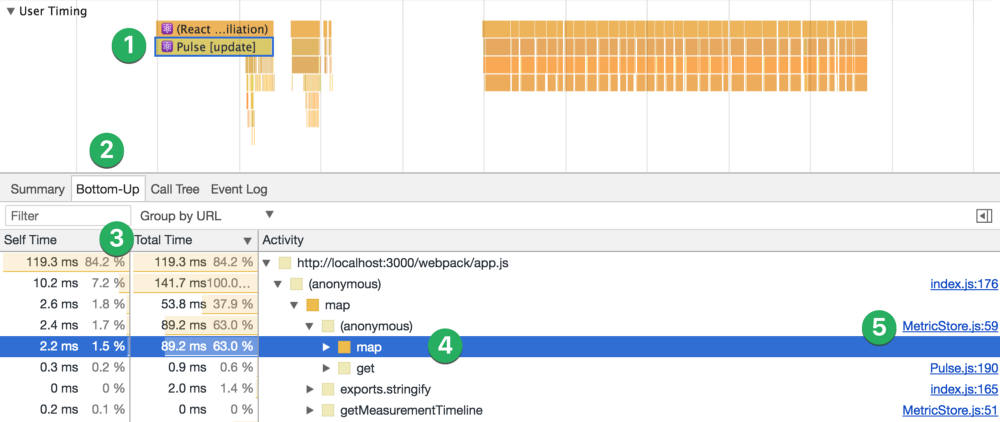
Having decided on the component that we will investigate, let's search for slow functions. In the figure below you can see the Chrome developer tools window with numbered steps, the contents of which we will now describe.
Search for slow features
- Click on the component you want to explore, in this case
Pulse. Due to this, only actions from this component will be displayed at the bottom of the window. - Select the
Bottom-Uptab. - Sort the list in descending order by
Total Time. In some cases, it may be useful to sort bySelf Time, or group by something different from the URL. What exactly is suitable in your case, you will understand in the process. - Click the arrow icons until you find a piece of code that you want to explore in more detail. In this case, the
mapcall looks suspicious. It runs many times and takes almost 90 ms. - But why do we need code cards? Clicking on
MetricStore.js:59allows you to see the corresponding section of the application source code. Take a look at it.
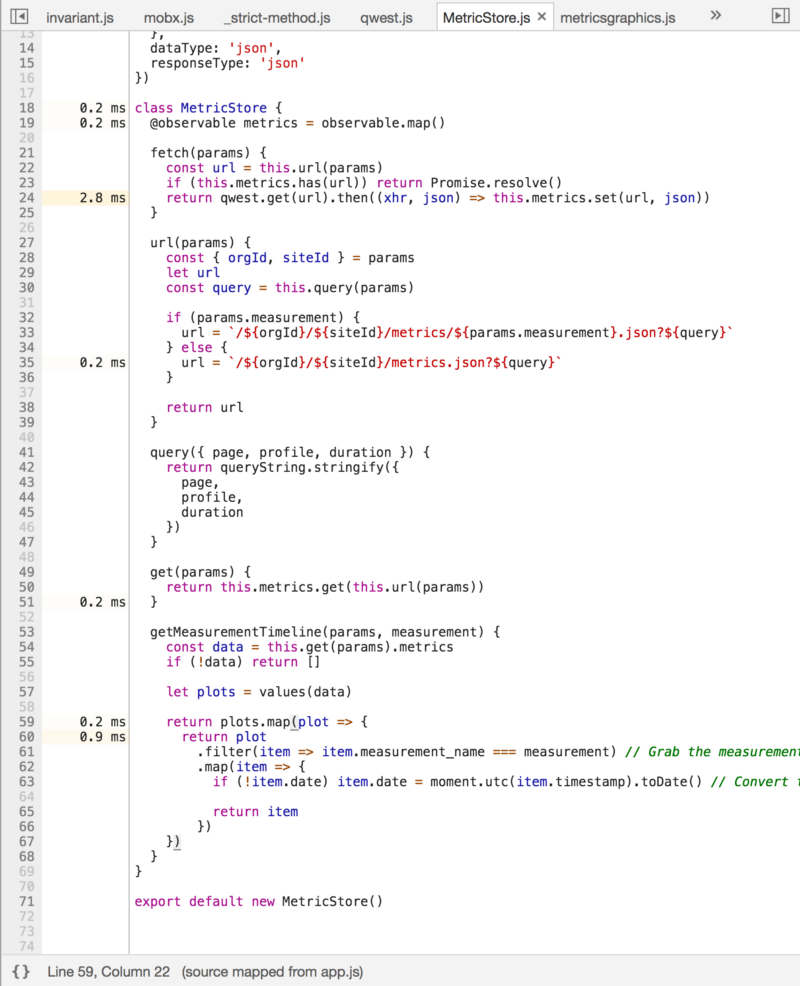
Switch to source code
The code, the execution of which takes the most time, is marked by the corresponding indicator on the left (perhaps this is not my best code, which should be put on public display). Now that you know exactly where the problem lies, you can fix it.
Using this approach over the last couple of weeks, I accelerated the execution of code areas for a second, which I thought about: “No, it’s difficult, probably, to improve anything here, it will take a lot of time” Now I know exactly how and where to look for problems with JavaScript performance and I am sure that in the future I will write better code.
Why are debugging tools for React applications built into Chrome?
React publishes metrics through the
User Timing API , which you can use to place time markers in your own code. This allows, for example, to find out how long it takes to initialize a component, or how long after a certain event the user clicks the Buy button. Here is a good material about User Timing API .So, Chrome doesn’t have React debugging tools built in, but support for the generic API that React uses. In addition, all major browsers support the
User Timing API , but the Performance tab of the Chrome developer tools went much further than others, which made debugging React applications in Chrome much easier.Results
As for the speed of the applications, there are no trifles - every fraction of a second is important here. We hope this material has helped you improve your research skills and optimize application performance.
Dear readers! How do you analyze web application performance?
Source: https://habr.com/ru/post/343888/
All Articles