Regression tests for memory leaks, or how to write a memory profiler for .NET applications
As a rule, memory profilers begin to use when the application is already guaranteed to “flow,” users actively send emails that are dazzling with task manager screenshots and need to spend a lot of time profiling and searching for the cause. Finally, when developers find and fix a leak, release a new beautiful version of the application, devoid of the same drawbacks, there is a risk that after some time the leak will return, because the application is growing, and developers may also make mistakes.
Automated regression error testing has long been the mainstream of high-quality software development. Such tests help to prevent errors from reaching the user, as well as to quickly figure out what change in the code led to an error, thereby minimizing the time it was fixed.
Why don't we take the same approach to memory leaks?

We asked this question, once again receiving an OutOfMemoryException during the passage of regression autotests on x86 agents.
A few words about our product: we are developing Pilot-ICE - an engineering data management system. The application is written in .NET / WPF, and for regression testing we use the Winium.Cruciatus framework, based on UIAutomation. Tests "click" through the UI all the available functionality of the application, checking the logic of work.
The idea of implementing tests for memory leaks is as follows: at certain points in the passing of tests, connect to an application and check the number of instances of objects of certain types in memory.
Analysis of existing solutions
We looked at most of the popular .NET memory profilers, and they all save snapshots of memory in a proprietary format that can be opened for analysis only in the appropriate browser. No opportunity was found for automated snapshots analysis in any of them.
The dotMemory Unit stands apart - a free unit testing framework that allows you to analyze memory leaks in tests. Unfortunately, in it, memory analysis is limited to the process that runs the tests. Connect to an external process using the dotMemory Unit at the moment is not possible.
We write your profiler
So, not finding a suitable ready-made solution, it was decided to write my own memory profiler. What he should be able to do:
- Call garbage collection in the application
- Get the number of objects of a given type in the application's memory
- Analyze what keeps these objects from being collected by the GC (Garbage Collector).
At the same time, I wanted to make it so that I did not have to modify the application under test.
Garbage collection
As you know, the GC.Collect () method, which starts garbage collection in all generations, can be used to call garbage collection in a .NET application. This method is not recommended for use in production code, and memory profiling is almost the only adequate scenario for its use. Garbage collection prior to profiling is needed to eliminate the false positives of the profiler on unreachable objects, which GC just could not reach.
The difficulty is that garbage collection must be started in an external process, and there are several possible solutions for this:
- Connect to the debugger API process and trigger garbage collection
- Get involved in the process and start garbage collection from there.
- Via ETW (Event Tracing for Windows) with the GCHeapCollect command
We chose the second path as the easiest to implement. Managed Injector was borrowed from the Snoop for WPF project. It allows specifying the path with the assembly, class and method in it to load this assembly into the external application domain and run the specified method. In our case, after the introduction of the process, the named pipe server is started, which, upon a command from the client (profiler), starts the garbage collection process.
Application memory analysis
To analyze the application's memory, we used the CLR MD library, which provides an API similar to the SOS debug extension in WinDbg. With it, you can connect to the process, bypass all the objects in the heaps, get a list of root links (GC root) and objects dependent on them. By and large, everything that we need is already implemented, we just need to take advantage of it all.
This is how you can get the number of objects of a certain type in memory using CLR MD:
public int CountObjects(int pid, string type) { using (var dataTarget = DataTarget.AttachToProcess(pid, msecTimeout: 5000)) { var runtime = dataTarget.ClrVersions.First().CreateRuntime(); return runtime.Heap.EnumerateObjects().Count(o => o.Type.Name == type); } } The most difficult, but quite solvable moment is getting information about what keeps the object from being collected by the garbage collector. To do this, it is necessary to bypass all dependency trees of root links, remembering along the detour path.
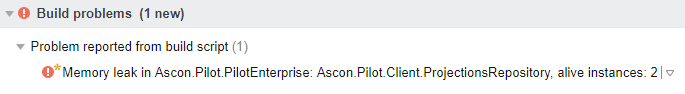
Continuous integration
Next, we embedded all the developments in the regression test code. Information about the names of periodically flowing types and the maximum number of instances of this type that can be in memory was added to the tests. The verification algorithm is as follows: after the end of the test, garbage collection is first started, then the analysis of the number of objects of the types of interest is launched, if their number is greater than the reference, the problem is reported and the build is marked as “fallen”. In addition, diagnostic information is collected that keeps these objects from garbage collection and is added to build artifacts. Here is how it looks for TeamCity:
Sharing is caring. Meet Ascon.NetMemoryProfiler
The resulting decision came out pretty general, and we decided to share it with the community. The project code can be found in the repository on github , besides, the solution in a ready-for-use form is available in the form of a nuget package called Ascon.NetMemoryProfiler. Distributed under the Apache 2.0 license.
Below is an example of using the API. Minimalistic, but describing almost all the functionality provided:
// MyApp // , using (var session = Profiler.AttachToProcess("MyApp")) { // "MyApp.Foo" var objects = session.GetAliveObjects(x => x.Type == "MyApp.Foo"); // , var retentions = session.FindRetentions(objects); } Consider the example of a simple application, how to write a test for memory leaks. Let's make a test project, add the Ascon.NetMemoryProfiler package to it.
Install-Package Ascon.NetMemoryProfiler
We write the basis for the test:
[TestFixture] public class MemoryLeakTests { [Test] public void MemoryLeakTest() { using (var session = Profiler.AttachToProcess("LeakingApp")) { var objects = session.GetAliveObjects(x => x.Type.EndsWith("LeakingObjectTypeName")); if (objects.Any()) { var retentions = session.FindRetentions(objects); Assert.Fail(DumpRetentions(retentions)); } } } private static string DumpRetentions(IEnumerable<RetentionsInfo> retentions) { StringBuilder sb = new StringBuilder(); foreach (var group in retentions.GroupBy(x => x.Instance.TypeName)) { var instances = group.ToList(); sb.AppendLine($"Found {instances.Count} instances of {group.Key}"); for (int i = 0; i < instances.Count; i++) { var instance = instances[i]; sb.AppendLine($"Instance {i + 1}:"); foreach (var retentionPath in instance.RetentionPaths) { sb.AppendLine(retentionPath); sb.AppendLine("----------------------------"); } } } return sb.ToString(); } } Let's create a new WPF application, and add several windows and a view-model to it, into which we will intentionally implement different variants of memory leaks:
EventHandler leak
Perhaps the most common type of memory leak. The object that owns the event after the subscription begins to keep a strict reference to the subscriber, thereby preventing the garbage collector from removing the subscriber for the entire lifetime of the object that owns the event. Example:
public class EventHandlerLeakViewModel : INotifyPropertyChanged { public EventHandlerLeakViewModel() { Dispatcher.CurrentDispatcher.ShutdownStarted += OnShutdownStarted; } private void OnShutdownStarted(object sender, EventArgs e) { } //... } In this case, the lifetime of the Dispatcher.CurrentDispatcher coincides with the lifetime of the application, and the EventHandlerLeakViewModel will not be released even after the associated window is closed.
Check it out. We start the application, open the window, close it, run the test, having previously specified the process name and the type name for the search in it. We get the result:
Found 1 instances of LeakingApp.EventHandlerLeakViewModel
Instance 1:
static var System.Windows.Application._appInstance
LeakingApp.App
MS.Win32.HwndWrapper
System.Windows.Threading.Dispatcher
System.EventHandler
You can fix a leak by unsubscribing from an event in time (for example, when closing a window), or by using weak events (weak events).
WPF binding leak
A rather unobvious way to get a memory leak in a WPF application. If the target binding object is not DependencyObject and does not support the INotifyPropertyChanged interface, then this object will live in memory forever. Example:
<Grid d:DataContext="{d:DesignInstance local:BindingLeakViewModel}"> <TextBlock Text="{Binding Title}" TextWrapping="Wrap" Margin="5"/> </Grid> public class BindingLeakViewModel { public BindingLeakViewModel() { Title = "Hello world."; } public string Title { get; set; } } Run the test. We get the following result:
Found 1 instances of LeakingApp.BindingLeakViewModel
Instance 1:
static var System.ComponentModel.ReflectTypeDescriptionProvider._propertyCache
System.Collections.Hashtable
System.Collections.Hashtable + bucket []
System.ComponentModel.PropertyDescriptor []
System.ComponentModel.ReflectPropertyDescriptor
System.Collections.Hashtable
System.Collections.Hashtable + bucket []
To eliminate such a leak, you must support the INotifyPropertyChanged interface from the BindingLeakViewModel class, or define the binding as a one-time (OneTime).
WPF collection binding leak
When linking to a collection that does not support the INotifyCollectionChanged interface, the collection will never be compiled by the GC. Example:
<ItemsControl ItemsSource="{Binding Items}" d:DataContext="{d:DesignInstance local:CollectionLeakViewModel}"> <ItemsControl.ItemTemplate> <DataTemplate DataType="local:MyCollectionItem"> <TextBlock Text="{Binding Title}"/> </DataTemplate> </ItemsControl.ItemTemplate> </ItemsControl> public class CollectionLeakViewModel : INotifyPropertyChanged { public List<object> Items { get; } public CollectionLeakViewModel() { Items = new List<object>(); Items.Add(new MyCollectionItem { Title = "Item 1" }); } // ... } public class MyCollectionItem : INotifyPropertyChanged { public string Title { get; set; } // ... } We will correct the test so that it searches for instances of the MyCollectionItem type, and run it.
Found 1 instances of LeakingApp.MyCollectionItem
Instance 1:
static var System.Windows.Data.CollectionViewSource.DefaultSource
System.Windows.Data.CollectionViewSource
System.Windows.Threading.Dispatcher
System.Windows.Input.InputManager
System.Collections.Hashtable
System.Collections.Hashtable + bucket []
System.Windows.Input.InputProviderSite
MS.Internal.SecurityCriticalDataClass <System.Windows.Input.IInputProvider>
System.Windows.Interop.HwndStylusInputProvider
MS.Internal.SecurityCriticalDataClass <System.Windows.Input.StylusWisp.WispLogic>
System.Windows.Input.StylusWisp.WispLogic
System.Collections.Generic.Dictionary <System.Object, System.Windows.Input.PenContexts>
System.Collections.Generic.Dictionary + Entry <System.Object, System.Windows.Input.PenContexts> []
System.Windows.Input.PenContexts
System.Windows.Interop.HwndSource
LeakingApp.CollectionLeakView
System.Windows.Controls.Border
System.Windows.Documents.AdornerDecorator
System.Windows.Controls.ContentPresenter
System.Windows.Controls.StackPanel
System.Windows.Controls.UIElementCollection
System.Windows.Media.VisualCollection
System.Windows.Media.Visual []
System.Windows.Controls.ItemsControl
System.Windows.Controls.StackPanel
System.Windows.Controls.ItemContainerGenerator
System.Windows.Controls.ItemCollection
System.Windows.Data.ListCollectionView
You can fix a leak by using an ObservableCollection instead of a List.
Conclusion
You can write regression tests for leaks in a .NET application, and it’s not even difficult at all, especially if you already have automated tests that work with a real application.
Link to repository and nuget package .
Download, use in your .NET projects to monitor memory leaks. We will welcome suggestions and suggestions.
')
Source: https://habr.com/ru/post/343684/
All Articles