Cost of operations in CPU cycles
All good! So we got to the subject of C ++ in our courses and, according to our good old tradition, we share what we found quite interesting when preparing the program and what we will touch upon during the training.
Infographics:
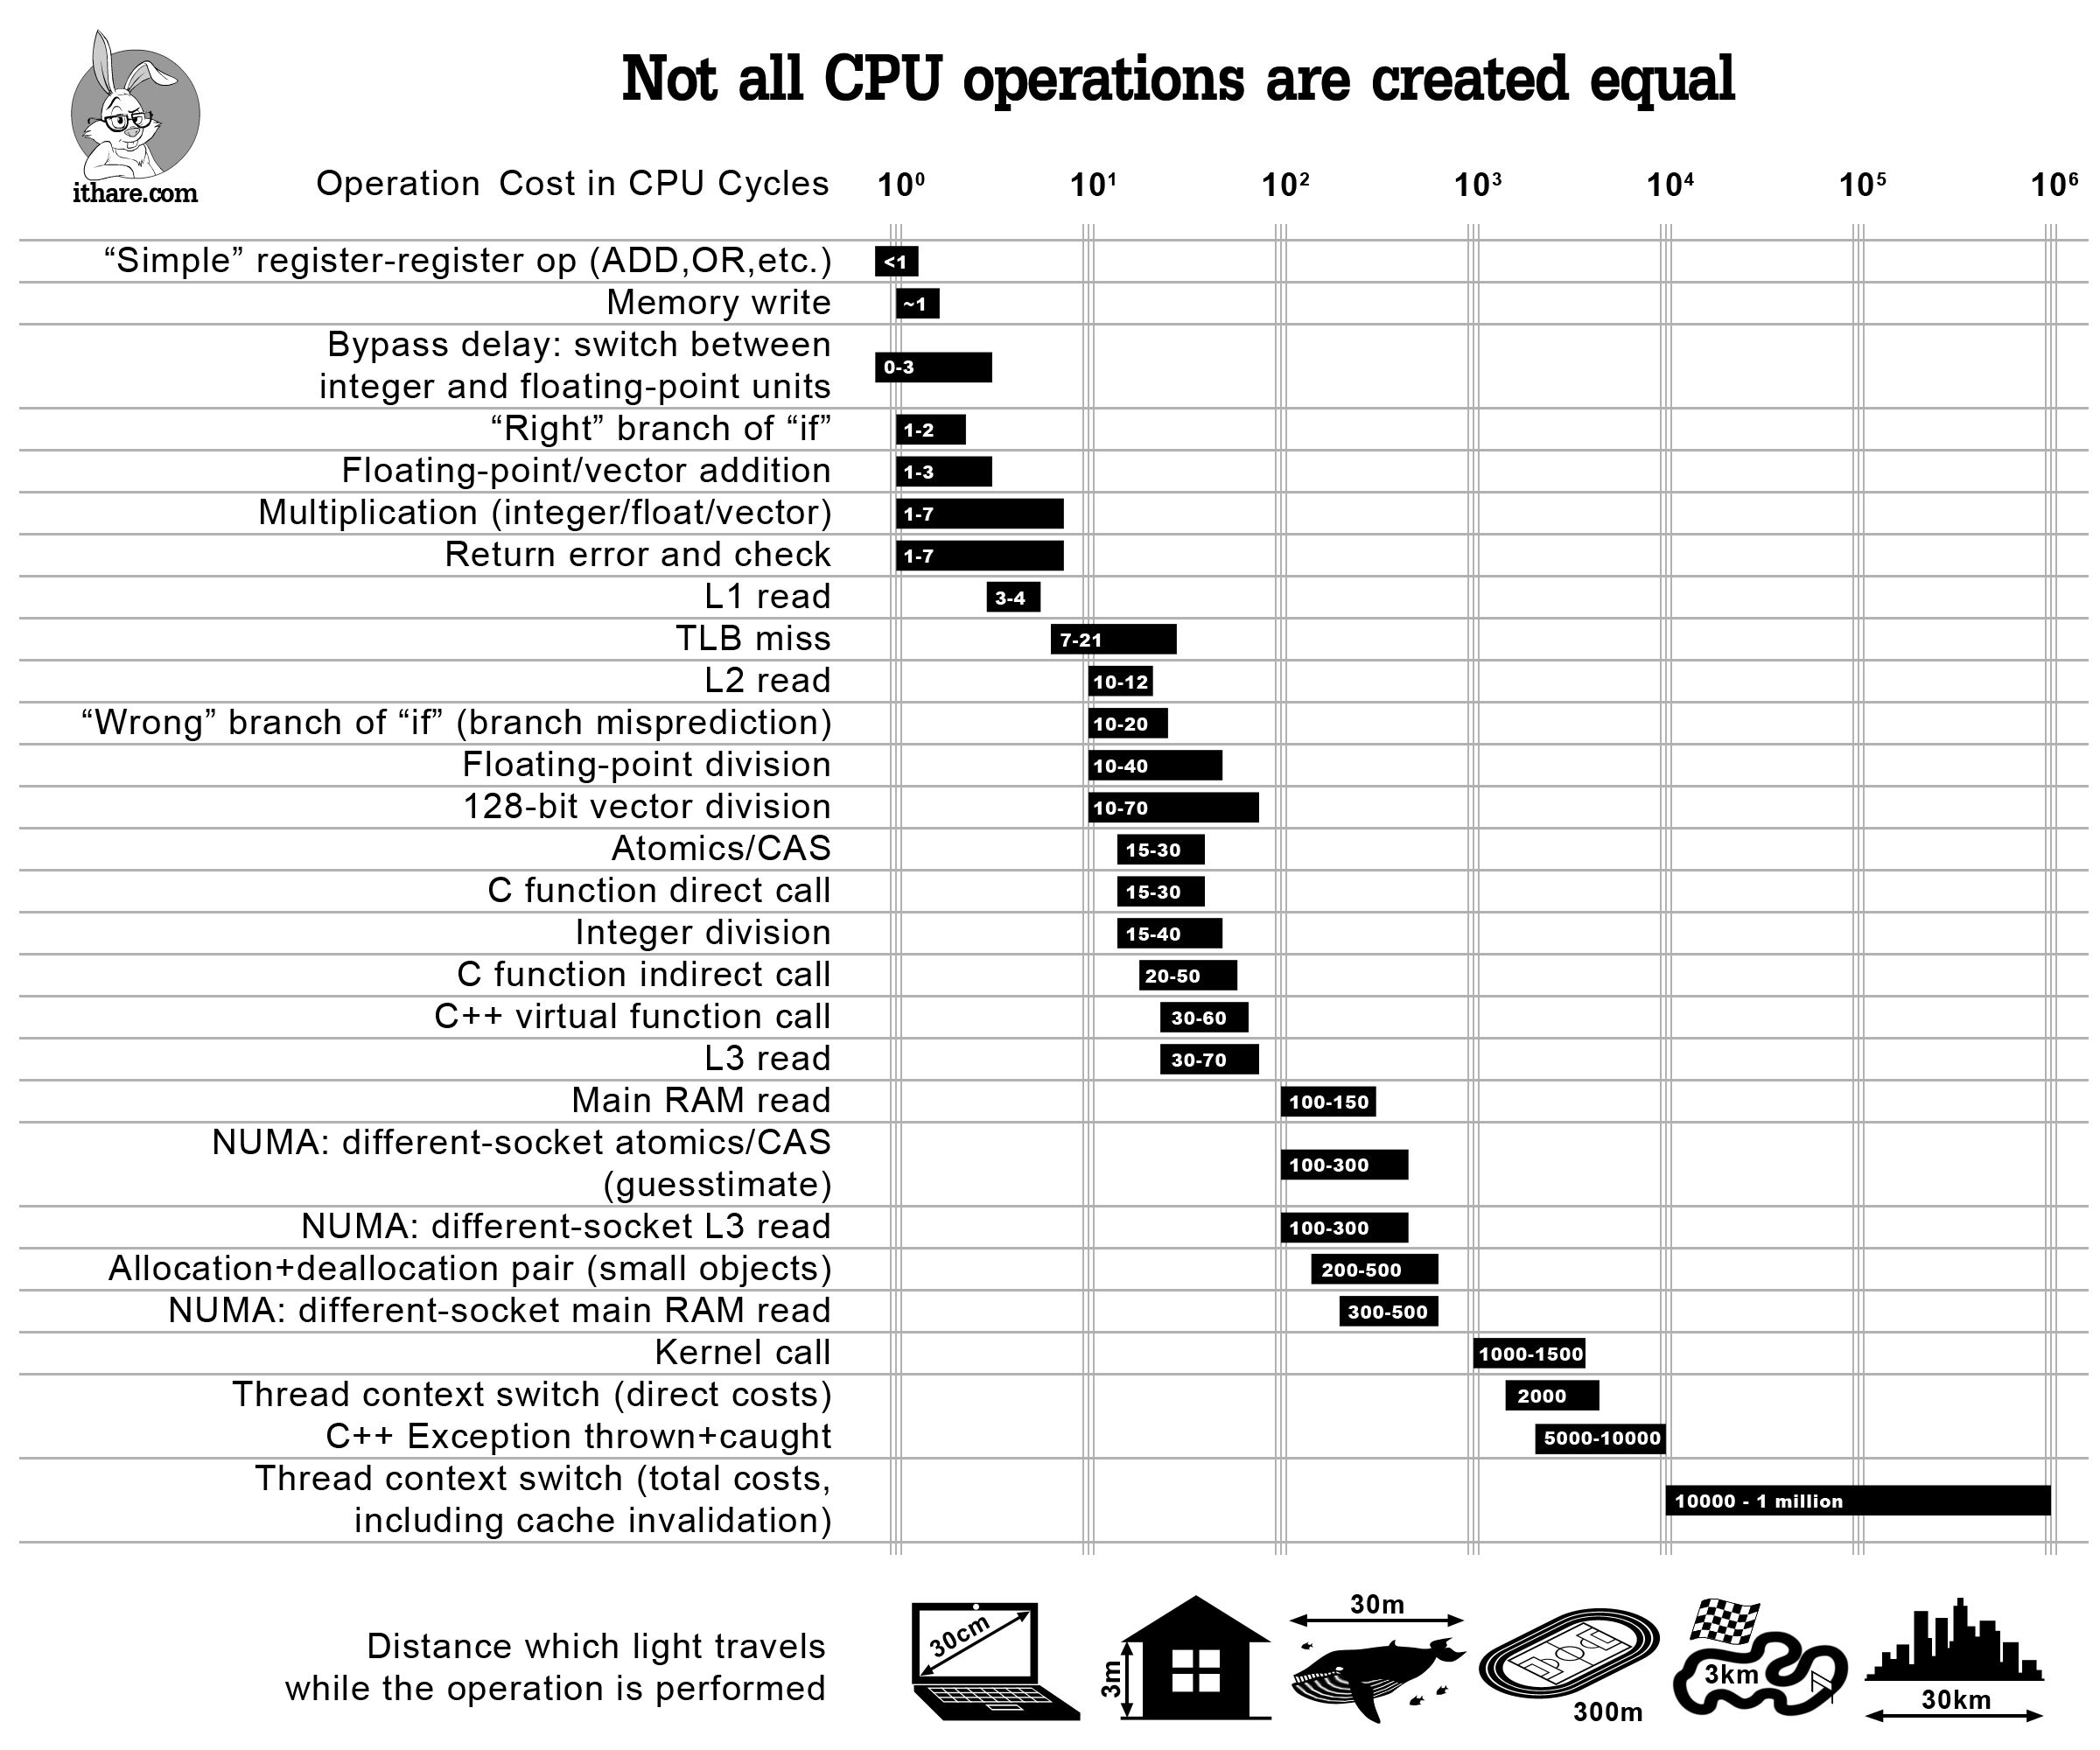
')
When we need to optimize the code, we need to profile it and simplify it. However, sometimes it makes sense to simply find out the approximate cost of some popular operations in order not to do inefficient things from the very beginning (and, I hope, not to profile the program later).
So, here it is - infographics, which should help evaluate the cost of specific operations in CPU cycles - and answer questions such as “hey, how much does an L2 read operation usually cost?”. Although the answers to all these questions are more or less known, I don’t know a single place where they are all listed and presented in perspective. Also note that, although the listed costs, strictly speaking, apply only to modern x86 / x64 processors, it is expected that a similar ratio of costs will be observed on other modern processors with large multi-level caches (such as ARM Cortex A or SPARC); on the other hand, MCUs (including ARM Cortex M) are quite different, so that some of the patterns might not apply to them.
And last but not least, a caution: all assessments here only indicate order; however, given the scale of the differences between the various operations, these indications can still be used (at least, one should remember that “premature pessimization” should be avoided).
On the other hand, I am still confident that such a diagram is useful in order not to say “hey, virtual function calls cost nothing” - which may or may not be true depending on how often you call them. Instead, using the infographic above, you can see that if you call your virtual function 100K once a second on a processor with a frequency of 3 GHz - it probably will not cost you more than 0.2% of the total volume of your processor; however, if you call the same virtual function 10M once a second, this can easily mean that virtualization absorbs two-digit percentages of your processor core.
Another way to approach the same question is to say “hey, I call the virtual function once per piece of code that is 10,000 cycles, so virtualization will not consume more than 1% of the program time”, but you still need some way see the order of magnitude of the related costs - and the diagram above will still be useful.
Now let's take a closer look at the points in our infographics above.
ALU and FPU operations
For our purposes, speaking of ALU operations, we will only consider register-register operations. If memory is involved, the costs can be VERY different - it will depend on how big the cache miss was when accessing the memory, as described below.
“Simple” operations
Nowadays (and on modern processors), “simple” operations, such as ADD / MOV / OR / ..., can easily be performed faster than one CPU clock cycle. This does not mean that the operation will be performed literally within half a measure. On the contrary - while all operations are still performed in an integer number of clock cycles, some of them can be performed in parallel .
In [Agner4] (which, by the way, IMHO is the best reference guide for evaluating processor operations), this feature is reflected in the presence of two values characterizing each operation: one is the delay (which is always represented by an integer number of cycles), and the other is performance. It should be noted, however, that in the real world, when they go beyond the estimates of the order, the exact time will strongly depend on the nature of your program and on the order in which the compiler supplied seemingly unrelated instructions; in short - if you need something better than the wait order, you need to profile your specific program compiled by your particular compiler (and ideally on a specific target processor too).
Further discussion of such methods (known as "extraordinary execution"), being Really Interesting, will be too hardware-oriented (what about the "register naming" that occurs under the processor hood to reduce the number of dependencies that reduce the efficiency of an extraordinary order?) and is clearly not in the area of our attention at the moment.
Integer multiplication / division
Integer multiplication / division is rather expensive compared to “simple” operations above. [ Agner4 ] estimates the cost of 32/64-bit multiplication (MUL / IMUL in the x86 / x64 world) at 1-7 cycles (in practice, I observed a narrower range of values, for example, 3-6 cycles), and the value of 32/64-bit division (known as DIV / IDIV by x86 / 64) - about 12-44 cycles.
Floating point operations
The cost of floating-point operations is taken from [ Agner4 ] and varies from 1-3 CPU cycles for addition (FADD / FSUB) and 2-5 cycles for multiplication (FMUL) to 37-39 division bars (FDIV).
If scalar SSE operations are used (which “every dog” seems to use today), the indices decrease to 0.5–5 cycles for multiplication (MULSS / MULSD) and to 1–40 cycles for division (DIVSS / DIVSD); in practice, however, you should rather expect 10-40 clocks to divide (1 clock is “mutual throughput”, which in practice is rarely implemented).
128-bit vector operations
For several years now, the CPU has supported “vector” operations (more precisely, multiple data operations Single Instruction Multiple Data or SIMD); in the Intel world, they are known as SSE and AVX and in the ARM world - as ARM Neon. It's funny that they work with data “vectors”, the data being the same size (128 bits for SSE2-SSE4, 256 bits for AVX and AVX2 and 512 bits for the upcoming AVX-512), but they can be interpreted differently. For example, the 128-bit SSE2 register can be interpreted as (a) two double, (b) four float, © two 64-bit integer, (d) four 32-bit integer, (e) eight 16-bit integer, (f ) sixteen 8-bit integer.
[ Agner4 ] estimates integer addition over a 128-bit vector at <1 clock if the vector is interpreted as 4 × 32-bit integers and at 4 clock cycles if it is 2 × 64-bit integers; multiplication (4 × 32 bits) is estimated at 1-5 clock cycles - and the last time I checked, there were no integer vector division operations in the x86 / x64 instruction set. Floating point operations over 128-bit vectors are estimated from 1-3 CPU cycles for addition and 1-7 CPU cycles for multiplication, for division to 17-69 cycles.
Transition delays
The not so obvious thing to do with computational costs is that switching between whole and floating instructions is not free. [ Agner3 ] estimates this cost (known as “transition delay”) at 0–3 cycles, depending on the processor. In fact, the problem is more general, and (depending on the CPU) there may also be penalties for switching between vector (SSE) integer instructions and regular (scalar) integer instructions.
Optimization Tip: In code for which performance is critical, avoid combining floating point and integer calculations.
Branching
The next thing we will discuss is code branching. The transition (if inside your program) is essentially a comparison and change in the program counter. While both of these things are simple, branching can be quite expensive. The discussion of why this is so again will turn out to be too hardware-oriented (in particular, this affects pipelining and speculative execution), but from the point of view of a software developer, it looks like this:
The duration of this delay is estimated at 10-20 clock cycles of the processor, for the latest Intel processors - about 15-20 clock cycles [ Agner3 ].
Note that while the GCC macro __builtin_expect () is thought to affect branch prediction - and it worked this way only 15 years ago, it is no longer relevant, at least for Intel processors (starting from Core 2 or around Togo).
As described in [ Agner3 ], on modern Intel processors, transition prediction is always dynamic (or, at least, dynamic solutions dominate); this, in turn, implies that the expected deviations from the __builtin_expect () code will not affect the prediction of transitions (on modern Intel processors). However, __builtin_expect () still affects the way code is generated, as described in the "Memory Access" section below.
Memory access
In the 80s, the processor speed was comparable to the memory delay (for example, the Z80 processor operating at 4 MHz, spent 4 clock cycles on a register-register command and 6 clock cycles on a register-memory command). At that time, it was possible to calculate the speed of the program, just by looking at the assembly.
Since then, processor speeds have increased by 3 orders of magnitude, and memory delays have improved only 10-30 times or so. To cope with the remaining more than thirty-fold mismatch, all these kinds of caches were introduced. A modern processor usually has 3 levels of caches. As a result, the speed of access to memory depends very much on the answer to the question “where are the data that we are trying to read stored?”. The lower the cache level where your query was found, the faster you can get it.
Access times for L1 and L2 cache can be found in official documentation, such as [Intel.Skylake]; it estimates the access time to L1 / L2 / L3 at 4/12/44 processor cycles, respectively (note: these numbers vary slightly from one processor model to another). In general, as mentioned in [ Levinthal ], the access time to L3 can reach 75 clock cycles if the cache is shared with another core.
However, what is more difficult to find is the information about the access time to the main RAM. [ Levinthal ] estimates it at 60ns (~ 180 clock cycles if the processor is clocked at 3 GHz).
Optimization Tip : Improve data locality. For details, see, for example, [ NoBugs ].
In addition to reading from memory, there is also a record. While writing is intuitively perceived as more expensive than reading, most often it is not; The reason for this is simple: the processor does not need to wait for the completion of the recording before going ahead (instead, it is just starting to write - and immediately moves on to other matters). This means that most of the time the processor can write in 1 clock cycle; this is consistent with my experience and appears to correlate quite well with [ Agner4 ]. On the other hand, if your system is tied to the memory bandwidth, the numbers can be EXTREMELY high; yet, from what I have seen, overloading the bus with write operations is very rare, so I did not reflect it on the diagram.
In addition to the data, there is a code.
Another optimization tip: try to improve the code locality too. This is less obvious (and, as a rule, has less impact on performance than poor data localization). A discussion of ways to improve code locality can be found in [ Drepper ]; these methods include such things as inlining, and __builtin_expect ().
It should be noted that although __builtin_expect (), as mentioned above, no longer affects the prediction of transitions on Intel processors, it still affects the code markup, which, in turn, affects the spatial locality of the code. As a result, __builtin_expect () has no effects that are too pronounced on modern Intel processors (on ARM, I have no idea, to be honest), but it can still affect performance to one degree or another. It was also reported that under the MSVC, the replacement of if and else transitions of a conditional operator has effects similar to __builtin_expect () (if the intended transition is an if-transition of a conditional operator with two transitions), but this should be treated with doubt.
NUMA (Uneven Memory Architecture)
Another thing related to memory access and performance is rarely seen on desktop computers (since this requires multiprocessor machines — not to be confused with multi-core computers). Thus, it is mainly server-based paraffin; however, this significantly affects the memory access time.
When multiple sockets are involved, modern processors tend to implement the so-called NUMA architecture, with each processor (where “processor” = “this thing inserted in the socket”) has its own RAM (unlike earlier FSB architecture with a common FSB aka Front-Side Bus and Shared RAM). Although each processor has its own RAM, the CPU shares the address space of the RAM — and whenever access to RAM physically located in another is required, this is done by sending a request to another socket via an ultra-fast protocol such as QPI or Hypertransport .
Surprisingly, this is not as long as you might expect - [ Levinthal ] gives you 100-300 CPU cycles if the data was in the L3 cache of the remote processor and 100ns (~ = 300 cycles), if the data was not there, and the remote processor I had to go to my main RAM for this data.
CAS (comparison with exchange)
Sometimes (in particular, in non-blocking algorithms and in the implementation of mutexes) we want to use the so-called atomic operations. Academically, only one atomic operation known as CAS (Compare-And-Swap — Comparison with Exchange) (on the grounds that everything else can be implemented through CAS) is usually considered; in the real world, there are usually more of them (see, for example, std :: atomic in C ++ 11, Interlocked * () on Windows or __sync _ * _ and _ * () on GCC / Linux). These operations are rather strange beasts: in particular, they need special support from the CPU to work properly. In x86 / x64, the corresponding ASM instructions are characterized by the presence of the LOCK prefix, so the CAS on x86 / x64 is usually written as LOCK CMPXCHG.
From our current point of view, it is important that these operations, like CAS, will be performed much longer than normal memory access (to ensure atomicity, the processor must synchronize processes, at least between different cores, or in the case of multi-socket configurations, also between different sockets).
[ AlBahra ] estimates the cost of CAS operations at approximately 15-30 cycles (with a small difference between the x86 and IBM Power families). It is worth noting that this number is valid only if two assumptions are made: (a) we are working with a single-core configuration, and (b) that the compared memory is already in L1.
Regarding the costs of CAS in multi-socket NUMA configurations, I could not find data on CAS, so I still can not do without speculation. On the one hand, IMHO will be almost impossible to have CAS delays on the “remote” memory less than the HyperTransport circuit between the sockets, which in turn is comparable to the cost of reading NUMA L3 cache.
On the other hand, I really see no reason to exceed these figures :-). As a result, I estimate the cost of NUMA of separate CAS (and CAS-like) operations at 100-300 CPU cycles.
TLB (Associative translation buffer)
Whenever we work with modern processors and modern operating systems, at the application level, we usually deal with a “virtual” address space; in other words, if we run 10 processes, each of these processes can (and probably will) have its own address 0x00000000. To support this isolation processors implement the so-called "virtual memory". In the x86 world, it was first implemented through the “protected mode”, introduced back in 1982 at 80286.
Usually, “virtual memory” works page by page (for x86, each page is either 4K or 2M or, at least, theoretically, even 1G (!)), When the CPU knows what process is running (!), And re-allocates virtual addresses to physical addresses with each memory access. Note that this re-markup takes place completely behind the scenes, in the sense that all processor registers (except those that deal with markup) contain all pointers in the format of “virtual memory”.
And since we started talking about “markup” - well, information about this markup should be somewhere saved. Moreover, since this markup (from virtual to physical addresses) occurs every time a memory is accessed, it must be Damn Fast. This is usually done using a special kind of cache called the Associative Translation Buffer (TLB).
As with any type of cache, there is a TLB slip cost; for x64, it ranges between 7-21 CPU cycles [ 7cpu ]. In general, TLB is quite difficult to influence; however, several recommendations can still be made here:
Software primitives
Now we are done with things that are directly related to hardware, and we’ll talk about some things related to software; they are really still everywhere, so let's see how much we spend each time we use them.
Function calls in C / C ++
First, let's look at the cost of calling functions in C / C ++. In fact, what calls functions in C / C ++ does a heck of a lot of things to do before the call, and the callee is also not sitting idly.
[ Efficient C ++ ] estimates the cost of the CPU to call a function at 25-250 cycles, depending on the number of parameters; however, it is a rather old book, and I don’t have a better reference of the same caliber. On the other hand, in my experience, for a function with a sufficiently small number of parameters, this will most likely be 15-30 cycles; this also seems to apply to non-Intel processors, as [ eruskin ] found out.
Optimization Tip: Use inline functions where applicable. However, keep in mind that compilers nowadays most often ignore embedded specifications. So for really critical pieces of code, you can use __attribute __ ((always_inline)) for GCC and __forceinline for MSVC to get them to do what you need. However, do NOT use these forced inline for not very critical code snippets, this can make it much worse.
By the way, in many cases, the gain from embedding may exceed the cost of simply deleting a call. This is due to the fact that embedding provides quite a lot of additional optimizations (including those associated with reordering to ensure proper use of hardware conveyor). Also, let's not forget that embedding improves spatial locality for code, which also helps a little (see, for example, [ Drepper ]).
Indirect and virtual calls
The discussion above was associated with the usual ("direct") function calls. The cost of indirect and virtual calls is known to be higher, and many agree that indirect calling causes branching (however, as noted by [ Agner1 ], as long as you call the same function from the same code point , mechanisms for predicting transitions of modern processors can predict this quite well, otherwise, you will receive a penalty for a false prediction of 10-30 clock cycles). As for virtual calls, this is one additional reading (reading the VMT pointer), so if everything is cached at that moment (as usual), we are talking about an additional 4 processor cycles or so.
On the other hand, practical measurements [ eruskin ] show that the cost of virtual functions is about half the cost of direct calls for small functions; within our margin of error (which is “order”), this is quite consistent with the above analysis.
Optimization Tip : If your virtual calls are expensive, instead in C ++ you might think about using patterns (implementing the so-called compile-time polymorphism); CRTP is one (though not the only) way to do this.
Allocation
Nowadays, allocators as such can be quite fast; in particular, the tcmalloc and ptmalloc2 allocators can spend as little as 200-500 CPU cycles to allocate / free a small object [ TCMalloc ].
However, there is a significant caution associated with allocation, and adding to the indirect costs of using allocations: allocation, as the good old rule of thumb, means reducing memory locality, which, in turn, negatively affects performance (due to with uncached memory described above). To illustrate how bad it is in practice, we can take a look at the 20-line program in [ NoBugs ]; this program when using vector <> runs from 100 to 780 times faster (depending on the compiler and a specific field) than the equivalent program using list <> is all due to the poor localization of the latter's memory :-(.
Optimization Tip : Think about reducing the number of allocations in your programs, especially if there is a stage where most of the work is done with read-only data. In some real-world cases, smoothing your data structures (i.e., replacing selected objects with packed ones) can speed up your program up to 5 times.
The real story on the topic. Once upon a time there was a program that used gigabytes of RAM, which was considered too large; OK, I rewrote it into a “flattened” version (that is, each node was first dynamically constructed, and then an equivalent “flattened” read-only object was created in memory); the idea of "smoothing" was to reduce the amount of memory. When we ran the program, we noticed that not only the memory size decreased by 2 times (which was what we expected), but also, as a very good side effect, the execution speed increased 5 times.
OS kernel calls
If our program runs under the operating system (yes, there are programs that work without it), then we have a whole group of system APIs. In practice (at least, if we are talking about a more or less normal OS), many of these system calls lead to kernel calls, which include switching to kernel mode and back; this involves switching between different “protection rings” (on an Intel processor, usually between “ring 3” and “ring 0”). While switching between processor levels takes only about 100 clock cycles, other associated overheads tend to make kernel calls much more expensive, so a normal kernel call takes at least 1000-1500 processor cycles [ Wikipedia.ProtectionRing ].
C ++ Exceptions
Nowadays, C ++ exceptions are said to be worth nothing until they work. Is it really that nothing is still 100% clear (IMO is not even clear whether such a question can be asked at all), but it is certainly very close.
However, these “cost-free yet unsettled” implementations stand behind a huge pile of work that must be done whenever an exception occurs. Everyone agrees that the cost of the thrown exception is huge, but (as usual) there is little experimental data. Nevertheless, the [ Ongaro ] experiment gives us an approximate amount of about 5000 processor cycles (the plague!). Moreover, in more complex cases, I would expect this number to be even greater.
Error return and verification
A temporary alternative to exceptions is to return error codes and check them at each level. Although I have no references to performance measurements of this kind, we already know enough to make a sensible experiment. Let's take a closer look at it (we don’t really care about performance in case of an error, so we’ll focus on evaluation when everything is fine).
In principle, the cost of return-and-check consists of three separate values. The first of these is the cost of the conditional transition itself, and we can safely assume that in 99 +% of cases it will be predicted correctly; this means that the cost of conditional transition in this case is about 1-2 cycles. The second cost is the cost of copying the error code, and as long as it remains within the registers, this is a simple MOV, which in these circumstances ranges from 0 to 1 clock cycle (0 cycles means that MOV does not have any additional cost, because performed in parallel with some other operations). The third cost is much less obvious - the cost of the additional register required to carry the error code; — PUSH/POP ( ), , + L1 1 + 4 . , , PUSH/POP , ; , x86 ; x64 ( ) , PUSH/POP , ( , , , PUSH/POP).
, ---- ( ) 1 7 . , , , 10000 , , , ; , 100 , , , . , — « ».
, , , , . , . , « » (, , nginx Apache), « »?
10000 ; , . , , , « ». [ LiEtAl ], .
, , .
, , ( ), , , , - — , .
THE END
,
Infographics:
')
When we need to optimize the code, we need to profile it and simplify it. However, sometimes it makes sense to simply find out the approximate cost of some popular operations in order not to do inefficient things from the very beginning (and, I hope, not to profile the program later).
So, here it is - infographics, which should help evaluate the cost of specific operations in CPU cycles - and answer questions such as “hey, how much does an L2 read operation usually cost?”. Although the answers to all these questions are more or less known, I don’t know a single place where they are all listed and presented in perspective. Also note that, although the listed costs, strictly speaking, apply only to modern x86 / x64 processors, it is expected that a similar ratio of costs will be observed on other modern processors with large multi-level caches (such as ARM Cortex A or SPARC); on the other hand, MCUs (including ARM Cortex M) are quite different, so that some of the patterns might not apply to them.
And last but not least, a caution: all assessments here only indicate order; however, given the scale of the differences between the various operations, these indications can still be used (at least, one should remember that “premature pessimization” should be avoided).
On the other hand, I am still confident that such a diagram is useful in order not to say “hey, virtual function calls cost nothing” - which may or may not be true depending on how often you call them. Instead, using the infographic above, you can see that if you call your virtual function 100K once a second on a processor with a frequency of 3 GHz - it probably will not cost you more than 0.2% of the total volume of your processor; however, if you call the same virtual function 10M once a second, this can easily mean that virtualization absorbs two-digit percentages of your processor core.
Another way to approach the same question is to say “hey, I call the virtual function once per piece of code that is 10,000 cycles, so virtualization will not consume more than 1% of the program time”, but you still need some way see the order of magnitude of the related costs - and the diagram above will still be useful.
Now let's take a closer look at the points in our infographics above.
ALU and FPU operations
For our purposes, speaking of ALU operations, we will only consider register-register operations. If memory is involved, the costs can be VERY different - it will depend on how big the cache miss was when accessing the memory, as described below.
“Simple” operations
Nowadays (and on modern processors), “simple” operations, such as ADD / MOV / OR / ..., can easily be performed faster than one CPU clock cycle. This does not mean that the operation will be performed literally within half a measure. On the contrary - while all operations are still performed in an integer number of clock cycles, some of them can be performed in parallel .
In [Agner4] (which, by the way, IMHO is the best reference guide for evaluating processor operations), this feature is reflected in the presence of two values characterizing each operation: one is the delay (which is always represented by an integer number of cycles), and the other is performance. It should be noted, however, that in the real world, when they go beyond the estimates of the order, the exact time will strongly depend on the nature of your program and on the order in which the compiler supplied seemingly unrelated instructions; in short - if you need something better than the wait order, you need to profile your specific program compiled by your particular compiler (and ideally on a specific target processor too).
Further discussion of such methods (known as "extraordinary execution"), being Really Interesting, will be too hardware-oriented (what about the "register naming" that occurs under the processor hood to reduce the number of dependencies that reduce the efficiency of an extraordinary order?) and is clearly not in the area of our attention at the moment.
Integer multiplication / division
Integer multiplication / division is rather expensive compared to “simple” operations above. [ Agner4 ] estimates the cost of 32/64-bit multiplication (MUL / IMUL in the x86 / x64 world) at 1-7 cycles (in practice, I observed a narrower range of values, for example, 3-6 cycles), and the value of 32/64-bit division (known as DIV / IDIV by x86 / 64) - about 12-44 cycles.
Floating point operations
The cost of floating-point operations is taken from [ Agner4 ] and varies from 1-3 CPU cycles for addition (FADD / FSUB) and 2-5 cycles for multiplication (FMUL) to 37-39 division bars (FDIV).
If scalar SSE operations are used (which “every dog” seems to use today), the indices decrease to 0.5–5 cycles for multiplication (MULSS / MULSD) and to 1–40 cycles for division (DIVSS / DIVSD); in practice, however, you should rather expect 10-40 clocks to divide (1 clock is “mutual throughput”, which in practice is rarely implemented).
128-bit vector operations
For several years now, the CPU has supported “vector” operations (more precisely, multiple data operations Single Instruction Multiple Data or SIMD); in the Intel world, they are known as SSE and AVX and in the ARM world - as ARM Neon. It's funny that they work with data “vectors”, the data being the same size (128 bits for SSE2-SSE4, 256 bits for AVX and AVX2 and 512 bits for the upcoming AVX-512), but they can be interpreted differently. For example, the 128-bit SSE2 register can be interpreted as (a) two double, (b) four float, © two 64-bit integer, (d) four 32-bit integer, (e) eight 16-bit integer, (f ) sixteen 8-bit integer.
[ Agner4 ] estimates integer addition over a 128-bit vector at <1 clock if the vector is interpreted as 4 × 32-bit integers and at 4 clock cycles if it is 2 × 64-bit integers; multiplication (4 × 32 bits) is estimated at 1-5 clock cycles - and the last time I checked, there were no integer vector division operations in the x86 / x64 instruction set. Floating point operations over 128-bit vectors are estimated from 1-3 CPU cycles for addition and 1-7 CPU cycles for multiplication, for division to 17-69 cycles.
Transition delays
The not so obvious thing to do with computational costs is that switching between whole and floating instructions is not free. [ Agner3 ] estimates this cost (known as “transition delay”) at 0–3 cycles, depending on the processor. In fact, the problem is more general, and (depending on the CPU) there may also be penalties for switching between vector (SSE) integer instructions and regular (scalar) integer instructions.
Optimization Tip: In code for which performance is critical, avoid combining floating point and integer calculations.
Branching
The next thing we will discuss is code branching. The transition (if inside your program) is essentially a comparison and change in the program counter. While both of these things are simple, branching can be quite expensive. The discussion of why this is so again will turn out to be too hardware-oriented (in particular, this affects pipelining and speculative execution), but from the point of view of a software developer, it looks like this:
- if the processor correctly guesses where the execution will be directed (this is before the actual calculation of the if condition), then the transition cost is about 1-2 CPU cycles
- however, if the processor makes a wrong assumption, it causes the CPU to “stall”
The duration of this delay is estimated at 10-20 clock cycles of the processor, for the latest Intel processors - about 15-20 clock cycles [ Agner3 ].
Note that while the GCC macro __builtin_expect () is thought to affect branch prediction - and it worked this way only 15 years ago, it is no longer relevant, at least for Intel processors (starting from Core 2 or around Togo).
As described in [ Agner3 ], on modern Intel processors, transition prediction is always dynamic (or, at least, dynamic solutions dominate); this, in turn, implies that the expected deviations from the __builtin_expect () code will not affect the prediction of transitions (on modern Intel processors). However, __builtin_expect () still affects the way code is generated, as described in the "Memory Access" section below.
Memory access
In the 80s, the processor speed was comparable to the memory delay (for example, the Z80 processor operating at 4 MHz, spent 4 clock cycles on a register-register command and 6 clock cycles on a register-memory command). At that time, it was possible to calculate the speed of the program, just by looking at the assembly.
Since then, processor speeds have increased by 3 orders of magnitude, and memory delays have improved only 10-30 times or so. To cope with the remaining more than thirty-fold mismatch, all these kinds of caches were introduced. A modern processor usually has 3 levels of caches. As a result, the speed of access to memory depends very much on the answer to the question “where are the data that we are trying to read stored?”. The lower the cache level where your query was found, the faster you can get it.
Access times for L1 and L2 cache can be found in official documentation, such as [Intel.Skylake]; it estimates the access time to L1 / L2 / L3 at 4/12/44 processor cycles, respectively (note: these numbers vary slightly from one processor model to another). In general, as mentioned in [ Levinthal ], the access time to L3 can reach 75 clock cycles if the cache is shared with another core.
However, what is more difficult to find is the information about the access time to the main RAM. [ Levinthal ] estimates it at 60ns (~ 180 clock cycles if the processor is clocked at 3 GHz).
Optimization Tip : Improve data locality. For details, see, for example, [ NoBugs ].
In addition to reading from memory, there is also a record. While writing is intuitively perceived as more expensive than reading, most often it is not; The reason for this is simple: the processor does not need to wait for the completion of the recording before going ahead (instead, it is just starting to write - and immediately moves on to other matters). This means that most of the time the processor can write in 1 clock cycle; this is consistent with my experience and appears to correlate quite well with [ Agner4 ]. On the other hand, if your system is tied to the memory bandwidth, the numbers can be EXTREMELY high; yet, from what I have seen, overloading the bus with write operations is very rare, so I did not reflect it on the diagram.
In addition to the data, there is a code.
Another optimization tip: try to improve the code locality too. This is less obvious (and, as a rule, has less impact on performance than poor data localization). A discussion of ways to improve code locality can be found in [ Drepper ]; these methods include such things as inlining, and __builtin_expect ().
It should be noted that although __builtin_expect (), as mentioned above, no longer affects the prediction of transitions on Intel processors, it still affects the code markup, which, in turn, affects the spatial locality of the code. As a result, __builtin_expect () has no effects that are too pronounced on modern Intel processors (on ARM, I have no idea, to be honest), but it can still affect performance to one degree or another. It was also reported that under the MSVC, the replacement of if and else transitions of a conditional operator has effects similar to __builtin_expect () (if the intended transition is an if-transition of a conditional operator with two transitions), but this should be treated with doubt.
NUMA (Uneven Memory Architecture)
Another thing related to memory access and performance is rarely seen on desktop computers (since this requires multiprocessor machines — not to be confused with multi-core computers). Thus, it is mainly server-based paraffin; however, this significantly affects the memory access time.
When multiple sockets are involved, modern processors tend to implement the so-called NUMA architecture, with each processor (where “processor” = “this thing inserted in the socket”) has its own RAM (unlike earlier FSB architecture with a common FSB aka Front-Side Bus and Shared RAM). Although each processor has its own RAM, the CPU shares the address space of the RAM — and whenever access to RAM physically located in another is required, this is done by sending a request to another socket via an ultra-fast protocol such as QPI or Hypertransport .
Surprisingly, this is not as long as you might expect - [ Levinthal ] gives you 100-300 CPU cycles if the data was in the L3 cache of the remote processor and 100ns (~ = 300 cycles), if the data was not there, and the remote processor I had to go to my main RAM for this data.
CAS (comparison with exchange)
Sometimes (in particular, in non-blocking algorithms and in the implementation of mutexes) we want to use the so-called atomic operations. Academically, only one atomic operation known as CAS (Compare-And-Swap — Comparison with Exchange) (on the grounds that everything else can be implemented through CAS) is usually considered; in the real world, there are usually more of them (see, for example, std :: atomic in C ++ 11, Interlocked * () on Windows or __sync _ * _ and _ * () on GCC / Linux). These operations are rather strange beasts: in particular, they need special support from the CPU to work properly. In x86 / x64, the corresponding ASM instructions are characterized by the presence of the LOCK prefix, so the CAS on x86 / x64 is usually written as LOCK CMPXCHG.
From our current point of view, it is important that these operations, like CAS, will be performed much longer than normal memory access (to ensure atomicity, the processor must synchronize processes, at least between different cores, or in the case of multi-socket configurations, also between different sockets).
[ AlBahra ] estimates the cost of CAS operations at approximately 15-30 cycles (with a small difference between the x86 and IBM Power families). It is worth noting that this number is valid only if two assumptions are made: (a) we are working with a single-core configuration, and (b) that the compared memory is already in L1.
Regarding the costs of CAS in multi-socket NUMA configurations, I could not find data on CAS, so I still can not do without speculation. On the one hand, IMHO will be almost impossible to have CAS delays on the “remote” memory less than the HyperTransport circuit between the sockets, which in turn is comparable to the cost of reading NUMA L3 cache.
On the other hand, I really see no reason to exceed these figures :-). As a result, I estimate the cost of NUMA of separate CAS (and CAS-like) operations at 100-300 CPU cycles.
TLB (Associative translation buffer)
Whenever we work with modern processors and modern operating systems, at the application level, we usually deal with a “virtual” address space; in other words, if we run 10 processes, each of these processes can (and probably will) have its own address 0x00000000. To support this isolation processors implement the so-called "virtual memory". In the x86 world, it was first implemented through the “protected mode”, introduced back in 1982 at 80286.
Usually, “virtual memory” works page by page (for x86, each page is either 4K or 2M or, at least, theoretically, even 1G (!)), When the CPU knows what process is running (!), And re-allocates virtual addresses to physical addresses with each memory access. Note that this re-markup takes place completely behind the scenes, in the sense that all processor registers (except those that deal with markup) contain all pointers in the format of “virtual memory”.
And since we started talking about “markup” - well, information about this markup should be somewhere saved. Moreover, since this markup (from virtual to physical addresses) occurs every time a memory is accessed, it must be Damn Fast. This is usually done using a special kind of cache called the Associative Translation Buffer (TLB).
As with any type of cache, there is a TLB slip cost; for x64, it ranges between 7-21 CPU cycles [ 7cpu ]. In general, TLB is quite difficult to influence; however, several recommendations can still be made here:
- once again - improving overall memory locality helps reduce TLB misses; the more local your data is, the less chance there is to get out of the TLB.
- Consider using “large pages” (those 2 MB x64 pages). The larger the page, the fewer TLB entries you will need; on the other hand, it is necessary to use the “larger page” with caution, it is a double-edged sword. This means that you need to test it for your particular application.
- Consider disabling ASLR (= "randomization of address space allocation"). As discussed in [ Drepper ], while the inclusion of ASLR is good for security, it kills performance, also due to TLB misses.
Software primitives
Now we are done with things that are directly related to hardware, and we’ll talk about some things related to software; they are really still everywhere, so let's see how much we spend each time we use them.
Function calls in C / C ++
First, let's look at the cost of calling functions in C / C ++. In fact, what calls functions in C / C ++ does a heck of a lot of things to do before the call, and the callee is also not sitting idly.
[ Efficient C ++ ] estimates the cost of the CPU to call a function at 25-250 cycles, depending on the number of parameters; however, it is a rather old book, and I don’t have a better reference of the same caliber. On the other hand, in my experience, for a function with a sufficiently small number of parameters, this will most likely be 15-30 cycles; this also seems to apply to non-Intel processors, as [ eruskin ] found out.
Optimization Tip: Use inline functions where applicable. However, keep in mind that compilers nowadays most often ignore embedded specifications. So for really critical pieces of code, you can use __attribute __ ((always_inline)) for GCC and __forceinline for MSVC to get them to do what you need. However, do NOT use these forced inline for not very critical code snippets, this can make it much worse.
By the way, in many cases, the gain from embedding may exceed the cost of simply deleting a call. This is due to the fact that embedding provides quite a lot of additional optimizations (including those associated with reordering to ensure proper use of hardware conveyor). Also, let's not forget that embedding improves spatial locality for code, which also helps a little (see, for example, [ Drepper ]).
Indirect and virtual calls
The discussion above was associated with the usual ("direct") function calls. The cost of indirect and virtual calls is known to be higher, and many agree that indirect calling causes branching (however, as noted by [ Agner1 ], as long as you call the same function from the same code point , mechanisms for predicting transitions of modern processors can predict this quite well, otherwise, you will receive a penalty for a false prediction of 10-30 clock cycles). As for virtual calls, this is one additional reading (reading the VMT pointer), so if everything is cached at that moment (as usual), we are talking about an additional 4 processor cycles or so.
On the other hand, practical measurements [ eruskin ] show that the cost of virtual functions is about half the cost of direct calls for small functions; within our margin of error (which is “order”), this is quite consistent with the above analysis.
Optimization Tip : If your virtual calls are expensive, instead in C ++ you might think about using patterns (implementing the so-called compile-time polymorphism); CRTP is one (though not the only) way to do this.
Allocation
Nowadays, allocators as such can be quite fast; in particular, the tcmalloc and ptmalloc2 allocators can spend as little as 200-500 CPU cycles to allocate / free a small object [ TCMalloc ].
However, there is a significant caution associated with allocation, and adding to the indirect costs of using allocations: allocation, as the good old rule of thumb, means reducing memory locality, which, in turn, negatively affects performance (due to with uncached memory described above). To illustrate how bad it is in practice, we can take a look at the 20-line program in [ NoBugs ]; this program when using vector <> runs from 100 to 780 times faster (depending on the compiler and a specific field) than the equivalent program using list <> is all due to the poor localization of the latter's memory :-(.
Optimization Tip : Think about reducing the number of allocations in your programs, especially if there is a stage where most of the work is done with read-only data. In some real-world cases, smoothing your data structures (i.e., replacing selected objects with packed ones) can speed up your program up to 5 times.
The real story on the topic. Once upon a time there was a program that used gigabytes of RAM, which was considered too large; OK, I rewrote it into a “flattened” version (that is, each node was first dynamically constructed, and then an equivalent “flattened” read-only object was created in memory); the idea of "smoothing" was to reduce the amount of memory. When we ran the program, we noticed that not only the memory size decreased by 2 times (which was what we expected), but also, as a very good side effect, the execution speed increased 5 times.
OS kernel calls
If our program runs under the operating system (yes, there are programs that work without it), then we have a whole group of system APIs. In practice (at least, if we are talking about a more or less normal OS), many of these system calls lead to kernel calls, which include switching to kernel mode and back; this involves switching between different “protection rings” (on an Intel processor, usually between “ring 3” and “ring 0”). While switching between processor levels takes only about 100 clock cycles, other associated overheads tend to make kernel calls much more expensive, so a normal kernel call takes at least 1000-1500 processor cycles [ Wikipedia.ProtectionRing ].
C ++ Exceptions
Nowadays, C ++ exceptions are said to be worth nothing until they work. Is it really that nothing is still 100% clear (IMO is not even clear whether such a question can be asked at all), but it is certainly very close.
However, these “cost-free yet unsettled” implementations stand behind a huge pile of work that must be done whenever an exception occurs. Everyone agrees that the cost of the thrown exception is huge, but (as usual) there is little experimental data. Nevertheless, the [ Ongaro ] experiment gives us an approximate amount of about 5000 processor cycles (the plague!). Moreover, in more complex cases, I would expect this number to be even greater.
Error return and verification
A temporary alternative to exceptions is to return error codes and check them at each level. Although I have no references to performance measurements of this kind, we already know enough to make a sensible experiment. Let's take a closer look at it (we don’t really care about performance in case of an error, so we’ll focus on evaluation when everything is fine).
In principle, the cost of return-and-check consists of three separate values. The first of these is the cost of the conditional transition itself, and we can safely assume that in 99 +% of cases it will be predicted correctly; this means that the cost of conditional transition in this case is about 1-2 cycles. The second cost is the cost of copying the error code, and as long as it remains within the registers, this is a simple MOV, which in these circumstances ranges from 0 to 1 clock cycle (0 cycles means that MOV does not have any additional cost, because performed in parallel with some other operations). The third cost is much less obvious - the cost of the additional register required to carry the error code; — PUSH/POP ( ), , + L1 1 + 4 . , , PUSH/POP , ; , x86 ; x64 ( ) , PUSH/POP , ( , , , PUSH/POP).
, ---- ( ) 1 7 . , , , 10000 , , , ; , 100 , , , . , — « ».
, , , , . , . , « » (, , nginx Apache), « »?
10000 ; , . , , , « ». [ LiEtAl ], .
- — , 2000 (3 , )
- ; ; [ LiEtAl ], 3M . , , 12M L3 ( 50 ) 10M ; , 1M [LiEtAl] . « » x64 ( 4000, Windows/x64): 4000 ( , , 15-20 . , 40-50K , ), ----- — , , 4000 , , — , , --------------.
, , .
, , ( ), , , , - — , .
THE END
,
Source: https://habr.com/ru/post/343566/
All Articles