How we control the quality of the code in the Android Browser. Yandex lecture
The author of this lecture is Konstantin Zaikin kzaikin , head of the Yandex. Browser for Android development team in St. Petersburg. He spoke about the tools of the Android developer and the whole team, as well as how to cope with legacy code, publish a large project on time and improve the quality of the code.
- Friends, hello. I am very glad that so many of you have come today. I came from Peter, I have been working in Yandex for about six years. I managed to light up in Maps, Taxi, Metric and Search. For two years now I've been working on Yandex Browser for Android.
Today I will tell you how we provide good code in the browser. Browser for Android is a rather cumbersome thing. In principle, the kernel in the browser is the Chromium core, around which the core services of Yandex are located, all this is written mainly in C ++, and platform applications are written around these two cores nested into each other. Yandex.Browser is on Windows, Mac, Linux, Android and iOS. Basically, I will talk about the code for Android, and specifically about Java and Kotlin.
')
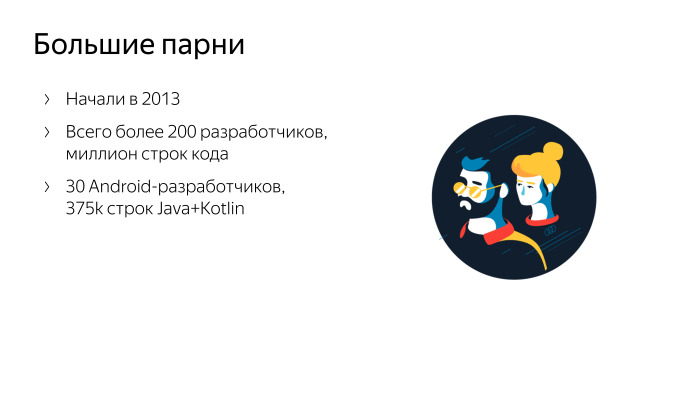
There are 200 mobile developers in Yandex, but in the same Browser - with the desktop and all the rest - also 200 people. About 30 people of them wrote under Android. A lot of people, and we wrote a large amount of code. By the number of lines, we are the largest in Yandex. And in a natural way, as in any living organism, in our project the code is born, lives, ages, it is necessary to monitor it and ensure its well-being.
I will tell you in succession what processes we used to ensure the quality of the code and which tools we use. Any bug that occurs has a few moments when it can be solved. You can not just make a bug. You can solve the bug when it is in the open window of the editor at the developer. You can find it on unit tests. You can find it later in testing or in production.
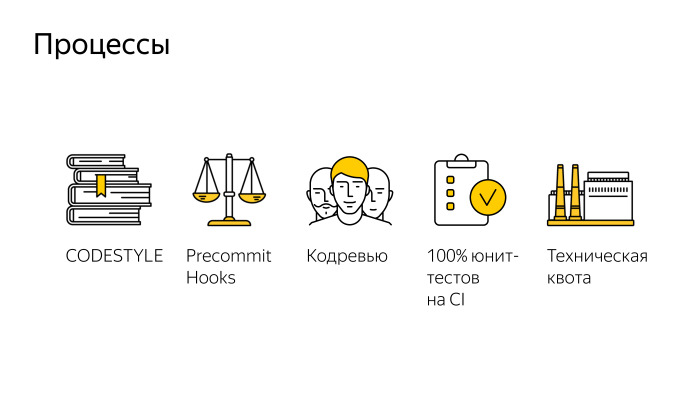
We tried to build our processes in such a way that at all these stages the maximum number of bugs could be caught or not at all. First of all, we recorded our codestyle in the browser. In a large project, it is really very important that there is a written codestyle that is relevant, supported, and we have placed it as a codestyle MD in our repository. To edit it, you need to make a pull request so that, like a normal code, it will be rebuilt, prompted, the team will agree, and after that everyone will agree with these rules. Or we discuss and make new changes.
Codestyle, in addition to fixing the general rule for the whole team, also carries an educational function. We have a big team, we invite a lot of new people to ourselves. Newbies first read Vicki, we have a lot of descriptions, we love Vicky. And read the codestyle. There are examples of how to do and how not to. After the developer, in accordance with the codestyle, wrote a new feature, he should commit it. We have made precommit hooks that will not allow code with deviations from accepted rules. This may be a codestyle, and some things that static analysis easily catches. That is, just not letting the code get into the commit, git refuses to accept such code.
After that, we necessarily pass the code. We use Bitbucket, we have a rule that any code can get into the repository only after upruva from two colleagues. Two living people have to come, look at the code, get to it. And surely this pull request should come together and pass all 100% of our unit tests. And we have a lot of tests. And the reviewers are watching, and all the precommit hooks. Some of you may wonder how long it takes? Big project after all. I can proudly say that we have the minimum time from creating a pull request to getting the code in the repository now is about 30 minutes. This is the minimum time for which the code gets into our master. We went to this for a long time. And we have the usual Chromium-based browser. Everyone who writes such browsers has very big problems with the build time. A million lines of code, they need to be compiled, they are compiled for a long time. And 400 thousand lines of Java code need to be compiled and run the tests. This is the result of the work of the whole team. We are all working to ensure that our processes allow us to think more about the result, and not about how to wait for builds, locally or on TeamCity.
What is important, 30 minutes is the time for TeamCity, and the local developer build takes 30 seconds. He does not banish all unit tests, he does not assemble all the assemblies for all platforms, all combinations. And on TeamCity we collect it. Plus, tests are run on TeamCity. Now, from these 30 minutes, unit tests take about 20 minutes. In addition, to provide quality code, we have introduced a technical quota. We spend 30% of the time on the return on the technical debt that we have managed to accumulate, and which we are trying to do again and again. Each sprint 30% of the team is engaged in refactoring, improving existing code, writing unit tests that were not in place, or improving tools.
In general, to improve any thing, there is a very important rule - before you improve something, you need to measure it. I ask for your help. I ask you to suggest what things you would suggest to measure in order to understand how you have a quality code and a quality product in order to improve this product. For example, I will mention the obvious thing: what is your test coverage in percent. Any other options to understand, you have a quality code or not? The number of lines in the method. The number of classes. The speed of execution, how long your application runs, how quickly lists will scroll. The number of interfaces - in principle, the same metric. Power consumption is good? Build time too.
For all that you have called, we have the tools. We can measure what is in our project now, as it was a year ago and what is happening now. First of all, we measure the state of health of the application in production, we use AppMetrica, it is a publicly available service that allows you to follow events, follow crashes, and feel the application. We use AppMetrica to collect a lot of things, technical indicators.
Then with the help of ClickHouse and our own self-made tools we make reports from this data. We have a little more than the average AppMetrica user, only due to the fact that we have invested in access to this database and make special requests. AppMetrica allows you to collect the fact of an event. Event happened - so many pieces. But AppMetrica does not allow to look at the numerical data. For example, we need to measure the power consumption in some parrots. And you need to understand how in the current version different users have how many of these parrots turned out. What is the distribution of users according to power consumption. What is the distribution of users by start time? What is the distribution of users according to the speed of scrolling in FPS or in time between frames. And to collect such numerical data in order to analyze them, we used histograms.
My colleague spoke very well about them, they are in Yandex according to the word “histograms”, the very first video is the story told by colleagues from my team about how we collect numerical indicators and analyze them. The same Ilya Bogin will be able to tell in detail how to collect these numbers. And then we have an obvious indicator - open bugs. There is a product, there is testing, there are users. They report bugs. The more bugs, the worse the product. The more blocker bugs, the worse the product. Blocker bugs compare with minors ... We have a separate metric showing the quality of the product in bugs, zero bug policy, conditionally.
This is a screenshot from our real tool, in which the amount of crashes per million sessions is collected. Not very well visible, but the bottom chart is the number of crashes in Java, about 200 per million sessions. And the top two ... At first there are a lot of crush in the native, there are quite a lot of them, because we have the Chromium core and there are a lot of “pluses”. The topmost is the amount. In general, we monitor this indicator and are working to improve it. The smaller the schedule, the better. This is the last year we work and improve.
The same, the same graphics we have for power consumption, for the speed of scrolling and everything else.
In addition, we have implemented and very actively use such a thing, SonarQube, I advise her to everyone. You can put it yourself, whether you are an indie developer or as part of a team. This is a platform on which you can turn any static code analyzers. It is open source, free and is able to analyze almost all programming languages that exist. We have implemented it, and now constantly with its help we monitor some indicators of the health of our project. Briefly walk on what is on this slide. This is very important, as it is written in the documentation, but not very obvious.
This is a real dashboard screenshot. We have so many bugs, more than a thousand. There are a number of security vulnerabilities. Here is a test coverage - 52.7%. And such a number of unit tests. This is cool, it seems. We now have the largest coverage of Yandex mobile apps. We also measure the proportion of duplicate code. What is interesting, we set up this thing for all Yandex mobile applications and we can watch duplicates between projects, is also very cool, helps us to select those parts of the code that should be put into the library in order not to duplicate.
The main metric that collects all of this is a whole lot more, and in one clear figure it says whether your project is good or bad. This is a technical duty - we have 204 days, conditional working days of a conditional developer in a vacuum, which must work for all these problems to be eliminated. Do you think it is a big debt or a small one? We have a large team, 30 people. If we take it, we will repay this debt in a limited time. We had episodes when we took and started - let's fix all the blockers in the SonarQube. And they began to fix them.
But there is one feature. This is a silver bullet. It doesn't matter how many bugs you have found static analysis in the project. It is important that you do not make new bugs. And the fix bug, which is good and has been lying there for a long time, will surely happen someday. But it did not happen, it was not found in testing, its unit tests were not found. Most likely, he will not bum. And the fix of the old bug can lead to the fact that you have a new, real, which will lead to a real crash.
The main thing is not to fix the old bugs, but make sure that there are no new ones. Our dashboard is a separate indicator - we have accumulated 1 day in the last 14 days. Yes, we do it, but very moderately. We have the technical debt ratio, the share of debt to the volume of the entire code, is steadily falling. And this is the best indicator that we are doing everything right.
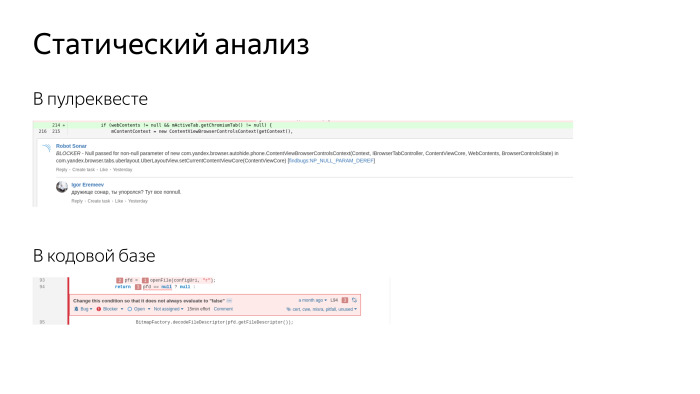
Cut from real screenshots on screen. This same Sonar allows you to add comments to pull requests. Two reviewers come to us and leave comments, plus another robot comes, the third reviewer. He leaves comments on obvious issues, on codestyle, code design, finds security vulnerabilities. People love him. Does not add a new debt.
In addition, in Sonar we can see existing bugs. There is a very convenient viewer, where we see the entire code base, and for each line we can see what the issue is, when it was added and what we did with it. You can come to the author and say: buddy, in the last two weeks you have added five blockers - how is that? Deal with the causes and eliminate. We always try to solve any problem radically, eliminate the possibility of such a problem. As a rule, we prepare some tools or make it so that it is impossible to allow bugs.
We are very actively writing tests. We love tests. Recently, very much advanced in their writing.

We have such a number of tests now performed using JUnit, these are tests that run on host machines, just Java and Robolectric. And Android Instrumentation Tests. We have that amount now.
While we wrote this number of tests, we went through several stages. Tests need to be written, everyone writes them, we want a quality product - let's write too. We really have a lot of problems. We write new tests, and the old ones break all the time, they require a lot of time for support and no bugs are found. Any code change causes a breakdown of tens of hundreds of tests, and we go and fix tests. Fortunately, now we have passed this crisis, now our tests really provide both documentation of the code, and provide the developer with confidence that the code is written correctly. Now the whole team has learned to write tests and writes them very actively. The previous slide shows that the coverage on the new code is 55%. This is more than the old, we are moving in the right direction. It would be better still higher, but so far.
We are actively using Robolectric, we are happy with it, it allows us to get wet, replace the real Android, but at the same time perform the tests much faster. 9000 tests is a lot. About 600 of them run on emulators, the rest of the tests are performed on the host machine. Our build agent is fast, 16 cores, everything is quick and easy on them. If we raise the emulator, Instrumentation Tests begin to run on it for a long time and painfully. This we try to avoid. Robolectric is very good.
We also actively use interfaces. We are supporters of clean code, actively use inversion of control, dependency injection and using interfaces we separate the platform from the code we write. There are people who deny Robolectric, they say that only interfaces are needed, and Robolectric is evil. We are supporters of a reasonable approach. We are actively using the Mockito and deliberately cut out the Powermock because it provoked a bad test style. This is evil, it allows mocking statics, files, generally breaks everything around and provokes bad architecture.
The main summary of this slide is that we are all documenting - just like any thing. We write in the style of "do not do that." We have test smells, a separate page, where typical problems are fixed that arise when writing tests in the “so bad and so it would be good” mode. And when new developers come, they usually say that this thing helps a lot, because there are not just examples of how not to do it, and many are just looking at the right side how to do it. There are many tricks and tools about which it is impossible to guess, you need to understand them with experience or learn with experience. And here we tell them everything on a silver platter.
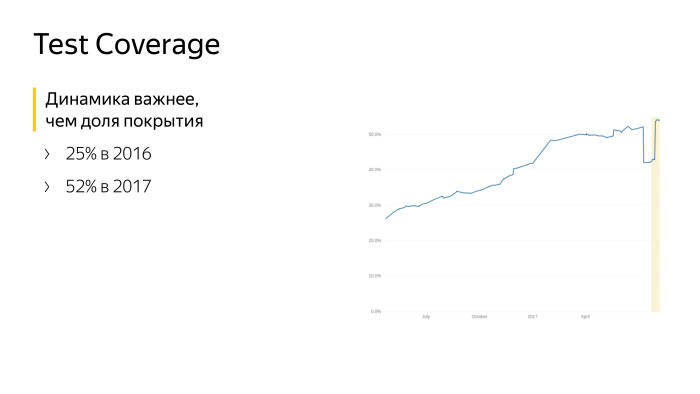
This graph speaks for itself. This is data from June last year to the current moment. We worked on the test coverage, wrote the tests. But more importantly, we did not stand still, we grew.
In addition to unit tests, we use autotests. Who does not know and does not use, this is the conditional name for tests that test the application as a black box. They launch it on a device or an emulator, and a conditional robot scrolls lists with its rubber finger, pokes buttons, tries to break your application under standard scripts. With auto tests, we replace manual testers, living people who are better off doing something more meaningful than repeating scenarios over and over. We are speeding up our regression, checking that the new release is good and can go to production. Now we are releasing every three weeks and a considerable part of this achievement is that we have translated manual tests for autotests. We have more than 60% of tests are automated.
Our tests are written in Appium, this is a fairly standard Yandex tool, it came to us from testing the web along with people who tested the web. Now we have written about 3000 tests on Appium, deployed an infrastructure that allows us to run 25 emulators each time, they rise, new and clean, tests are run and run in parallel to them. But still everything turns out very slowly. It takes us a few hours to launch a regression now, and we cannot do it all the time, for each build. We do not have enough resources and hardware to do all this. And just these tools we are very active in open source, on GitHub in Yandex QA Tools there are a lot of tools, there is an active community where we put all this.
Here is another thing that we can say we have suffered. Initially, autotests were written by individuals, not quite developers. There are handbrakes, they need to be automated. The first reaction is to replace the parking brake with a robot, let it write, and the repository rises separately from the browser, where the code is written. It seems the guys write code in Java, the same JUnit, like testers. But we eventually combined the teams, merged into one, and now we can write self-tests any developer. We specifically rotate people so that everyone knows how autotests are written, so they know how to repair auto tests when we suddenly broke them. In autotests, the main pain is that they fall off and break all the time, that they are red all the time.
I will show one of the ways to solve this problem. This is a TV from my office, one of them. We generally love TVs with graphics. But this is a TV about autotests. Greens - successfully completed, yellow ones - captured for a reason known to us, red ones - for an unknown. We look at it all the time. They singled out a separate attendant who changes all the time, who keeps track of what is happening with the tests. — , , , . , , , . , . , , -. , , .
Espresso. , Espresso , Appium, Espresso . , . — . Espresso . , . , . - . . , .
, Espresso, Kotlin, DSL, , , . , .
— . . — .

, . , , . . , , , . - . , .

- — . , , , , . , . , .
- Friends, hello. I am very glad that so many of you have come today. I came from Peter, I have been working in Yandex for about six years. I managed to light up in Maps, Taxi, Metric and Search. For two years now I've been working on Yandex Browser for Android.
Today I will tell you how we provide good code in the browser. Browser for Android is a rather cumbersome thing. In principle, the kernel in the browser is the Chromium core, around which the core services of Yandex are located, all this is written mainly in C ++, and platform applications are written around these two cores nested into each other. Yandex.Browser is on Windows, Mac, Linux, Android and iOS. Basically, I will talk about the code for Android, and specifically about Java and Kotlin.
')
There are 200 mobile developers in Yandex, but in the same Browser - with the desktop and all the rest - also 200 people. About 30 people of them wrote under Android. A lot of people, and we wrote a large amount of code. By the number of lines, we are the largest in Yandex. And in a natural way, as in any living organism, in our project the code is born, lives, ages, it is necessary to monitor it and ensure its well-being.
I will tell you in succession what processes we used to ensure the quality of the code and which tools we use. Any bug that occurs has a few moments when it can be solved. You can not just make a bug. You can solve the bug when it is in the open window of the editor at the developer. You can find it on unit tests. You can find it later in testing or in production.
We tried to build our processes in such a way that at all these stages the maximum number of bugs could be caught or not at all. First of all, we recorded our codestyle in the browser. In a large project, it is really very important that there is a written codestyle that is relevant, supported, and we have placed it as a codestyle MD in our repository. To edit it, you need to make a pull request so that, like a normal code, it will be rebuilt, prompted, the team will agree, and after that everyone will agree with these rules. Or we discuss and make new changes.
Codestyle, in addition to fixing the general rule for the whole team, also carries an educational function. We have a big team, we invite a lot of new people to ourselves. Newbies first read Vicki, we have a lot of descriptions, we love Vicky. And read the codestyle. There are examples of how to do and how not to. After the developer, in accordance with the codestyle, wrote a new feature, he should commit it. We have made precommit hooks that will not allow code with deviations from accepted rules. This may be a codestyle, and some things that static analysis easily catches. That is, just not letting the code get into the commit, git refuses to accept such code.
After that, we necessarily pass the code. We use Bitbucket, we have a rule that any code can get into the repository only after upruva from two colleagues. Two living people have to come, look at the code, get to it. And surely this pull request should come together and pass all 100% of our unit tests. And we have a lot of tests. And the reviewers are watching, and all the precommit hooks. Some of you may wonder how long it takes? Big project after all. I can proudly say that we have the minimum time from creating a pull request to getting the code in the repository now is about 30 minutes. This is the minimum time for which the code gets into our master. We went to this for a long time. And we have the usual Chromium-based browser. Everyone who writes such browsers has very big problems with the build time. A million lines of code, they need to be compiled, they are compiled for a long time. And 400 thousand lines of Java code need to be compiled and run the tests. This is the result of the work of the whole team. We are all working to ensure that our processes allow us to think more about the result, and not about how to wait for builds, locally or on TeamCity.
What is important, 30 minutes is the time for TeamCity, and the local developer build takes 30 seconds. He does not banish all unit tests, he does not assemble all the assemblies for all platforms, all combinations. And on TeamCity we collect it. Plus, tests are run on TeamCity. Now, from these 30 minutes, unit tests take about 20 minutes. In addition, to provide quality code, we have introduced a technical quota. We spend 30% of the time on the return on the technical debt that we have managed to accumulate, and which we are trying to do again and again. Each sprint 30% of the team is engaged in refactoring, improving existing code, writing unit tests that were not in place, or improving tools.
In general, to improve any thing, there is a very important rule - before you improve something, you need to measure it. I ask for your help. I ask you to suggest what things you would suggest to measure in order to understand how you have a quality code and a quality product in order to improve this product. For example, I will mention the obvious thing: what is your test coverage in percent. Any other options to understand, you have a quality code or not? The number of lines in the method. The number of classes. The speed of execution, how long your application runs, how quickly lists will scroll. The number of interfaces - in principle, the same metric. Power consumption is good? Build time too.
For all that you have called, we have the tools. We can measure what is in our project now, as it was a year ago and what is happening now. First of all, we measure the state of health of the application in production, we use AppMetrica, it is a publicly available service that allows you to follow events, follow crashes, and feel the application. We use AppMetrica to collect a lot of things, technical indicators.
Then with the help of ClickHouse and our own self-made tools we make reports from this data. We have a little more than the average AppMetrica user, only due to the fact that we have invested in access to this database and make special requests. AppMetrica allows you to collect the fact of an event. Event happened - so many pieces. But AppMetrica does not allow to look at the numerical data. For example, we need to measure the power consumption in some parrots. And you need to understand how in the current version different users have how many of these parrots turned out. What is the distribution of users according to power consumption. What is the distribution of users by start time? What is the distribution of users according to the speed of scrolling in FPS or in time between frames. And to collect such numerical data in order to analyze them, we used histograms.
My colleague spoke very well about them, they are in Yandex according to the word “histograms”, the very first video is the story told by colleagues from my team about how we collect numerical indicators and analyze them. The same Ilya Bogin will be able to tell in detail how to collect these numbers. And then we have an obvious indicator - open bugs. There is a product, there is testing, there are users. They report bugs. The more bugs, the worse the product. The more blocker bugs, the worse the product. Blocker bugs compare with minors ... We have a separate metric showing the quality of the product in bugs, zero bug policy, conditionally.
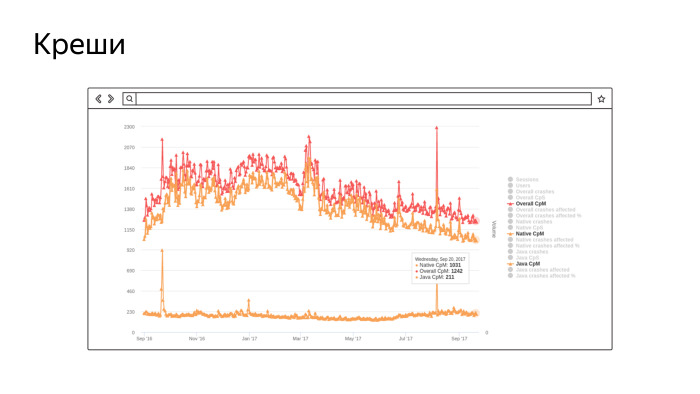
This is a screenshot from our real tool, in which the amount of crashes per million sessions is collected. Not very well visible, but the bottom chart is the number of crashes in Java, about 200 per million sessions. And the top two ... At first there are a lot of crush in the native, there are quite a lot of them, because we have the Chromium core and there are a lot of “pluses”. The topmost is the amount. In general, we monitor this indicator and are working to improve it. The smaller the schedule, the better. This is the last year we work and improve.
The same, the same graphics we have for power consumption, for the speed of scrolling and everything else.
In addition, we have implemented and very actively use such a thing, SonarQube, I advise her to everyone. You can put it yourself, whether you are an indie developer or as part of a team. This is a platform on which you can turn any static code analyzers. It is open source, free and is able to analyze almost all programming languages that exist. We have implemented it, and now constantly with its help we monitor some indicators of the health of our project. Briefly walk on what is on this slide. This is very important, as it is written in the documentation, but not very obvious.
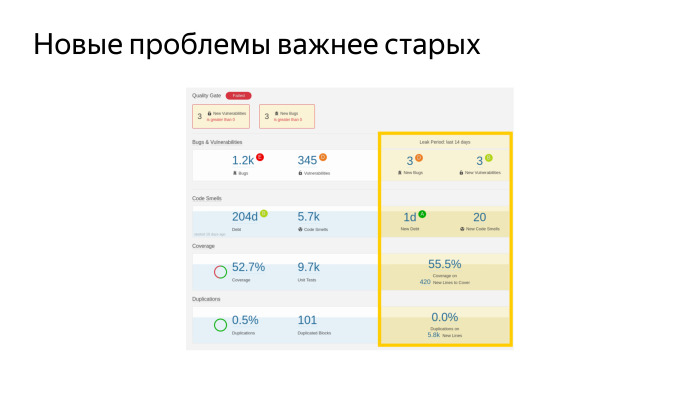
This is a real dashboard screenshot. We have so many bugs, more than a thousand. There are a number of security vulnerabilities. Here is a test coverage - 52.7%. And such a number of unit tests. This is cool, it seems. We now have the largest coverage of Yandex mobile apps. We also measure the proportion of duplicate code. What is interesting, we set up this thing for all Yandex mobile applications and we can watch duplicates between projects, is also very cool, helps us to select those parts of the code that should be put into the library in order not to duplicate.
The main metric that collects all of this is a whole lot more, and in one clear figure it says whether your project is good or bad. This is a technical duty - we have 204 days, conditional working days of a conditional developer in a vacuum, which must work for all these problems to be eliminated. Do you think it is a big debt or a small one? We have a large team, 30 people. If we take it, we will repay this debt in a limited time. We had episodes when we took and started - let's fix all the blockers in the SonarQube. And they began to fix them.
But there is one feature. This is a silver bullet. It doesn't matter how many bugs you have found static analysis in the project. It is important that you do not make new bugs. And the fix bug, which is good and has been lying there for a long time, will surely happen someday. But it did not happen, it was not found in testing, its unit tests were not found. Most likely, he will not bum. And the fix of the old bug can lead to the fact that you have a new, real, which will lead to a real crash.
The main thing is not to fix the old bugs, but make sure that there are no new ones. Our dashboard is a separate indicator - we have accumulated 1 day in the last 14 days. Yes, we do it, but very moderately. We have the technical debt ratio, the share of debt to the volume of the entire code, is steadily falling. And this is the best indicator that we are doing everything right.
Cut from real screenshots on screen. This same Sonar allows you to add comments to pull requests. Two reviewers come to us and leave comments, plus another robot comes, the third reviewer. He leaves comments on obvious issues, on codestyle, code design, finds security vulnerabilities. People love him. Does not add a new debt.
In addition, in Sonar we can see existing bugs. There is a very convenient viewer, where we see the entire code base, and for each line we can see what the issue is, when it was added and what we did with it. You can come to the author and say: buddy, in the last two weeks you have added five blockers - how is that? Deal with the causes and eliminate. We always try to solve any problem radically, eliminate the possibility of such a problem. As a rule, we prepare some tools or make it so that it is impossible to allow bugs.
We are very actively writing tests. We love tests. Recently, very much advanced in their writing.
We have such a number of tests now performed using JUnit, these are tests that run on host machines, just Java and Robolectric. And Android Instrumentation Tests. We have that amount now.
While we wrote this number of tests, we went through several stages. Tests need to be written, everyone writes them, we want a quality product - let's write too. We really have a lot of problems. We write new tests, and the old ones break all the time, they require a lot of time for support and no bugs are found. Any code change causes a breakdown of tens of hundreds of tests, and we go and fix tests. Fortunately, now we have passed this crisis, now our tests really provide both documentation of the code, and provide the developer with confidence that the code is written correctly. Now the whole team has learned to write tests and writes them very actively. The previous slide shows that the coverage on the new code is 55%. This is more than the old, we are moving in the right direction. It would be better still higher, but so far.
We are actively using Robolectric, we are happy with it, it allows us to get wet, replace the real Android, but at the same time perform the tests much faster. 9000 tests is a lot. About 600 of them run on emulators, the rest of the tests are performed on the host machine. Our build agent is fast, 16 cores, everything is quick and easy on them. If we raise the emulator, Instrumentation Tests begin to run on it for a long time and painfully. This we try to avoid. Robolectric is very good.
We also actively use interfaces. We are supporters of clean code, actively use inversion of control, dependency injection and using interfaces we separate the platform from the code we write. There are people who deny Robolectric, they say that only interfaces are needed, and Robolectric is evil. We are supporters of a reasonable approach. We are actively using the Mockito and deliberately cut out the Powermock because it provoked a bad test style. This is evil, it allows mocking statics, files, generally breaks everything around and provokes bad architecture.
The main summary of this slide is that we are all documenting - just like any thing. We write in the style of "do not do that." We have test smells, a separate page, where typical problems are fixed that arise when writing tests in the “so bad and so it would be good” mode. And when new developers come, they usually say that this thing helps a lot, because there are not just examples of how not to do it, and many are just looking at the right side how to do it. There are many tricks and tools about which it is impossible to guess, you need to understand them with experience or learn with experience. And here we tell them everything on a silver platter.
This graph speaks for itself. This is data from June last year to the current moment. We worked on the test coverage, wrote the tests. But more importantly, we did not stand still, we grew.
In addition to unit tests, we use autotests. Who does not know and does not use, this is the conditional name for tests that test the application as a black box. They launch it on a device or an emulator, and a conditional robot scrolls lists with its rubber finger, pokes buttons, tries to break your application under standard scripts. With auto tests, we replace manual testers, living people who are better off doing something more meaningful than repeating scenarios over and over. We are speeding up our regression, checking that the new release is good and can go to production. Now we are releasing every three weeks and a considerable part of this achievement is that we have translated manual tests for autotests. We have more than 60% of tests are automated.
Our tests are written in Appium, this is a fairly standard Yandex tool, it came to us from testing the web along with people who tested the web. Now we have written about 3000 tests on Appium, deployed an infrastructure that allows us to run 25 emulators each time, they rise, new and clean, tests are run and run in parallel to them. But still everything turns out very slowly. It takes us a few hours to launch a regression now, and we cannot do it all the time, for each build. We do not have enough resources and hardware to do all this. And just these tools we are very active in open source, on GitHub in Yandex QA Tools there are a lot of tools, there is an active community where we put all this.
Here is another thing that we can say we have suffered. Initially, autotests were written by individuals, not quite developers. There are handbrakes, they need to be automated. The first reaction is to replace the parking brake with a robot, let it write, and the repository rises separately from the browser, where the code is written. It seems the guys write code in Java, the same JUnit, like testers. But we eventually combined the teams, merged into one, and now we can write self-tests any developer. We specifically rotate people so that everyone knows how autotests are written, so they know how to repair auto tests when we suddenly broke them. In autotests, the main pain is that they fall off and break all the time, that they are red all the time.
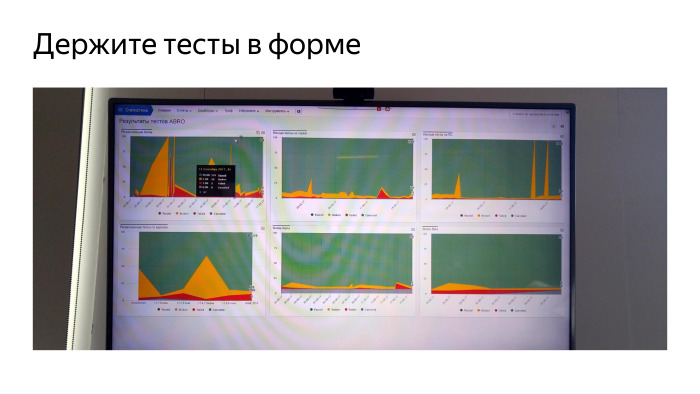
I will show one of the ways to solve this problem. This is a TV from my office, one of them. We generally love TVs with graphics. But this is a TV about autotests. Greens - successfully completed, yellow ones - captured for a reason known to us, red ones - for an unknown. We look at it all the time. They singled out a separate attendant who changes all the time, who keeps track of what is happening with the tests. — , , , . , , , . , . , , -. , , .
Espresso. , Espresso , Appium, Espresso . , . — . Espresso . , . , . - . . , .
, Espresso, Kotlin, DSL, , , . , .
— . . — .
, . , , . . , , , . - . , .
- — . , , , , . , . , .
Source: https://habr.com/ru/post/343278/
All Articles