Machine Learning: Azure Machine Learning Time Series Analysis for Anomaly Search
Anomaly detection is one of the most important functions for Internet of Things (IoT) solutions that collect and analyze temporal changes in the data stream from various sensors. In many cases, the data stream does not significantly change over time. However, if they appear, this most often means that an anomaly has arisen in the system that can disrupt its operation. In this article, I’ll explain how to use the Time Series Anomaly Detection module of the Azure Machine Learning machine learning service to determine anomalous sensor readings.

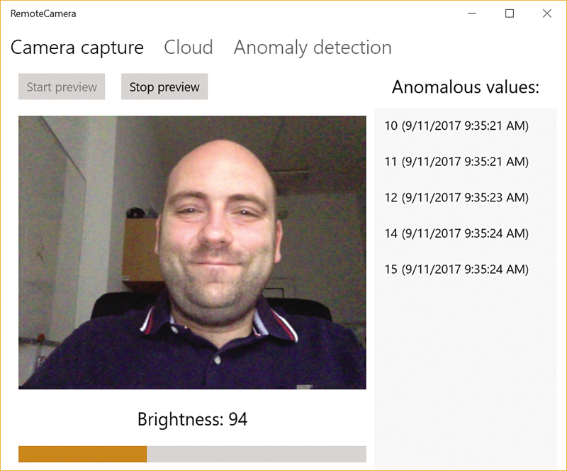
To reveal the topic, I will expand the functionality of the RemoteCamera Universal Windows Platform (UWP) application, which I developed to the previous article , and add a list in which anomalous values will be displayed. The RemoteCamera application receives an image from a webcam and calculates its brightness, which, subject to the unchanged scene in the frame, oscillates around certain values. Brightness is easily changed, for example, by covering the camera with your hand, which will lead to a noticeable deviation in the data stream. This helps to get a good sample for the detection of anomalies in the time series.
')
According to a recent article by James McCaffrey, the standard method for detecting anomalies is based on time series regression. Having superimposed the model on the data, you can predict the trends and then check whether all the indicators correspond to them. To do this, you need to compare the predicted and actual figures. A significant difference will indicate a deviation or an anomaly.
First, I will show how to find such deviations by analyzing z-scores. The higher this score, the higher the probability that there is a deviation in the value stream. To find the anomalies, you need to determine the boundaries of z-scores, taken as normal. All z-scores outside the specified limits will be considered abnormal. It should be taken into account that due to the fixed threshold specified in this scenario, numerous false alarms are possible. To reduce their number, apply more complex algorithms. In our case, the Azure Time Series Anomaly Detection module is based on permutation martingales that analyze whether a series of data can be arbitrarily reorganized without losing the probability of finding a certain value. Simply put, can each value be detected in the data set with equal probability. The commutative data set is characterized by a low coefficient of anomalies. If commutativity is broken, the anomaly coefficient increases, indicating non-standard values.
In this article I will explain how to create such machine learning algorithms. I will use the Microsoft Azure Machine Learning Studio solution. James McCaffrey also spoke about this product in September 2014. I will expand the topic of this article and demonstrate machine learning experiments. In addition, I will show how to deploy the solution in the form of a web service, and then how to use this service in the RemoteCamera application.
First, we extend the RemoteCamera application by adding a tab where you can collect data for training, and also enable or disable anomaly detection mode using the checkbox.
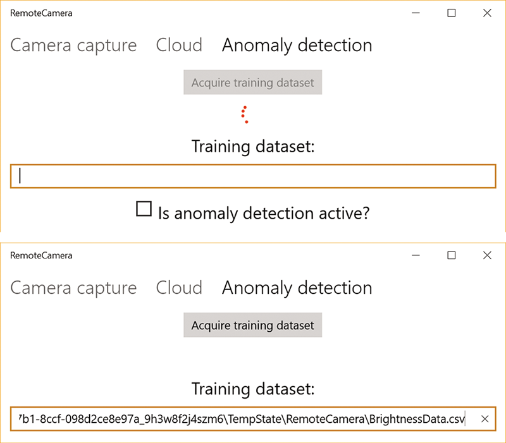
The Acquire training dataset button becomes active if you start a preview of the image from the camera (using the control buttons on the main tab). When you click this button, the application starts collecting data for training. This process takes place in the background, its course is accompanied by a circular animation. As a result, a training dataset consisting of 100 data points will be created. Each of them will be represented by an instance of the BrightnessDataPoint structure:
The BrightnessDataPoint structure stores the brightness value, as well as the time in which it was recorded. Then the set of such values is exported to the file BrightnessData.csv, which looks like this:
Then, the exact location of the training dataset is displayed in the text box. I use comma separated values (CSV file). They are easy to upload to Machine Learning Studio.
To implement this functionality, I wrote two classes: BrightnessFileStorage and AnomalyDetector. The first class, BrightnessFileStorage, is defined by the BrightnessFileStorage.cs file in the AnomalyDetection subfolder of the accompanying code. The BrightnessFileStorage class saves a set of BrightnessDataPoint objects to a CSV file using the DataWriter class.
The second class AnomalyDetector handles logic related to the detection of anomalies. In particular, it includes the public method Add-TrainingValue, which is called immediately after calculating the image brightness (see the event handler ImageProcessor_ProcessingDone in the MainPage.xaml.cs file in the accompanying code). AddTrainingValue works as follows. First, I create an instance of BrightnessDataPoint, which is then added to the set. When the set has 100 items, I save it to a CSV file. Then I trigger the TrainingDataReady event, which is handled in the MainPage. The goal is to interrupt data collection for training and display the file location in the user interface:
The location of the training dataset will be displayed in a text box, from where it can be easily copied, pasted into Windows Explorer, and viewed data obtained.
After receiving the training data set, I will prepare the first experiment in Machine Learning Studio according to the instructions described in the article by James McCaffrey in 2014. First, I upload the file BrightnessData.csv, then plan an experiment using the visual designer. In short, all the components are in the menu on the left side of the Machine Learning Studio window. To place an element on the plan of your experiment, simply drag it to the experiment area (this is the central part of the Machine Learning Studio window). Each component has its own input and output data. You need to connect compatible nodes to control the flow of data between modules. Components can have additional settings that can be set in the properties window (on the right side of the Machine Learning Studio window).
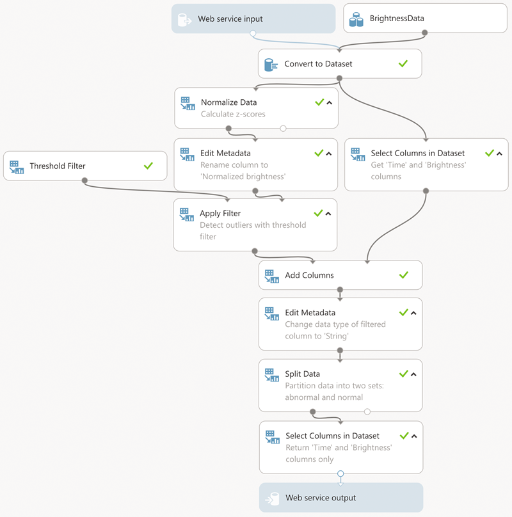
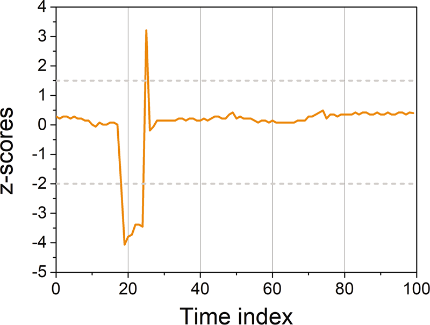
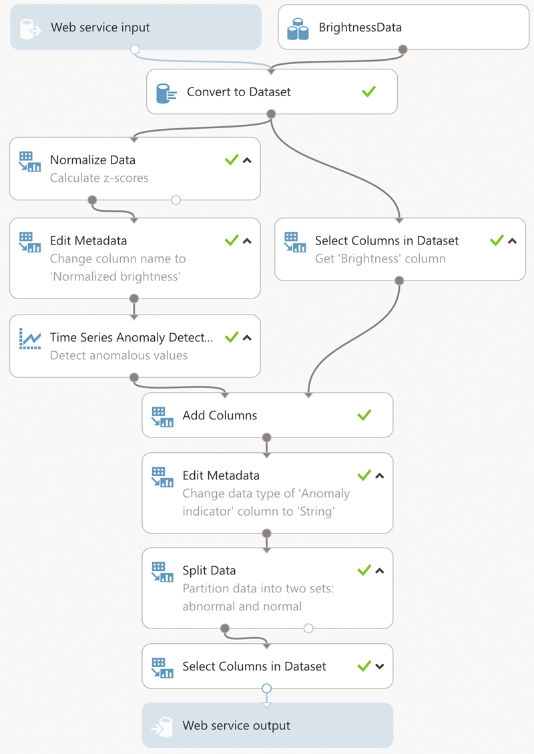
The machine learning algorithm shown above can work in two modes: experiment and web service. The difference is only in the input data. In experiment mode, the loaded training data set (BrightnessData) appears in their role, and in the web service mode, its own input data. Regardless of the mode, the input data is converted to a data set, after which the brightness column values are normalized by conversion to z-scores . In the course of this transformation, the brightness values are recalculated into z-scores, which show their scatter relative to the average value. The scatter is measured in standard deviations. The greater this variation, the higher the likelihood that the current value is anomalous. I apply normalization of z-scores, since often the baseline or normal brightness level depends on what the camera captures. Thus, converting to a z-score provides the correct brightness level when normalization is close to 0. Untreated brightness values differ in the approximate range from 40 to 150. After normalization, all brightness values fall into the range from approximately –4.0 to +4.0. Therefore, in order to find the anomalous values, I just need to apply a threshold filter. I use the OutOfRange threshold filter in Azure Machine Learning with a lower threshold of –2 and a high of 1.5. I chose these values based on the z-score graph and set them in the threshold filter properties panel in Machine Learning Studio.
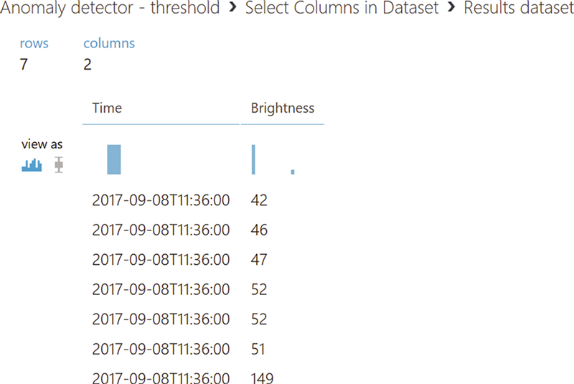
After specifying the threshold, the data set is a data column of a logical type, where it is indicated whether at a particular moment the point is outside the specified range. To supplement this information with actual brightness values that were identified as anomalous, I combine this column with the initial data set, and then break the resulting set into two subsets. One contains only anomalous values, the second - standard. Before the breakdown, I change the data type in the column, because the Split Data module does not support boolean values. After that, as a result of the experiment, the first subset is issued. In the case of a web service, this result is passed to the client. To view the values of a dataset, you must use the Results dataset | Visualize from the dataset context menu in Machine Learning Studio. This option will be available if you have already run this experiment.
And now let's learn how to use the Azure Time Series Anomaly Detection (ATSAD) module to detect anomalies. As shown below, the process of this experiment resembles the previous one. The initial data set is normalized by conversion to z-scores and transferred to the ATSAD module (it is located in the Time Series node in Machine Learning Studio). To do this, you need to configure several input parameters in the properties window (bit.ly/2xUGTg2). First you need to specify the data and time columns, then configure the martingale type. In our case, I will use the martingale Power. Another text field will become available - Epsilon, where you can enter any detector sensitivity value in the range from 0 to 1. Then you need to configure three parameters of the function for determining the strangeness of values:
Next, you need to specify the maximum number of martingale and strangeness values in the journal. You can enter any integer from 10 to 1000. Through trial and error, I stopped at the following detector settings:
The last detector parameter is the warning threshold. It sets the minimum anomaly value coefficient. The default warning threshold is 3.5. For my experiment, I changed this value to 2.
By requesting to visualize the output of the ATSAD module, you can see that two columns are added to the input data set: an anomaly coefficient measuring the deviations, and a warning indicator with a binary value (0 or 1) indicating an anomaly value. Based on the readings of the second indicator, I break the data set into two subsets: standard and anomalous values. As a result of the experiment, only a subset of anomalous values is issued. In other details, the experiment is identical to the previous one, and I will not describe them again. I note only that the most important aspect of the experiment for the web service is the description of the input and output data. Let's call this data as follows: Data (web service input) and AnomalyDetectionResult (web service output).
After setting up the experiments, I can deploy them as web services, access them through the RemoteCamera application, and detect anomalous image luminance values. To create a web service, you need to run the experiment, and then click the Deploy Web Service icon in the lower pane of the Machine Learning Studio window. If you have not added a web service input and output modules to your experiment, the Set Up Web Service button will appear in this area. After clicking it, the input and output modules of the web service will be added to the experiment, and the name of the button will change to Deploy Web Service.

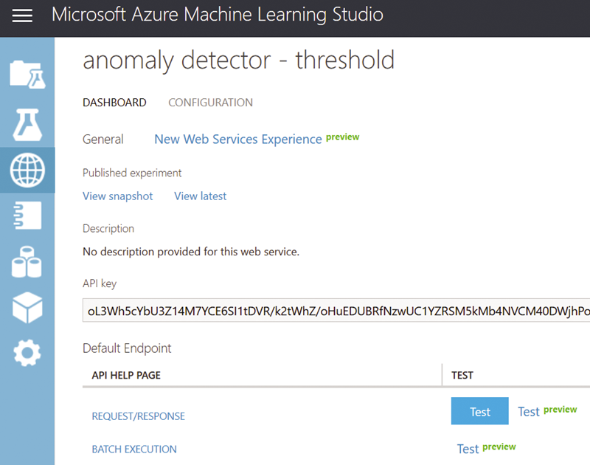
When the deployment of the web service is complete, the web service control panel opens. This panel displays a summary of the deployed web service, an API key, as well as instructions for sending requests and processing responses (API Help Page). In particular, when you click the request / response hyperlink, the web service URL and the detailed structure of requests and responses in JSON format are displayed.
Next, I save the API key and create mappings from JSON to C # using the JSONUtils service (jsonutils.com). Then I save the resulting classes in the appropriate files - AnomalyDetectionRequest.cs and AnomalyDetectionResponse.cs in the AnomalyDetection subfolder. Their structures are similar - both files usually contain classes with properties that for the most part are implemented automatically. AnomalyDetectionRequest and AnomalyDetectionResponse are the transfer of the corresponding JSON objects between the client and the web service. For example, the definition of the AnomalyDetectionRequest class and dependent objects is shown below. Notice that I use the ConversionHelper helper class to convert the dataset of brightness data points to the input data format for the Machine Learning Studio web service (two-dimensional arrays of strings). The complete definition of this auxiliary class is contained in the accompanying code. This class has two public methods. With their help, a set of brightness data points is converted to the type string [,] (BrightnessDataToStringTable) and back (AnomalyDetectionResponseToBrightnessData).
After creating the mapping of objects from JSON to C #, you can start writing the web service client. To do this, I first install the Microsoft.AspNet.WebApi.Client NuGet package, and then use it to define the AnomalyDetectionClient class (see the corresponding file in the accompanying code). There are three private fields in this class: baseAddress, apiKey and httpClient. The first field contains the URL of the Machine Learning Studio web service, the second contains the API key. Both of these values are used to create an instance of the HttpClient class (from the previously installed NuGet package):
After creating the client, I can start sending requests to the Machine Learning Studio web service using the AnomalyDetectionClient.DetectAnomalyAsync method. This method provides a set of brightness data points as test data. This test data is used instead of the CSV file that I used for the experiments. They create an instance of the AnomalyDetection request. An instance of this class is then sent to the web service for analysis using the PostAsJsonAsync extension method. The resulting JSON response is converted to an instance of the AnomalyDetectionResponse class, which is eventually issued by the DetectAnomalyAsync function. See if there are any errors. If necessary, throw out exceptions.
AnomalyDetectionClient is used in the AddTestValue method of the AnomalyDetector class. Like AddTrainingValue, AddTestValue is also called by the ImageProcessor_ProcessingDone event handler (see the MainPage.xaml.cs file in the accompanying code). However, AddTestValue works a little differently than the AddTrainingValue method. In AddTrainingValue, I add brightness data points to an instance of the BrightnessDataset class, which internally uses the generic List class to enter a sliding interval. Test values are stored in this interval (see James McCaffrey’s October article). By default, the sliding interval has 30 elements, but this value can be changed using the designer BrightnessDataset. As shown below, I send the data for analysis after filling the interval. Then I check for the presence of elements in the anomalous value set issued by the web service. If items are present, I trigger the AnomalyDetected event, which is also used to pass anomalies to the listeners.
To display the anomalous values in the interface, I process the AnomalyDetected event in the MainPage class as follows.
I iterate through the set of obtained values, checking whether they have already been added to the local data repository (the AnomalousValues property of the view model). If not, then I add them to the set of observed values. As a result, only new anomalous values appear in the list shown in the first picture. This additional check is necessary because only one element has changed in the sliding interval between two consecutive requests to the web service.
To test my solution, you need to start the RemoteCamera application, start previewing the image from the camera and enable the search for anomalies by checking the box on the Anomaly Detection tab. You can then create anomalous values by covering the camera with your hand. A machine learning detector will quickly detect these abnormal values and display them in a list box.
I’ve shown how to create two different anomaly detection experiments in Azure Machine Learning Studio. Both experiments were also deployed as web services and combined with the RemoteCamera client application, which sends locally obtained time series data for machine analysis in order to detect anomalies. In this case, I used the Universal Windows Platform (UWP) web service. The same code can be used to access a web service through an ASP.NET web application, in which the machine learning logic is processed by the server part and not at the end point. In the context of IoT, this point can be a simple sensor.
November 28-30, in Kiev, for the first time, there will be a school of developers in the Open Hack format.
Teams of 2–5 people will be able to work on the project existing in their company or get acquainted with the technological stack of another relevant project.
The main topics will be:
To participate in the event you need to register .
To reveal the topic, I will expand the functionality of the RemoteCamera Universal Windows Platform (UWP) application, which I developed to the previous article , and add a list in which anomalous values will be displayed. The RemoteCamera application receives an image from a webcam and calculates its brightness, which, subject to the unchanged scene in the frame, oscillates around certain values. Brightness is easily changed, for example, by covering the camera with your hand, which will lead to a noticeable deviation in the data stream. This helps to get a good sample for the detection of anomalies in the time series.
')
Anomaly search
According to a recent article by James McCaffrey, the standard method for detecting anomalies is based on time series regression. Having superimposed the model on the data, you can predict the trends and then check whether all the indicators correspond to them. To do this, you need to compare the predicted and actual figures. A significant difference will indicate a deviation or an anomaly.
First, I will show how to find such deviations by analyzing z-scores. The higher this score, the higher the probability that there is a deviation in the value stream. To find the anomalies, you need to determine the boundaries of z-scores, taken as normal. All z-scores outside the specified limits will be considered abnormal. It should be taken into account that due to the fixed threshold specified in this scenario, numerous false alarms are possible. To reduce their number, apply more complex algorithms. In our case, the Azure Time Series Anomaly Detection module is based on permutation martingales that analyze whether a series of data can be arbitrarily reorganized without losing the probability of finding a certain value. Simply put, can each value be detected in the data set with equal probability. The commutative data set is characterized by a low coefficient of anomalies. If commutativity is broken, the anomaly coefficient increases, indicating non-standard values.
In this article I will explain how to create such machine learning algorithms. I will use the Microsoft Azure Machine Learning Studio solution. James McCaffrey also spoke about this product in September 2014. I will expand the topic of this article and demonstrate machine learning experiments. In addition, I will show how to deploy the solution in the form of a web service, and then how to use this service in the RemoteCamera application.
Training using a dataset
First, we extend the RemoteCamera application by adding a tab where you can collect data for training, and also enable or disable anomaly detection mode using the checkbox.
The Acquire training dataset button becomes active if you start a preview of the image from the camera (using the control buttons on the main tab). When you click this button, the application starts collecting data for training. This process takes place in the background, its course is accompanied by a circular animation. As a result, a training dataset consisting of 100 data points will be created. Each of them will be represented by an instance of the BrightnessDataPoint structure:
public struct BrightnessDataPoint { public DateTime Time { get; private set; } public byte Brightness { get; private set; } public BrightnessDataPoint(byte brightness) { Time = DateTime.Now; Brightness = brightness; } } The BrightnessDataPoint structure stores the brightness value, as well as the time in which it was recorded. Then the set of such values is exported to the file BrightnessData.csv, which looks like this:
Time,Brightness 9/8/2017 11:30:00,103 9/8/2017 11:30:01,103 9/8/2017 11:30:02,102 9/8/2017 11:30:03,42 9/8/2017 11:30:04,46 9/8/2017 11:30:05,149 9/8/2017 11:30:06,99 9/8/2017 11:30:07,101 9/8/2017 11:30:08,104 Then, the exact location of the training dataset is displayed in the text box. I use comma separated values (CSV file). They are easy to upload to Machine Learning Studio.
To implement this functionality, I wrote two classes: BrightnessFileStorage and AnomalyDetector. The first class, BrightnessFileStorage, is defined by the BrightnessFileStorage.cs file in the AnomalyDetection subfolder of the accompanying code. The BrightnessFileStorage class saves a set of BrightnessDataPoint objects to a CSV file using the DataWriter class.
The second class AnomalyDetector handles logic related to the detection of anomalies. In particular, it includes the public method Add-TrainingValue, which is called immediately after calculating the image brightness (see the event handler ImageProcessor_ProcessingDone in the MainPage.xaml.cs file in the accompanying code). AddTrainingValue works as follows. First, I create an instance of BrightnessDataPoint, which is then added to the set. When the set has 100 items, I save it to a CSV file. Then I trigger the TrainingDataReady event, which is handled in the MainPage. The goal is to interrupt data collection for training and display the file location in the user interface:
private async void AnomalyDetector_TrainingDataReady( object sender, TrainingDataReadyEventArgs e) { await ThreadHelper.InvokeOnMainThread(() => { remoteCameraViewModel.IsTrainingActive = false; remoteCameraViewModel.TrainingDataSetFilePath = e.FilePath; }); } private const int trainingDataSetLength = 100; private List<BrightnessDataPoint> trainingDataSet = new List<BrightnessDataPoint>(); public event EventHandler<TrainingDataReadyEventArgs> TrainingDataReady; public async Task AddTrainingValue(byte brightness) { trainingDataSet.Add(new BrightnessDataPoint(brightness)); // Check if all data points were acquired if (trainingDataSet.Count == trainingDataSetLength) { // If so, save them to csv file var brightnessFileStorage = await BrightnessFileStorage.CreateAsync(); await brightnessFileStorage.WriteData(trainingDataSet); // ... and inform listeners that the training data set is ready TrainingDataReady?.Invoke(this, new TrainingDataReadyEventArgs( brightnessFileStorage.FilePath)); } } The location of the training dataset will be displayed in a text box, from where it can be easily copied, pasted into Windows Explorer, and viewed data obtained.
Z-score analysis
After receiving the training data set, I will prepare the first experiment in Machine Learning Studio according to the instructions described in the article by James McCaffrey in 2014. First, I upload the file BrightnessData.csv, then plan an experiment using the visual designer. In short, all the components are in the menu on the left side of the Machine Learning Studio window. To place an element on the plan of your experiment, simply drag it to the experiment area (this is the central part of the Machine Learning Studio window). Each component has its own input and output data. You need to connect compatible nodes to control the flow of data between modules. Components can have additional settings that can be set in the properties window (on the right side of the Machine Learning Studio window).
The machine learning algorithm shown above can work in two modes: experiment and web service. The difference is only in the input data. In experiment mode, the loaded training data set (BrightnessData) appears in their role, and in the web service mode, its own input data. Regardless of the mode, the input data is converted to a data set, after which the brightness column values are normalized by conversion to z-scores . In the course of this transformation, the brightness values are recalculated into z-scores, which show their scatter relative to the average value. The scatter is measured in standard deviations. The greater this variation, the higher the likelihood that the current value is anomalous. I apply normalization of z-scores, since often the baseline or normal brightness level depends on what the camera captures. Thus, converting to a z-score provides the correct brightness level when normalization is close to 0. Untreated brightness values differ in the approximate range from 40 to 150. After normalization, all brightness values fall into the range from approximately –4.0 to +4.0. Therefore, in order to find the anomalous values, I just need to apply a threshold filter. I use the OutOfRange threshold filter in Azure Machine Learning with a lower threshold of –2 and a high of 1.5. I chose these values based on the z-score graph and set them in the threshold filter properties panel in Machine Learning Studio.
After specifying the threshold, the data set is a data column of a logical type, where it is indicated whether at a particular moment the point is outside the specified range. To supplement this information with actual brightness values that were identified as anomalous, I combine this column with the initial data set, and then break the resulting set into two subsets. One contains only anomalous values, the second - standard. Before the breakdown, I change the data type in the column, because the Split Data module does not support boolean values. After that, as a result of the experiment, the first subset is issued. In the case of a web service, this result is passed to the client. To view the values of a dataset, you must use the Results dataset | Visualize from the dataset context menu in Machine Learning Studio. This option will be available if you have already run this experiment.
Time Series Analysis in Machine Learning
And now let's learn how to use the Azure Time Series Anomaly Detection (ATSAD) module to detect anomalies. As shown below, the process of this experiment resembles the previous one. The initial data set is normalized by conversion to z-scores and transferred to the ATSAD module (it is located in the Time Series node in Machine Learning Studio). To do this, you need to configure several input parameters in the properties window (bit.ly/2xUGTg2). First you need to specify the data and time columns, then configure the martingale type. In our case, I will use the martingale Power. Another text field will become available - Epsilon, where you can enter any detector sensitivity value in the range from 0 to 1. Then you need to configure three parameters of the function for determining the strangeness of values:
- RangePercentile: This parameter should be used to detect values that are obviously out of range, such as bursts or dips. In this experiment, this parameter will work by analogy with the previous experiment, but the analysis will be more complete.
- SlowPos- and SlowNegTrend: Use this parameter to detect trends in your dataset in the direction of positive or negative values. This is useful when your solution tracks an increase or decrease in observed values.
Next, you need to specify the maximum number of martingale and strangeness values in the journal. You can enter any integer from 10 to 1000. Through trial and error, I stopped at the following detector settings:
- Epsilon = 0.4
- The length of the journal of martingale and strangeness values = 50
The last detector parameter is the warning threshold. It sets the minimum anomaly value coefficient. The default warning threshold is 3.5. For my experiment, I changed this value to 2.
By requesting to visualize the output of the ATSAD module, you can see that two columns are added to the input data set: an anomaly coefficient measuring the deviations, and a warning indicator with a binary value (0 or 1) indicating an anomaly value. Based on the readings of the second indicator, I break the data set into two subsets: standard and anomalous values. As a result of the experiment, only a subset of anomalous values is issued. In other details, the experiment is identical to the previous one, and I will not describe them again. I note only that the most important aspect of the experiment for the web service is the description of the input and output data. Let's call this data as follows: Data (web service input) and AnomalyDetectionResult (web service output).
Web Service Client
After setting up the experiments, I can deploy them as web services, access them through the RemoteCamera application, and detect anomalous image luminance values. To create a web service, you need to run the experiment, and then click the Deploy Web Service icon in the lower pane of the Machine Learning Studio window. If you have not added a web service input and output modules to your experiment, the Set Up Web Service button will appear in this area. After clicking it, the input and output modules of the web service will be added to the experiment, and the name of the button will change to Deploy Web Service.
When the deployment of the web service is complete, the web service control panel opens. This panel displays a summary of the deployed web service, an API key, as well as instructions for sending requests and processing responses (API Help Page). In particular, when you click the request / response hyperlink, the web service URL and the detailed structure of requests and responses in JSON format are displayed.
Next, I save the API key and create mappings from JSON to C # using the JSONUtils service (jsonutils.com). Then I save the resulting classes in the appropriate files - AnomalyDetectionRequest.cs and AnomalyDetectionResponse.cs in the AnomalyDetection subfolder. Their structures are similar - both files usually contain classes with properties that for the most part are implemented automatically. AnomalyDetectionRequest and AnomalyDetectionResponse are the transfer of the corresponding JSON objects between the client and the web service. For example, the definition of the AnomalyDetectionRequest class and dependent objects is shown below. Notice that I use the ConversionHelper helper class to convert the dataset of brightness data points to the input data format for the Machine Learning Studio web service (two-dimensional arrays of strings). The complete definition of this auxiliary class is contained in the accompanying code. This class has two public methods. With their help, a set of brightness data points is converted to the type string [,] (BrightnessDataToStringTable) and back (AnomalyDetectionResponseToBrightnessData).
public class AnomalyDetectionRequest { public Inputs Inputs { get; set; } public GlobalParameters GlobalParameters { get; set; } public AnomalyDetectionRequest( IList<BrightnessDataPoint> brightnessData) { Inputs = new Inputs() { Data = new Data() { ColumnNames = new string[] { "Time", "Brightness" }, Values = ConversionHelper. BrightnessDataToStringTable(brightnessData) } }; } } public class Inputs { public Data Data { get; set; } } public class Data { public string[] ColumnNames { get; set; } public string[,] Values { get; set; } } public class GlobalParameters { } After creating the mapping of objects from JSON to C #, you can start writing the web service client. To do this, I first install the Microsoft.AspNet.WebApi.Client NuGet package, and then use it to define the AnomalyDetectionClient class (see the corresponding file in the accompanying code). There are three private fields in this class: baseAddress, apiKey and httpClient. The first field contains the URL of the Machine Learning Studio web service, the second contains the API key. Both of these values are used to create an instance of the HttpClient class (from the previously installed NuGet package):
public AnomalyDetectionClient() { httpClient = new HttpClient() { BaseAddress = new Uri(baseAddress), }; httpClient.DefaultRequestHeaders.Authorization = new AuthenticationHeaderValue("Bearer", apiKey); } After creating the client, I can start sending requests to the Machine Learning Studio web service using the AnomalyDetectionClient.DetectAnomalyAsync method. This method provides a set of brightness data points as test data. This test data is used instead of the CSV file that I used for the experiments. They create an instance of the AnomalyDetection request. An instance of this class is then sent to the web service for analysis using the PostAsJsonAsync extension method. The resulting JSON response is converted to an instance of the AnomalyDetectionResponse class, which is eventually issued by the DetectAnomalyAsync function. See if there are any errors. If necessary, throw out exceptions.
public async Task<IList<BrightnessDataPoint>> DetectAnomalyAsync(IList<BrightnessDataPoint> brightnessData) { var request = new AnomalyDetectionRequest(brightnessData); var response = await httpClient.PostAsJsonAsync(string.Empty, request); IList<BrightnessDataPoint> result; if (response.IsSuccessStatusCode) { var anomalyDetectionResponse = await response.Content.ReadAsAsync<AnomalyDetectionResponse>(); result = ConversionHelper. AnomalyDetectionResponseToBrightnessData(anomalyDetectionResponse); } else { throw new Exception(response.ReasonPhrase); } return result; } AnomalyDetectionClient is used in the AddTestValue method of the AnomalyDetector class. Like AddTrainingValue, AddTestValue is also called by the ImageProcessor_ProcessingDone event handler (see the MainPage.xaml.cs file in the accompanying code). However, AddTestValue works a little differently than the AddTrainingValue method. In AddTrainingValue, I add brightness data points to an instance of the BrightnessDataset class, which internally uses the generic List class to enter a sliding interval. Test values are stored in this interval (see James McCaffrey’s October article). By default, the sliding interval has 30 elements, but this value can be changed using the designer BrightnessDataset. As shown below, I send the data for analysis after filling the interval. Then I check for the presence of elements in the anomalous value set issued by the web service. If items are present, I trigger the AnomalyDetected event, which is also used to pass anomalies to the listeners.
public event EventHandler<AnomalyDetectedEventArgs> AnomalyDetected; private BrightnessDataset dataSet = new BrightnessDataset(); public async Task AddTestValue(byte brightness) { dataSet.Add(new BrightnessDataPoint(brightness)); if (dataSet.IsFull) { try { var anomalousValues = await anomalyDetectionClient. DetectAnomalyAsync(dataSet.Data); if (anomalousValues.Count > 0) { AnomalyDetected?.Invoke(this, new AnomalyDetectedEventArgs(anomalousValues)); } } catch (Exception ex) { Debug.WriteLine(ex); } } } To display the anomalous values in the interface, I process the AnomalyDetected event in the MainPage class as follows.
private async void AnomalyDetector_AnomalyDetected( object sender, AnomalyDetectedEventArgs e) { await ThreadHelper.InvokeOnMainThread(() => { foreach (var anomalousValue in e.AnomalousValues) { if (!remoteCameraViewModel.AnomalousValues.Contains(anomalousValue)) { remoteCameraViewModel.AnomalousValues.Add(anomalousValue); } } }); } I iterate through the set of obtained values, checking whether they have already been added to the local data repository (the AnomalousValues property of the view model). If not, then I add them to the set of observed values. As a result, only new anomalous values appear in the list shown in the first picture. This additional check is necessary because only one element has changed in the sliding interval between two consecutive requests to the web service.
To test my solution, you need to start the RemoteCamera application, start previewing the image from the camera and enable the search for anomalies by checking the box on the Anomaly Detection tab. You can then create anomalous values by covering the camera with your hand. A machine learning detector will quickly detect these abnormal values and display them in a list box.
Conclusion
I’ve shown how to create two different anomaly detection experiments in Azure Machine Learning Studio. Both experiments were also deployed as web services and combined with the RemoteCamera client application, which sends locally obtained time series data for machine analysis in order to detect anomalies. In this case, I used the Universal Windows Platform (UWP) web service. The same code can be used to access a web service through an ASP.NET web application, in which the machine learning logic is processed by the server part and not at the end point. In the context of IoT, this point can be a simple sensor.
Microsoft Developer School
November 28-30, in Kiev, for the first time, there will be a school of developers in the Open Hack format.
Teams of 2–5 people will be able to work on the project existing in their company or get acquainted with the technological stack of another relevant project.
The main topics will be:
- serverless computing, containers and microservices;
- IoT;
- big data and machine learning;
- augmented and virtual reality.
To participate in the event you need to register .
Source: https://habr.com/ru/post/343188/
All Articles