Log4j2 log aggregation by ELK
For our ETL (Extract, Transform, Loading) processes, we use Apache Storm at stages E and T, that is, extract and transform data, and since most of the errors associated with disabling raw data occur at this stage, desire to centrally log all this using the ELK stack (Elasticsearch, Logstash, Kibana).
What was my surprise that nowhere is it that in Russian, but even in the original tutorials, work with logs in the log4j2 format, which is a default in the world of Java applications, was not described.
Fixing this omission - under the cut tutorial on setting up a centralized collection of any log4j2 logs based on:
')

There was already written about the installation of ELK inside the Docker container, but the author of this article used filebeat, but for several reasons I didn’t want to drag some additional software to the application-hosts, and besides log4j2 can send data directlywithout SMS and registration in TCP socket.
After a brief search, I found that with the latest version of ELK (at the time of writing this article is ELK 6.0.0), only the Docker sebp / elk image works out of the box - we use it, but we will fix the image to work without filebeat use TCP Source for this.
Just create two files - one for receiving logs via TCP, and another for writing to Elasticsearch
Pay attention to the kv filter (key value) - it is he who will allow us to correctly process the logs in the log4j2 format, as we divide the parameters we need into key-value pairs.
The recursive parameter is required so that the filter does not try to search for nested key-value pairs in the value field.
Also at this stage we can add to Dockerfile the installation of necessary plug-ins for Elasticsearch or Kibana (for Logstash too, but as far as I understood, all the official plug-ins are already installed in the image, so if you need something very custom) as described here .
For what, let's change the Dockerfile a bit (I will only give diff):
That is, we remove from the image the standard input intended for working with filebeats, syslog and nginx and add our own configuration files there
Then it remains only to collect a new image:
In this case, I also published it in the local docker-registry (or you can publish it on the docker hub)
The launch takes place as standard, but first create a directory on the host machine, where we will store the Elasticseach data so that it does not disappear after the container is stopped
And run ELK:
Pay attention to
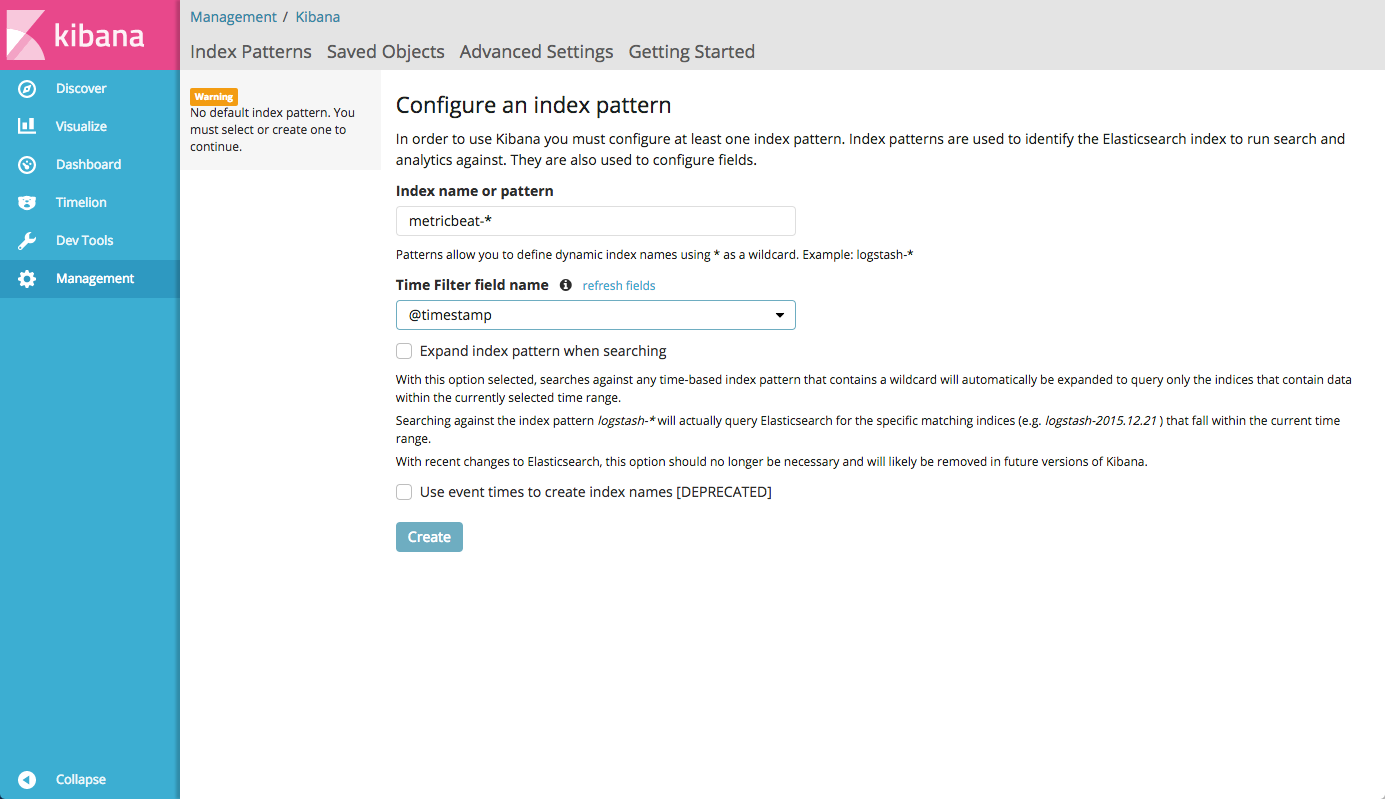
After about 40 seconds, the container will start and you can log in to Kibana at host01.lan : 5601 / app / kibana # and see something like this:
Since we specified the format
As part of the installation of the Storm written many manuals, and the official documentation is quite detailed. This part is optional and if you are not interested in setting up the Storm, you can safely move on to the next part.
We use the Storm 1.0 branch (for historical reasons and because everyone is too lazy to port the code to 1.1.x, as it just works), so I will install the latest version from this branch - 1.0.5 (at the time of this writing)
Installation is quite simple:
We will also need a Zookeeper server for the quorum to work. Their configuration is a topic for a separate article, so here I will not describe them, just assume that they are set up on servers with the names
Create a configuration file storm.yaml
Here, in addition to the Zookeeper cluster, you need to specify the Nimbus server, which act as a kind of topology coordinator in the Storm
By default, Apache Storm is not demonized on its own, and the official manual says nothing about auto-launch in daemon mode. Therefore, we use Python supervisord , although of course you can use any process orchestrator (RunIT, daemonize etc)
I have a supervisord on CentOS 7.3 via pip, but the meld3 dependency will have to be delivered from the package. On your system, the installation may (and will) be different, but only in minor details:
Next, we need to create configuration files to start Apache Storm, and here we must dwell on the fact that the Storm has several components:
For each of them, we will need to create a configuration file in
For example, we will have 5 Storm servers:
And also on each server we will launch the logviewer process (although we don’t really need it, because we can watch logs from Kibana, but so that the links in the Storm UI do not lead to emptiness, let it be).
Accordingly, on all five servers we create these two files:
Next on the servers storm01.lan and storm02.lan, we will create similar files for running Nimbus:
Well, on the first server, where we decided to install the UI, we will create another file that will run it:
As you can see, the configuration files are almost the same, as the Storm uses a common configuration for all components and we change only the role we want to run.
This completes the configuration of Apache Storm under the control of supervisord, it remains only to configure the logging collection.
For Apache Storm in our installation, two files will manage the logging:
However, since the Log4J2 format is universal, you can easily adapt this configuration to any Java application.
Worker.xml file:
And the cluster.xml file:
As you can see, the configuration is the same, with the exception of the additional METRICS logger, which is used for workers (if you use metrics in your Storm topology).
Consider the key points in the configuration files:
On this, the actual setting is finished, you can run the Storm and watch the logs
On each server we execute the following commands:
Next supervisord will launch all Apache Storm components.
Now we can go to Kibana and admire graphics like this:

Here we see the distribution of messages with the INFO level across servers
In my case, as the main monitoring system that draws beautiful graphics and dashboards, Grafana is used, and it has an excellent feature - it can build graphics from Elasticsearch (and in my opinion they are more beautiful than in Kibana)
Just go to the data sources in Grafana and add our Elasticsearch, specifying the address of the host machine where we run ELK:

After that we will be able to add a graph where we will look, for example, the number of WARNING for each server:

Disks, as it is known, are not rubber, and Elasticsearch does not do any rotation by default. In my installation, this can be a problem, since in a day I have about 60 GB of data in indexes
In order to automatically clean up the old logs, there is the elasticsearch-curator python package
Install it on the host machine, where we run the elk container using pip:
And we will create two configuration files, one describes the connection to Elasticsearch, and the other sets the action, i.e. Actions directly for cleaning outdated indexes:
Here we indicate our index-pattern, in this case,
Then we can simply add the command to cron, to run the curator once a day:
This tutorial does not pretend to be 100% complete and omits some things, because it is supposed to be more like a cheat sheet for yourself, and also assumes an average and higher level of Linux and understanding how it all works.
It was really difficult for me to find a detailed description of how to make a bunch of Storm, Log4J2 and ELK in the form of a specific guide. Of course, you can spend a few hours reading the documentation, but I hope those who are faced with a similar task will find it easier and faster to take advantage of my brief guide.
I would be very happy with any comments, additions, as well as your cases of centralized collection of logs, as well as the difficulties or features that you have encountered in your practice. Welcome to the comments!
What was my surprise that nowhere is it that in Russian, but even in the original tutorials, work with logs in the log4j2 format, which is a default in the world of Java applications, was not described.
Fixing this omission - under the cut tutorial on setting up a centralized collection of any log4j2 logs based on:
')
- ELK inside Docker
- Configure log4j to work with Logstash
- Configure Logstash to properly index logs
- A few bonuses, in the form of a brief Storm setup and Elasticsearch integration with Grafana
ELK on Docker and setting up Logstash
There was already written about the installation of ELK inside the Docker container, but the author of this article used filebeat, but for several reasons I didn’t want to drag some additional software to the application-hosts, and besides log4j2 can send data directly
Download image
After a brief search, I found that with the latest version of ELK (at the time of writing this article is ELK 6.0.0), only the Docker sebp / elk image works out of the box - we use it, but we will fix the image to work without filebeat use TCP Source for this.
cd /usr/local/src git clone https://github.com/spujadas/elk-docker cd elk-docker Create your own Logstash configuration
Just create two files - one for receiving logs via TCP, and another for writing to Elasticsearch
[root@host01 elk-docker]# cat 02-tcp-input.conf input { tcp { port => 5044 codec => line } } filter { kv { source => "message" recursive => "false" add_tag => "%{loggerclass}" } } [root@host01 elk-docker]# cat 30-output.conf output { elasticsearch { hosts => ["localhost"] index => "storm-%{+YYYY.MM.dd}" } } Pay attention to the kv filter (key value) - it is he who will allow us to correctly process the logs in the log4j2 format, as we divide the parameters we need into key-value pairs.
The recursive parameter is required so that the filter does not try to search for nested key-value pairs in the value field.
add_tag => "%{loggerclass}" adds to each entry a Java class of the process that spawned this entry — very handy when you need to look at the work (errors) of a particular component, for example, at the debugging stage.Also at this stage we can add to Dockerfile the installation of necessary plug-ins for Elasticsearch or Kibana (for Logstash too, but as far as I understood, all the official plug-ins are already installed in the image, so if you need something very custom) as described here .
Collect container
For what, let's change the Dockerfile a bit (I will only give diff):
diff --git a/Dockerfile b/Dockerfile index ab01788..723120e 100644 --- a/Dockerfile +++ b/Dockerfile @@ -128,9 +128,7 @@ ADD ./logstash-beats.crt /etc/pki/tls/certs/logstash-beats.crt ADD ./logstash-beats.key /etc/pki/tls/private/logstash-beats.key # filters -ADD ./02-beats-input.conf /etc/logstash/conf.d/02-beats-input.conf -ADD ./10-syslog.conf /etc/logstash/conf.d/10-syslog.conf -ADD ./11-nginx.conf /etc/logstash/conf.d/11-nginx.conf +ADD ./02-tcp-input.conf /etc/logstash/conf.d/02-tcp-input.conf ADD ./30-output.conf /etc/logstash/conf.d/30-output.conf # patterns That is, we remove from the image the standard input intended for working with filebeats, syslog and nginx and add our own configuration files there
Then it remains only to collect a new image:
docker build -t https://docker-registry-host.lan:5000/elk . In this case, I also published it in the local docker-registry (or you can publish it on the docker hub)
Launch ELK
The launch takes place as standard, but first create a directory on the host machine, where we will store the Elasticseach data so that it does not disappear after the container is stopped
mkdir -p /mnt/data1/elk/data And run ELK:
sysctl vm.max_map_count=524288 # Elasticseach docker run -v /mnt/data1/elk/data:/var/lib/elasticsearch --network=host -p 5601:5601 -p 9200:9200 -p 5044:5044 -e ES_HEAP_SIZE="4g" -e LS_HEAP_SIZE="1g" -it -d --name elk docker-registry-host.lan:5000/elk Pay attention to
-e ES_HEAP_SIZE="4g" -e LS_HEAP_SIZE="1g" , - the amount of memory you need depends on the number of logs that you are going to aggregate. In my case, the 256 MB installed by default was not enough for me, so I allocated 4 GB for Elasticsearch and 1 GB for Logstash, respectively. These parameters will have to be selected intuitively based on the load, since I did not find a clear description of the correspondence of the amount of data per second and the amount of used memoryAfter about 40 seconds, the container will start and you can log in to Kibana at host01.lan : 5601 / app / kibana # and see something like this:
Since we specified the format
storm-%{+YYYY.MM.dd} in the Elasticsearch index configuration file, we will set the index pattern as storm-* when Kibana starts upInstall and configure Apache Storm (optional)
As part of the installation of the Storm written many manuals, and the official documentation is quite detailed. This part is optional and if you are not interested in setting up the Storm, you can safely move on to the next part.
We use the Storm 1.0 branch (for historical reasons and because everyone is too lazy to port the code to 1.1.x, as it just works), so I will install the latest version from this branch - 1.0.5 (at the time of this writing)
Installation is quite simple:
mkdir /opt/storm cd /opt/storm wget http://ftp.byfly.by/pub/apache.org/storm/apache-storm-1.0.5/apache-storm-1.0.5.tar.gz tar xzf apache-storm-1.0.5.tar.gz ln -s apache-storm-1.0.5 current We will also need a Zookeeper server for the quorum to work. Their configuration is a topic for a separate article, so here I will not describe them, just assume that they are set up on servers with the names
zookeeper-{01..03}.lanCreate a configuration file storm.yaml
--- /opt/storm/current/conf/storm.yaml storm.zookeeper.servers: - "zookeeper-01.lan" - "zookeeper-01.lan" - "zookeeper-01.lan" storm.local.dir: "/opt/storm" nimbus.seeds: ["storm01.lan", "storm02.lan"] Here, in addition to the Zookeeper cluster, you need to specify the Nimbus server, which act as a kind of topology coordinator in the Storm
Controlling Apache Storm launch via Supervisord
By default, Apache Storm is not demonized on its own, and the official manual says nothing about auto-launch in daemon mode. Therefore, we use Python supervisord , although of course you can use any process orchestrator (RunIT, daemonize etc)
I have a supervisord on CentOS 7.3 via pip, but the meld3 dependency will have to be delivered from the package. On your system, the installation may (and will) be different, but only in minor details:
yum install python-pip -y # pip yum install python-meld3 -y # , supervisord (pip CentOS 7.3) pip install --upgrade pip # pip pip install supervisor # supervisord Next, we need to create configuration files to start Apache Storm, and here we must dwell on the fact that the Storm has several components:
- Nimbus - orchestrator, which provides API, and also manages the balancing of tasks (topologies, executors) between cluster nodes
- UI - everything is simple - this is a web-based interface that allows you to see everything about the current status
- Supervisor is not the one that we just set up, but ours, internal - which receives tasks from the Nimbus server and launches inside it workers who do the work,
described in topologies - Logviewer - allows you to view logs on each cluster machine via the web interface
For each of them, we will need to create a configuration file in
/etc/supervisord/conf.d/ , depending on the role of the serverFor example, we will have 5 Storm servers:
storm01.lan- Nimbus (see above, where we set up storm.yaml), UI, Supervisorstorm02.lan- Nimbus, Supervisorstorm03.lan- Supervisorstorm04.lan- Supervisorstorm05.lan- Supervisor
And also on each server we will launch the logviewer process (although we don’t really need it, because we can watch logs from Kibana, but so that the links in the Storm UI do not lead to emptiness, let it be).
Accordingly, on all five servers we create these two files:
[root@storm01 ~]# cat /etc/supervisord/conf.d/storm.supervisor.conf [program:storm.supervisor] command=/opt/storm/current/bin/storm supervisor user=storm autostart=true autorestart=true startsecs=10 startretries=999 log_stdout=true log_stderr=true logfile=/opt/storm/supervisor.log logfile_maxbytes=20MB logfile_backups=10 environment=JAVA_HOME=/usr/java/current,PATH=%(ENV_PATH)s:/opt/storm/current/bin,STORM_HOME=/opt/storm/current [root@storm01 ~]# cat /etc/supervisord/conf.d/storm.logviewer.conf [program:storm.logviewer] command=/opt/storm/current/bin/storm logviewer user=storm autostart=true autorestart=true startsecs=10 startretries=999 log_stdout=true log_stderr=true logfile=/opt/storm/logviewer.log logfile_maxbytes=20MB logfile_backups=10 environment=JAVA_HOME=/usr/java/current,PATH=%(ENV_PATH)s:/opt/storm/current/bin,STORM_HOME=/opt/storm/current Next on the servers storm01.lan and storm02.lan, we will create similar files for running Nimbus:
[root@storm01 ~]# cat /etc/supervisord/conf.d/storm.nimbus.conf [program:storm.nimbus] command=/opt/storm/current/bin/storm nimbus user=storm autostart=true autorestart=true startsecs=10 startretries=999 log_stdout=true log_stderr=true logfile=/opt/storm/nimbus.log logfile_maxbytes=20MB logfile_backups=10 environment=JAVA_HOME=/usr/java/current,PATH=%(ENV_PATH)s:/opt/storm/current/bin,STORM_HOME=/opt/storm/current Well, on the first server, where we decided to install the UI, we will create another file that will run it:
[root@storm01 ~]# cat /etc/supervisord/conf.d/storm.ui.conf [program:storm.ui] command=/opt/storm/current/bin/storm ui user=storm autostart=true autorestart=true startsecs=10 startretries=999 log_stdout=true log_stderr=true logfile=/opt/storm/ui.log logfile_maxbytes=20MB logfile_backups=10 environment=JAVA_HOME=/usr/java/current,PATH=%(ENV_PATH)s:/opt/storm/current/bin,STORM_HOME=/opt/storm/current As you can see, the configuration files are almost the same, as the Storm uses a common configuration for all components and we change only the role we want to run.
This completes the configuration of Apache Storm under the control of supervisord, it remains only to configure the logging collection.
Configure Log4J2 to send logs to ELK
For Apache Storm in our installation, two files will manage the logging:
/opt/storm/current/log4j2/cluster.xml- manages the configuration for Apache Storm service logs (Nimbus, Supervisor, UI)/opt/storm/current/log4j2/worker.xml- manages the configuration for logging workers, that is, directly the topology (application) running inside the Storm
However, since the Log4J2 format is universal, you can easily adapt this configuration to any Java application.
Worker.xml file:
<?xml version="1.0" encoding="UTF-8"?> <configuration monitorInterval="60"> <properties> <property name="defaultpattern">logdate=(%d{ISO8601}) thread=(%thread)) level=(%level) loggerclass=(%logger{36}) message=(%msg)%n</property> </properties> <appenders> <RollingFile name="A1" fileName="${sys:storm.log.dir}/${sys:logfile.name}" filePattern="${sys:storm.log.dir}/${sys:logfile.name}.%i.gz"> <PatternLayout> <pattern>${defaultpattern}</pattern> </PatternLayout> <Policies> <SizeBasedTriggeringPolicy size="100 MB"/> <!-- Or every 100 MB --> </Policies> <DefaultRolloverStrategy max="9"/> </RollingFile> <RollingFile name="METRICS" fileName="${sys:storm.log.dir}/${sys:logfile.name}.metrics" filePattern="${sys:storm.log.dir}/${sys:logfile.name}.metrics.%i.gz"> <PatternLayout> <pattern>${defaultpattern}</pattern> </PatternLayout> <Policies> <SizeBasedTriggeringPolicy size="2 MB"/> </Policies> <DefaultRolloverStrategy max="9"/> </RollingFile> <Socket name="logstash" host="host01.lan" port="5044"> <PatternLayout pattern="${defaultpattern}" charset="UTF-8" /> </Socket> <Async name="LogstashAsync" bufferSize="204800"> <AppenderRef ref="logstash" /> </Async> </appenders> <loggers> <root level="INFO"> <appender-ref ref="A1"/> <appender-ref ref="LogstashAsync"/> </root> <Logger name="METRICS_LOG" level="info" additivity="false"> <appender-ref ref="METRICS"/> <appender-ref ref="LogstashAsync"/> </Logger> </loggers> </configuration> And the cluster.xml file:
<?xml version="1.0" encoding="UTF-8"?> <configuration monitorInterval="60"> <properties> <property name="defaultpattern">logdate=(%d{ISO8601}) thread=(%thread)) level=(%level) loggerclass=(%logger{36}) message=(%msg)%n</property> </properties> <appenders> <RollingFile name="A1" fileName="${sys:storm.log.dir}/${sys:logfile.name}" filePattern="${sys:storm.log.dir}/${sys:logfile.name}.%i"> <PatternLayout> <pattern>${defaultpattern}</pattern> </PatternLayout> <Policies> <SizeBasedTriggeringPolicy size="100 MB"/> <!-- Or every 100 MB --> </Policies> <DefaultRolloverStrategy max="9"/> </RollingFile> <Socket name="logstash" host="host01.lan" port="5044"> <PatternLayout pattern="${defaultpattern}" charset="UTF-8" /> </Socket> <Async name="LogstashAsync" bufferSize="204800"> <AppenderRef ref="logstash" /> </Async> </appenders> <loggers> <root level="INFO"> <appender-ref ref="A1"/> <appender-ref ref="LogstashAsync"/> </root> </loggers> </configuration> As you can see, the configuration is the same, with the exception of the additional METRICS logger, which is used for workers (if you use metrics in your Storm topology).
Consider the key points in the configuration files:
- The pattern that we use for logging, where we write in the key-value format (remember, we used the kv filter in Logstash) the entities we need, namely, date, thread, logging level, class (which will also become a tag in Elasticsearch ) and the actual message that was sent by this class:
<property name="defaultpattern">logdate=(%d{ISO8601}) thread=(%thread)) level=(%level) loggerclass=(%logger{36}) message=(%msg)%n</property> - In addition to logging to the disk (which is necessary to view logs via the Apache Storm logviewer built in), for which the default appender A1 is responsible , we use SocketAppender , which will allow sending messages directly to Logstash via TCP:
<Socket name="logstash" host="host01.lan" port="5044"> <PatternLayout pattern="${defaultpattern}" charset="UTF-8" /> </Socket>
Here, after the host, we indicate the server (host machine), on which we run the docker-container with ELK and the port that we specified in the configuration - We also make logging asynchronous, otherwise our Storm-topology
willbe blocked by astakeif Logstash stops responding or there are problems with connectivity with this machine:<Async name="LogstashAsync" bufferSize="204800"> <AppenderRef ref="logstash" /> </Async>
The buffer size here is taken at random, but for my throughput it is more than enough
Run Apache Storm and verify logging
On this, the actual setting is finished, you can run the Storm and watch the logs
On each server we execute the following commands:
systemctl enable supervisord systemctl start supervisord Next supervisord will launch all Apache Storm components.
Check work and a small bonus!
Now we can go to Kibana and admire graphics like this:
Here we see the distribution of messages with the INFO level across servers
Integration with Grafana
In my case, as the main monitoring system that draws beautiful graphics and dashboards, Grafana is used, and it has an excellent feature - it can build graphics from Elasticsearch (and in my opinion they are more beautiful than in Kibana)
Just go to the data sources in Grafana and add our Elasticsearch, specifying the address of the host machine where we run ELK:
After that we will be able to add a graph where we will look, for example, the number of WARNING for each server:
Clearing old logs
Disks, as it is known, are not rubber, and Elasticsearch does not do any rotation by default. In my installation, this can be a problem, since in a day I have about 60 GB of data in indexes
In order to automatically clean up the old logs, there is the elasticsearch-curator python package
Install it on the host machine, where we run the elk container using pip:
[root@host01 ~]# pip install elasticsearch-curator And we will create two configuration files, one describes the connection to Elasticsearch, and the other sets the action, i.e. Actions directly for cleaning outdated indexes:
[root@host01 ~]# cat /mnt/elk/conf/curator/curator.yml --- client: hosts: - 127.0.0.1 port: 9200 url_prefix: use_ssl: False certificate: client_cert: client_key: ssl_no_validate: False http_auth: timeout: 30 master_only: False logging: loglevel: INFO logfile: logformat: default blacklist: ['elasticsearch', 'urllib3'] [root@host01 ~]# cat /mnt/elk/conf/curator/rotate.yml --- actions: 1: action: delete_indices description: >- Delete indices older than 20 days (based on index name), for storm- prefixed indices. options: ignore_empty_list: True disable_action: False filters: - filtertype: pattern kind: prefix value: storm- - filtertype: age source: name direction: older timestring: '%Y.%m.%d' unit: days unit_count: 60 Here we indicate our index-pattern, in this case,
storm- , the suffix format (year, month, day) and the number of days that we will keep logs.Then we can simply add the command to cron, to run the curator once a day:
/bin/curator --config /mnt/elk/conf/curator/curator.yml /mnt/elk/conf/curator/rotate.yml Conclusion and disclaimer
This tutorial does not pretend to be 100% complete and omits some things, because it is supposed to be more like a cheat sheet for yourself, and also assumes an average and higher level of Linux and understanding how it all works.
It was really difficult for me to find a detailed description of how to make a bunch of Storm, Log4J2 and ELK in the form of a specific guide. Of course, you can spend a few hours reading the documentation, but I hope those who are faced with a similar task will find it easier and faster to take advantage of my brief guide.
I would be very happy with any comments, additions, as well as your cases of centralized collection of logs, as well as the difficulties or features that you have encountered in your practice. Welcome to the comments!
useful links
Source: https://habr.com/ru/post/342824/
All Articles