How we have AB-testing. Yandex lecture
AB testing on Yandex services is ongoing. “Roll out on such a share of the audience” and look at the reaction of people is so standard practice that no one in the team has a question why it is needed. And so that there are no problems with the testing itself, we have a special infrastructure for experiments. Details tell the developers Sergey Myts and Danil Valgushev.
Sergei:
- I will try to simplify the description of the task of AB-testing. There is an abstract system with users, we make some changes to it, and we need to be able to measure the benefits in it. So far, everything is simple, but too abstract. Example. There is a web service comparing a couple of photos of cats. The user must select the most liked photo. At the same time, he can choose not only the left or right picture, but also “against all”. So we picked up the pictures are not very good. Our task is to reasonably improve the service, proving it in numbers.
How do we experiment? First you need to understand what is good. We want to improve the system. It is necessary to choose what to strive for, and not necessarily in numbers, but in what we call the direction to the ideal. You may want the user to say as little as possible that we did not find anything good at all. To have as few failures as possible. It is also probably good when we can correctly predict the user's choice. Then let's try to make the left picture like him more often. You can also want the user to want to use our service more and more. Suddenly, we then want to hang up an advertisement, and the more he uses the service, the more he sees the advertisement. And he is good, because he likes the service, and we, because we like advertising. Joke.
This concept needs to be displayed in numbers in order to somehow measure it. You can enter indicators of goodness - metrics. As metrics, the number of refusals to compare, the number of correctly guessed left results, some weighted average user per service for the number of his actions, time for individual pictures, etc. Some things that we think reflect our ideal.
')
Now we need data to calculate everything. Highlight user actions. Perhaps pressing the buttons, switching the mouse. At the same time, we want to record the fact of what pictures were displayed and how long it was spent on a particular page. Let's put together everything that can help us in calculating the metrics.
Learn how to remember them on the client side. If this is a web service, most likely it is JavaScript that notes some actions and saves them locally on itself. Then we learn to communicate them to the server and save them on each typewriter. And we will learn how to aggregate them and put them in storage so that they can be processed later.
We know what we want and on what data to look for it. Let's now learn to count. We need the implementation of the calculation of metrics - just some kind of process that, according to our experiments, will say that on average, the user has such metrics indicators. Results should be stored with convenient access. Not just counting once, but for example, managers will appear in analytics so that they themselves can easily access this repository and see the results.

I wish that the search for results was not very long. Therefore, in the repository, you need to provide a quick search and display of results - so that you can move faster. We introduce several terms to understand the internal terminology. Experimental sampling is a combination of two things: a set of flags or parameters with experimental functionality, as well as a whole subset of people who are included in these changes.

An experiment is a collection of several samples. As a rule, one of them is a control one, and users see our service there without experiments. All others include experimental actions. The data slice is an auxiliary analytical tool. More often than not, we want to see our metrics, perhaps to some limited group of users. Sometimes we wonder how users behave in a particular country. Sometimes it is interesting how we change the output for commercial requests, because money comes from them. It is interesting to look not at the entire data stream, but at individual sections.

We must learn to create and conduct an experiment. In the description of the experimental sample, it is necessary to somehow determine the description of the parameter that will include this experiment. Let's say the experiment will compare two image matching algorithms. The first one prefers cats on baleeness, the second one - on fluffiness. Then in the first experimental sample there may be a flag is Susat = true, in the second is Fuzzy = true.
Another experimental sample will include what percentage of users and, possibly, with what restrictions — for example, in which country — we want to run our experiment. This all concerns the description and modification of the experimental sample. And it would be good for us to be able to stop the experiments and run them. Watch for health. When there is a big system, it's good to understand when everything breaks down or when as a result of changes something goes wrong, as we planned.
If we want to conduct not one, but many experiments - it is very useful to look at what is happening in each of them. For example, it may happen that the bite classifier will work a little more and squander the response time. And sometimes it may not be very desirable situation.

It is necessary to learn how to draw conclusions, display the metrics of the experiment and the presence of significant changes. There should be some kind of interface that says that these metrics have significant changes according to statistical criteria - look and draw some conclusions. If it is stated that everything is good for all metrics, then it means we need to roll it. If it is bad and we do not understand why, then we need to understand. If there is no understanding, the next time you can mess up more.
It is also sometimes useful to consider the features on individual important slices - for example, to make sure that the response time on mobile does not squander. And it is convenient when there is a tool for finding possible problems and anomalies. Not by yourself looking at all the cuts, but by some tool can suggest that there is most likely something so bad on this cut that it prevented everyone from doing so. It seems everything is relatively simple.
Danil:
- Not really. My name is Danil Valgushev. It's complicated. This is due to the fact that Yandex is a big company, and there are many interesting nuances that I want to talk about with a specific example.

We have not only the main search. There is a search for pictures and video, mail, maps and many other services.
We also have many users, many experimenters and experiments. Even within each service there are many different areas that we want to improve. In the search, we can improve the ranking algorithms, the interface, or create new functional features.
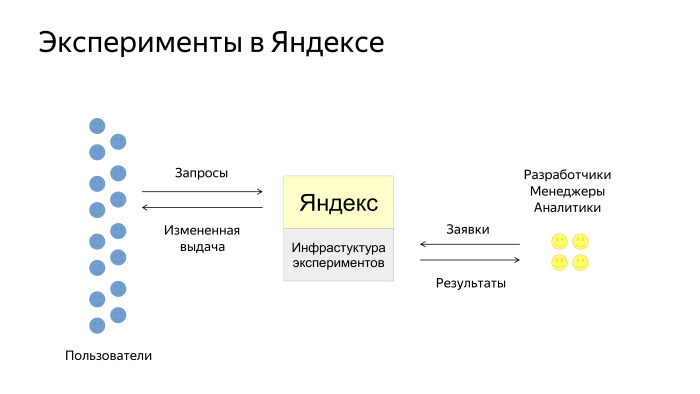
How do our users interact with the experiment infrastructure? Simplified scheme looks like this. There are users, there is Yandex, where the infrastructure of experiments is embedded. Users specify requests and receive output, which is somehow changed by the experiment. There are also developers, managers and analysts in Yandex who create applications for experiments. We then carry them out and give tools for analyzing the results.

A typical experiment consists of three steps. The manager or analyst first conducts an experiment on real users and, upon completion, analyzes the results and makes decisions.

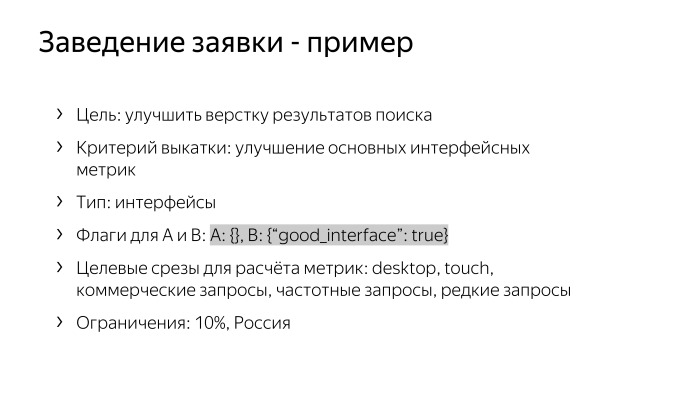
For example, we decided to conduct an experiment and improve the layout of search results. We must create an application and fill in all the fields. We write that rollout criteria is an improvement on the main interface metrics. Type of application - interfaces. Next, create two samples. One is empty, Ah, clean production. And sample B, where there is some flag, for example, goodInterface = true. This flag is then swept through our infrastructure to the destination, to the code that generates the interface, and the code is triggered by this flag. Also in the application we are talking about target sections that we want to cheat in the metrics, and note on which regions, browsers, platforms and on what percentage we want to start the experiment.
Suppose we fill out an application. It turns out that we cannot just roll it out into production. We must first test it. Testing has two goals. There are manual tests and automatic. Manual - this is when the creator of the experiment himself clicks on everything that he is interested in, the entire necessary interface, so that everything works correctly. Automatic tests are aimed at avoiding fakapov when the experiment rolls into production.
There are two examples: checking for the fall of certain modules of services or collecting assessor estimates from an experiment - in order to prevent very bad experiments from being produced, to test them before rolling out. There is a problem that, perhaps, we are conducting an experiment for the first time and are not completely sure that we will not break anything. Then our experts come to the rescue.

For each service and for each aspect of the quality of service, we have experts who, on each application, come and moderate it. They check the clarity of the description and the correctness of the flags, give advice, see if additional tests are needed, and, in principle, accompany the experiments, helping people who are not well versed in them.
When the application is approved, we must get into production. Here, too, a problem arises: users are limited, and there are many applications. A queue forms.

One of the solutions is a multidimensional scheme. A one-dimensional scheme is when each user falls into exactly one experiment. And multidimensional - when each user enters more than one experiment. Naturally, overlapping experiments should not conflict with each other. Usually they relate either to different services or to different aspects of the quality of one service.
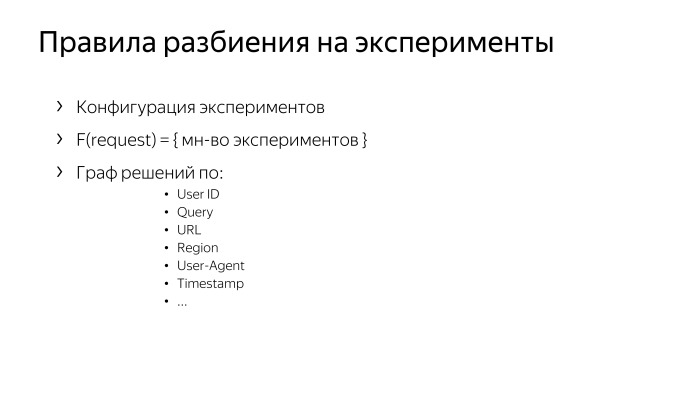
Let's say we hit production. How do users break into experiments? We have some configuration that actually describes the rules. And we came to the conclusion that it is convenient to describe this configuration in the form of a decision graph. There are experiments in the leaves of the graph, and in the nodes there are solutions on the request parameters, which include, for example, the user ID, the request text, the page address, the region, the user agent, the time.

The application enters the configuration at the moment when the configuration is being prepared for rolling out. The configuration is collected by deleting old orders and adding new ones. Roll out is usually done several times a day.

Here too, a problem arises. We seem to have tested all the experiments, but no one guarantees that if we roll a new configuration, nothing will break. Therefore, we always monitor the key indicators of the search when rolling out the configuration - so that if anything happens, it can be successfully rolled back. This usually does not happen, but we still insure.
There are smaller breakdowns when one experiment breaks down. It is more difficult here, it is not immediately apparent, it is necessary to build graphs for each experiment, for key metrics, such as the number of clicks, the number of requests. And there is a system for automatically detecting anomalies, which notices when a schedule starts to behave badly. There is also an emergency shutdown system, if something is wrong.
How does the split work? How to break users so that they are mixed up, but at the same time each user got into the same experiment?
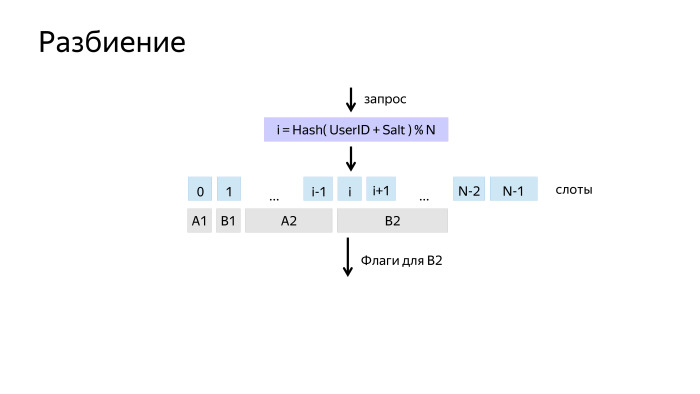
A simple solution is to take the hash from its identifier, and take it modulo N. We get N possible gatherings and call them slots. This partition we usually call measurement.
Then on the slots you can hang experiments and algorithms. But there was a problem. Suppose we had an experiment in which the users in one sample were good, and in the other - a little worse. After turning off the experiment, users are accustomed to and began to behave differently. And when we turn on our own, we have an offset, A and B are in unequal conditions.
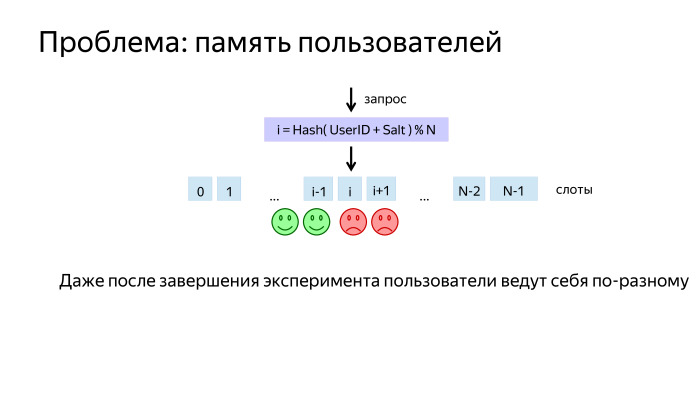
Due to the fact that our algorithm is a graph, we can make such a feint with our ears: take and mix the users again before they again get into sample A and B. Thus, we will provide them with the same conditions.

The multidimensional scheme also looks pretty simple. There is a special node that parallelizes the bypass of the graph. Crawling occurs independently on each branch, and then the result is added.
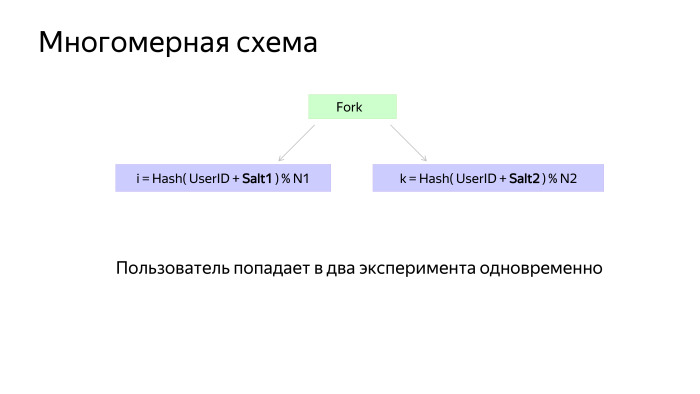
When measurements are made in different branches, they usually have Salt1 and Salt2 - salt, so that they beat independently and do not correlate with each other.
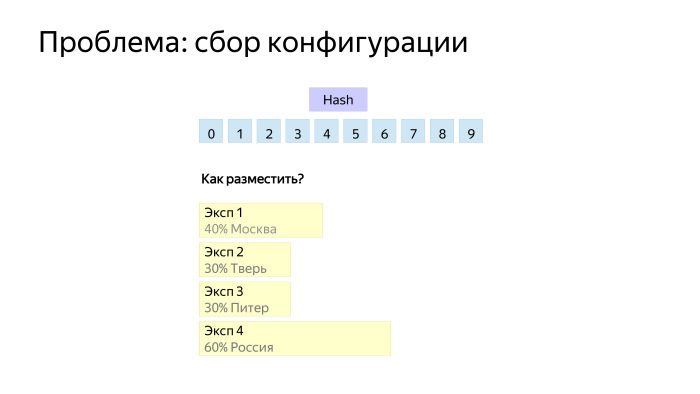
The last problem is how to build configurations. It is important to remember that each experiment still has a set of restrictions: percentages, regions, browsers, platforms, etc. Here is an example - four experiments that go to different regions. How to place them, for example, on 10 slots?
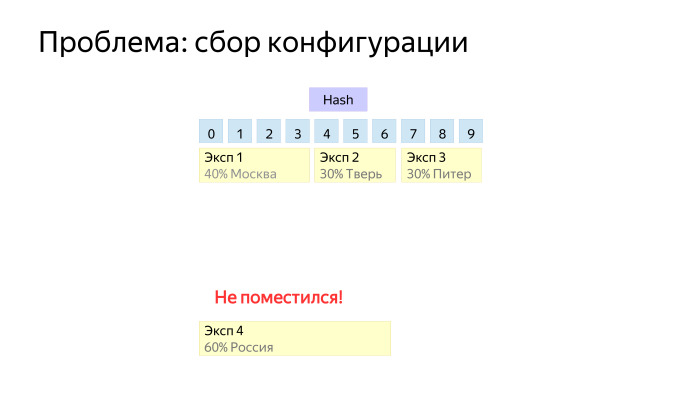
If we place it like this, then we see that each experiment has a little bit eaten from each slot and the last experiment did not work, because it intersects with all three.
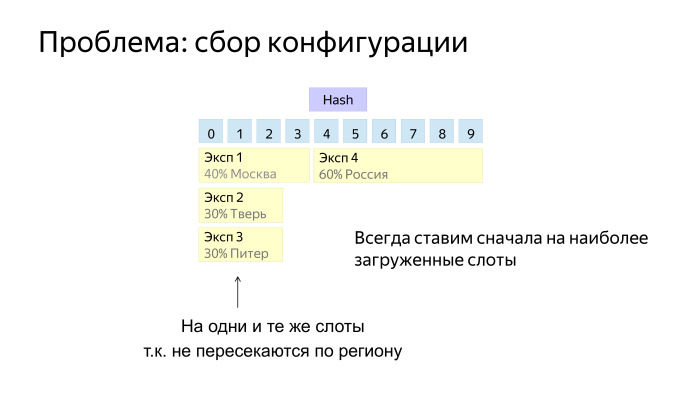
Simple heuristics work here quite well. When we put a new tool in the configuration, we usually try to choose slots where there are already some experiments. And when the fat experiment comes to broad restrictions, we need to have room for it.

Here we conducted an experiment, it worked, we look at metrics. Be sure to look at the usual metrics: the number of user requests, clicks - to understand how much data is collected. Another standard metric is the percentage of unclipped pages, CTR. We have many different metrics, and the acceptance is not based on clicks and queries, but on synthetic metrics. This is a separate topic, not for our report.

There are such statistical tests. When we conducted the experiment, we make a decision. First of all, we check the criteria for rolling out according to metrics, our product considerations and be sure to consult with experts.

After completion, the experiment goes to dataset. We collect the whole story. It, first of all, allows us to carry out various studies on the methods of the experiment, and is also needed to validate new metrics.


Sergei:
- This is a kind of generalized overview of the infrastructure tools. We talked about the first two topics: what can be done with the interaction interface and how the partitioning occurs. And what problems arise with logging in the real world?
Since there are many services and many data sources, we have a data zoo. They are of different sizes, delivered at different speeds. Some are ready immediately, some in a day, some in a week. The big problem is that responsibility is distributed over these source data. Each team writes its own logs, then we want to collect them. Therefore, you need to work with each separately.

Because of the zoo data, there are issues of delivery and aggregation. So, you need to start a complex infrastructure and streamlined processes that will collect logs from all teams. At the same time it would be good to have compatible data formats in order to be able to process data for the entire company, and not to go to each team with its parser. Here the general library of work with logs is useful.
In the end, the data should be aggregated and stored in one place where it is convenient to process them further. We have separate special teams responsible for separate logging processes at low and high levels, who write libraries and are responsible for the time of data delivery. Therefore, the experiment team has simplified the task, we have already arrived at the ready. We have a common library of working with logs - with the help of it, any analyst can parse all the main company logs if he has the appropriate access. All data is stored in the storage at MapReduce, in the system, and processed in the calculations of MapReduce. We have our own YT system , you can search, there were reports about it.
Data delivered, you need to count. Data processing is distributed, the calculation goes to hundreds of terabytes and to petabytes. From the point of view of the interface, we want to get the numbers we need for any day for any experiment and data slice. So, you need to somehow prepare the data. We cope with the fact that we build extracts, where the data are stacked in a special way, so that they can be quickly found in the file system, just a binary search and some other special preprocessed indices.
As a result, individual tools can in seconds or minutes, if we have a very complex experiment and a lot of data, unload figures for any experiment that was conducted in the company.

Many experiments - many potential problems. Services are very different, are developed separately, their own functionality, each experimenting with them, and we collect them in a common point where everyone can break something in their own way. Therefore, monitoring is very necessary and important. The first sentence is that the aggregation of the collected logs takes time, so it would be good to have a monitor for disrupting counters. We need to at least count how many requests, clicks, or some simple actions. This data is prepared very quickly, and it can be seen from them that something has gone completely wrong.
On the other hand, problems can be complex and something can go wrong not just in separate numbers, but on a specific metric. For example, users may begin to spend less time in the interface or, conversely, solve some user problem longer. On the one hand, this means that it is necessary to aggregate the logs and, using fast data, metrics calculations are needed faster. , , - . , . .
, , : , . . , , . . , , . , -, - . .
: - . . , , , , , - - . , , , .
— , , . , , . , , .

, . , , . , . , , .
, , . , n , , . . , .
— . . - , , , , . , .
, . Thank.
Sergei:
- I will try to simplify the description of the task of AB-testing. There is an abstract system with users, we make some changes to it, and we need to be able to measure the benefits in it. So far, everything is simple, but too abstract. Example. There is a web service comparing a couple of photos of cats. The user must select the most liked photo. At the same time, he can choose not only the left or right picture, but also “against all”. So we picked up the pictures are not very good. Our task is to reasonably improve the service, proving it in numbers.
How do we experiment? First you need to understand what is good. We want to improve the system. It is necessary to choose what to strive for, and not necessarily in numbers, but in what we call the direction to the ideal. You may want the user to say as little as possible that we did not find anything good at all. To have as few failures as possible. It is also probably good when we can correctly predict the user's choice. Then let's try to make the left picture like him more often. You can also want the user to want to use our service more and more. Suddenly, we then want to hang up an advertisement, and the more he uses the service, the more he sees the advertisement. And he is good, because he likes the service, and we, because we like advertising. Joke.
This concept needs to be displayed in numbers in order to somehow measure it. You can enter indicators of goodness - metrics. As metrics, the number of refusals to compare, the number of correctly guessed left results, some weighted average user per service for the number of his actions, time for individual pictures, etc. Some things that we think reflect our ideal.
')
Now we need data to calculate everything. Highlight user actions. Perhaps pressing the buttons, switching the mouse. At the same time, we want to record the fact of what pictures were displayed and how long it was spent on a particular page. Let's put together everything that can help us in calculating the metrics.
Learn how to remember them on the client side. If this is a web service, most likely it is JavaScript that notes some actions and saves them locally on itself. Then we learn to communicate them to the server and save them on each typewriter. And we will learn how to aggregate them and put them in storage so that they can be processed later.
We know what we want and on what data to look for it. Let's now learn to count. We need the implementation of the calculation of metrics - just some kind of process that, according to our experiments, will say that on average, the user has such metrics indicators. Results should be stored with convenient access. Not just counting once, but for example, managers will appear in analytics so that they themselves can easily access this repository and see the results.
I wish that the search for results was not very long. Therefore, in the repository, you need to provide a quick search and display of results - so that you can move faster. We introduce several terms to understand the internal terminology. Experimental sampling is a combination of two things: a set of flags or parameters with experimental functionality, as well as a whole subset of people who are included in these changes.
An experiment is a collection of several samples. As a rule, one of them is a control one, and users see our service there without experiments. All others include experimental actions. The data slice is an auxiliary analytical tool. More often than not, we want to see our metrics, perhaps to some limited group of users. Sometimes we wonder how users behave in a particular country. Sometimes it is interesting how we change the output for commercial requests, because money comes from them. It is interesting to look not at the entire data stream, but at individual sections.
We must learn to create and conduct an experiment. In the description of the experimental sample, it is necessary to somehow determine the description of the parameter that will include this experiment. Let's say the experiment will compare two image matching algorithms. The first one prefers cats on baleeness, the second one - on fluffiness. Then in the first experimental sample there may be a flag is Susat = true, in the second is Fuzzy = true.
Another experimental sample will include what percentage of users and, possibly, with what restrictions — for example, in which country — we want to run our experiment. This all concerns the description and modification of the experimental sample. And it would be good for us to be able to stop the experiments and run them. Watch for health. When there is a big system, it's good to understand when everything breaks down or when as a result of changes something goes wrong, as we planned.
If we want to conduct not one, but many experiments - it is very useful to look at what is happening in each of them. For example, it may happen that the bite classifier will work a little more and squander the response time. And sometimes it may not be very desirable situation.
It is necessary to learn how to draw conclusions, display the metrics of the experiment and the presence of significant changes. There should be some kind of interface that says that these metrics have significant changes according to statistical criteria - look and draw some conclusions. If it is stated that everything is good for all metrics, then it means we need to roll it. If it is bad and we do not understand why, then we need to understand. If there is no understanding, the next time you can mess up more.
It is also sometimes useful to consider the features on individual important slices - for example, to make sure that the response time on mobile does not squander. And it is convenient when there is a tool for finding possible problems and anomalies. Not by yourself looking at all the cuts, but by some tool can suggest that there is most likely something so bad on this cut that it prevented everyone from doing so. It seems everything is relatively simple.
Danil:
- Not really. My name is Danil Valgushev. It's complicated. This is due to the fact that Yandex is a big company, and there are many interesting nuances that I want to talk about with a specific example.
We have not only the main search. There is a search for pictures and video, mail, maps and many other services.
We also have many users, many experimenters and experiments. Even within each service there are many different areas that we want to improve. In the search, we can improve the ranking algorithms, the interface, or create new functional features.
How do our users interact with the experiment infrastructure? Simplified scheme looks like this. There are users, there is Yandex, where the infrastructure of experiments is embedded. Users specify requests and receive output, which is somehow changed by the experiment. There are also developers, managers and analysts in Yandex who create applications for experiments. We then carry them out and give tools for analyzing the results.
A typical experiment consists of three steps. The manager or analyst first conducts an experiment on real users and, upon completion, analyzes the results and makes decisions.
For example, we decided to conduct an experiment and improve the layout of search results. We must create an application and fill in all the fields. We write that rollout criteria is an improvement on the main interface metrics. Type of application - interfaces. Next, create two samples. One is empty, Ah, clean production. And sample B, where there is some flag, for example, goodInterface = true. This flag is then swept through our infrastructure to the destination, to the code that generates the interface, and the code is triggered by this flag. Also in the application we are talking about target sections that we want to cheat in the metrics, and note on which regions, browsers, platforms and on what percentage we want to start the experiment.
Suppose we fill out an application. It turns out that we cannot just roll it out into production. We must first test it. Testing has two goals. There are manual tests and automatic. Manual - this is when the creator of the experiment himself clicks on everything that he is interested in, the entire necessary interface, so that everything works correctly. Automatic tests are aimed at avoiding fakapov when the experiment rolls into production.
There are two examples: checking for the fall of certain modules of services or collecting assessor estimates from an experiment - in order to prevent very bad experiments from being produced, to test them before rolling out. There is a problem that, perhaps, we are conducting an experiment for the first time and are not completely sure that we will not break anything. Then our experts come to the rescue.
For each service and for each aspect of the quality of service, we have experts who, on each application, come and moderate it. They check the clarity of the description and the correctness of the flags, give advice, see if additional tests are needed, and, in principle, accompany the experiments, helping people who are not well versed in them.
When the application is approved, we must get into production. Here, too, a problem arises: users are limited, and there are many applications. A queue forms.
One of the solutions is a multidimensional scheme. A one-dimensional scheme is when each user falls into exactly one experiment. And multidimensional - when each user enters more than one experiment. Naturally, overlapping experiments should not conflict with each other. Usually they relate either to different services or to different aspects of the quality of one service.
Let's say we hit production. How do users break into experiments? We have some configuration that actually describes the rules. And we came to the conclusion that it is convenient to describe this configuration in the form of a decision graph. There are experiments in the leaves of the graph, and in the nodes there are solutions on the request parameters, which include, for example, the user ID, the request text, the page address, the region, the user agent, the time.
The application enters the configuration at the moment when the configuration is being prepared for rolling out. The configuration is collected by deleting old orders and adding new ones. Roll out is usually done several times a day.
Here too, a problem arises. We seem to have tested all the experiments, but no one guarantees that if we roll a new configuration, nothing will break. Therefore, we always monitor the key indicators of the search when rolling out the configuration - so that if anything happens, it can be successfully rolled back. This usually does not happen, but we still insure.
There are smaller breakdowns when one experiment breaks down. It is more difficult here, it is not immediately apparent, it is necessary to build graphs for each experiment, for key metrics, such as the number of clicks, the number of requests. And there is a system for automatically detecting anomalies, which notices when a schedule starts to behave badly. There is also an emergency shutdown system, if something is wrong.
How does the split work? How to break users so that they are mixed up, but at the same time each user got into the same experiment?
A simple solution is to take the hash from its identifier, and take it modulo N. We get N possible gatherings and call them slots. This partition we usually call measurement.
Then on the slots you can hang experiments and algorithms. But there was a problem. Suppose we had an experiment in which the users in one sample were good, and in the other - a little worse. After turning off the experiment, users are accustomed to and began to behave differently. And when we turn on our own, we have an offset, A and B are in unequal conditions.
Due to the fact that our algorithm is a graph, we can make such a feint with our ears: take and mix the users again before they again get into sample A and B. Thus, we will provide them with the same conditions.
The multidimensional scheme also looks pretty simple. There is a special node that parallelizes the bypass of the graph. Crawling occurs independently on each branch, and then the result is added.
When measurements are made in different branches, they usually have Salt1 and Salt2 - salt, so that they beat independently and do not correlate with each other.
The last problem is how to build configurations. It is important to remember that each experiment still has a set of restrictions: percentages, regions, browsers, platforms, etc. Here is an example - four experiments that go to different regions. How to place them, for example, on 10 slots?
If we place it like this, then we see that each experiment has a little bit eaten from each slot and the last experiment did not work, because it intersects with all three.
Simple heuristics work here quite well. When we put a new tool in the configuration, we usually try to choose slots where there are already some experiments. And when the fat experiment comes to broad restrictions, we need to have room for it.
Here we conducted an experiment, it worked, we look at metrics. Be sure to look at the usual metrics: the number of user requests, clicks - to understand how much data is collected. Another standard metric is the percentage of unclipped pages, CTR. We have many different metrics, and the acceptance is not based on clicks and queries, but on synthetic metrics. This is a separate topic, not for our report.
There are such statistical tests. When we conducted the experiment, we make a decision. First of all, we check the criteria for rolling out according to metrics, our product considerations and be sure to consult with experts.
After completion, the experiment goes to dataset. We collect the whole story. It, first of all, allows us to carry out various studies on the methods of the experiment, and is also needed to validate new metrics.
Sergei:
- This is a kind of generalized overview of the infrastructure tools. We talked about the first two topics: what can be done with the interaction interface and how the partitioning occurs. And what problems arise with logging in the real world?
Since there are many services and many data sources, we have a data zoo. They are of different sizes, delivered at different speeds. Some are ready immediately, some in a day, some in a week. The big problem is that responsibility is distributed over these source data. Each team writes its own logs, then we want to collect them. Therefore, you need to work with each separately.
Because of the zoo data, there are issues of delivery and aggregation. So, you need to start a complex infrastructure and streamlined processes that will collect logs from all teams. At the same time it would be good to have compatible data formats in order to be able to process data for the entire company, and not to go to each team with its parser. Here the general library of work with logs is useful.
In the end, the data should be aggregated and stored in one place where it is convenient to process them further. We have separate special teams responsible for separate logging processes at low and high levels, who write libraries and are responsible for the time of data delivery. Therefore, the experiment team has simplified the task, we have already arrived at the ready. We have a common library of working with logs - with the help of it, any analyst can parse all the main company logs if he has the appropriate access. All data is stored in the storage at MapReduce, in the system, and processed in the calculations of MapReduce. We have our own YT system , you can search, there were reports about it.
Data delivered, you need to count. Data processing is distributed, the calculation goes to hundreds of terabytes and to petabytes. From the point of view of the interface, we want to get the numbers we need for any day for any experiment and data slice. So, you need to somehow prepare the data. We cope with the fact that we build extracts, where the data are stacked in a special way, so that they can be quickly found in the file system, just a binary search and some other special preprocessed indices.
As a result, individual tools can in seconds or minutes, if we have a very complex experiment and a lot of data, unload figures for any experiment that was conducted in the company.
Many experiments - many potential problems. Services are very different, are developed separately, their own functionality, each experimenting with them, and we collect them in a common point where everyone can break something in their own way. Therefore, monitoring is very necessary and important. The first sentence is that the aggregation of the collected logs takes time, so it would be good to have a monitor for disrupting counters. We need to at least count how many requests, clicks, or some simple actions. This data is prepared very quickly, and it can be seen from them that something has gone completely wrong.
On the other hand, problems can be complex and something can go wrong not just in separate numbers, but on a specific metric. For example, users may begin to spend less time in the interface or, conversely, solve some user problem longer. On the one hand, this means that it is necessary to aggregate the logs and, using fast data, metrics calculations are needed faster. , , - . , . .
, , : , . . , , . . , , . , -, - . .
: - . . , , , , , - - . , , , .
— , , . , , . , , .
, . , , . , . , , .
, , . , n , , . . , .
— . . - , , , , . , .
, . Thank.
Source: https://habr.com/ru/post/342704/
All Articles