Facebook or Google? Where it is more profitable to advertise in 2017
The task is simple. There are 2 channels to attract visitors: Facebook and AdWords. The tour operator with an annual budget of approximately $ 60,000 dollars on both channels.
The business owner asks: Where is it more profitable to advertise? In other words, where is it better to invest a dollar in order to earn more profits and orders?
 "
"
')
So in order.
Part 1. Analyze attendance.
The overall picture looks like this:
From January 1 to November 1, 15.502 new visitors visited the site according to Google Analytics.

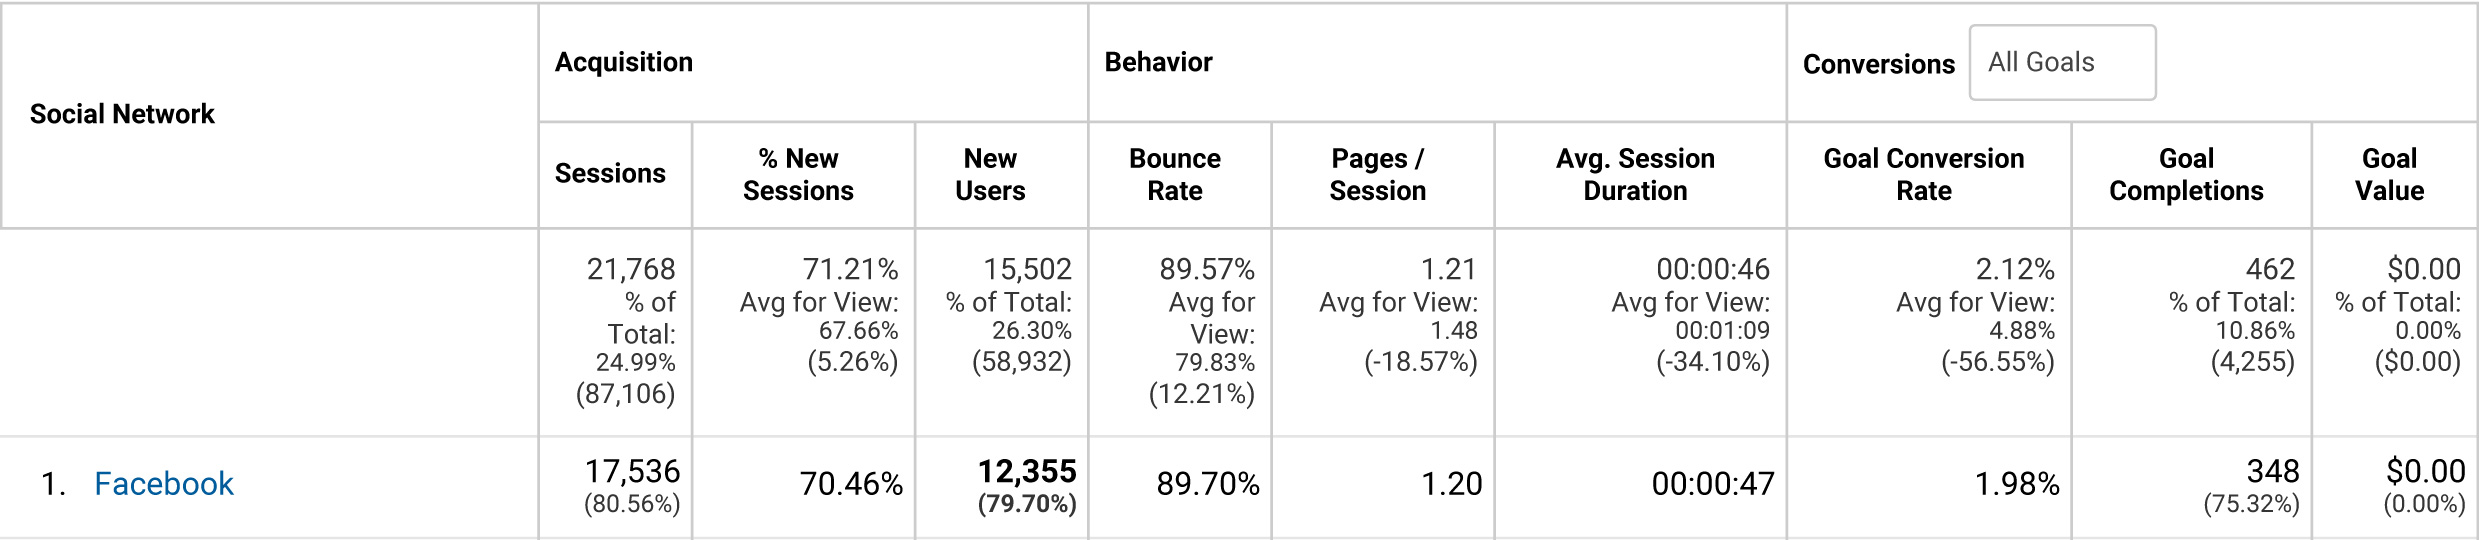
At the beginning, let's compare the attendance of Facebook and AdWords. We see that the traffic from social networks is 3 times higher than from AdWords, while the conversion is noticeably worse.
Facebook Attendance:
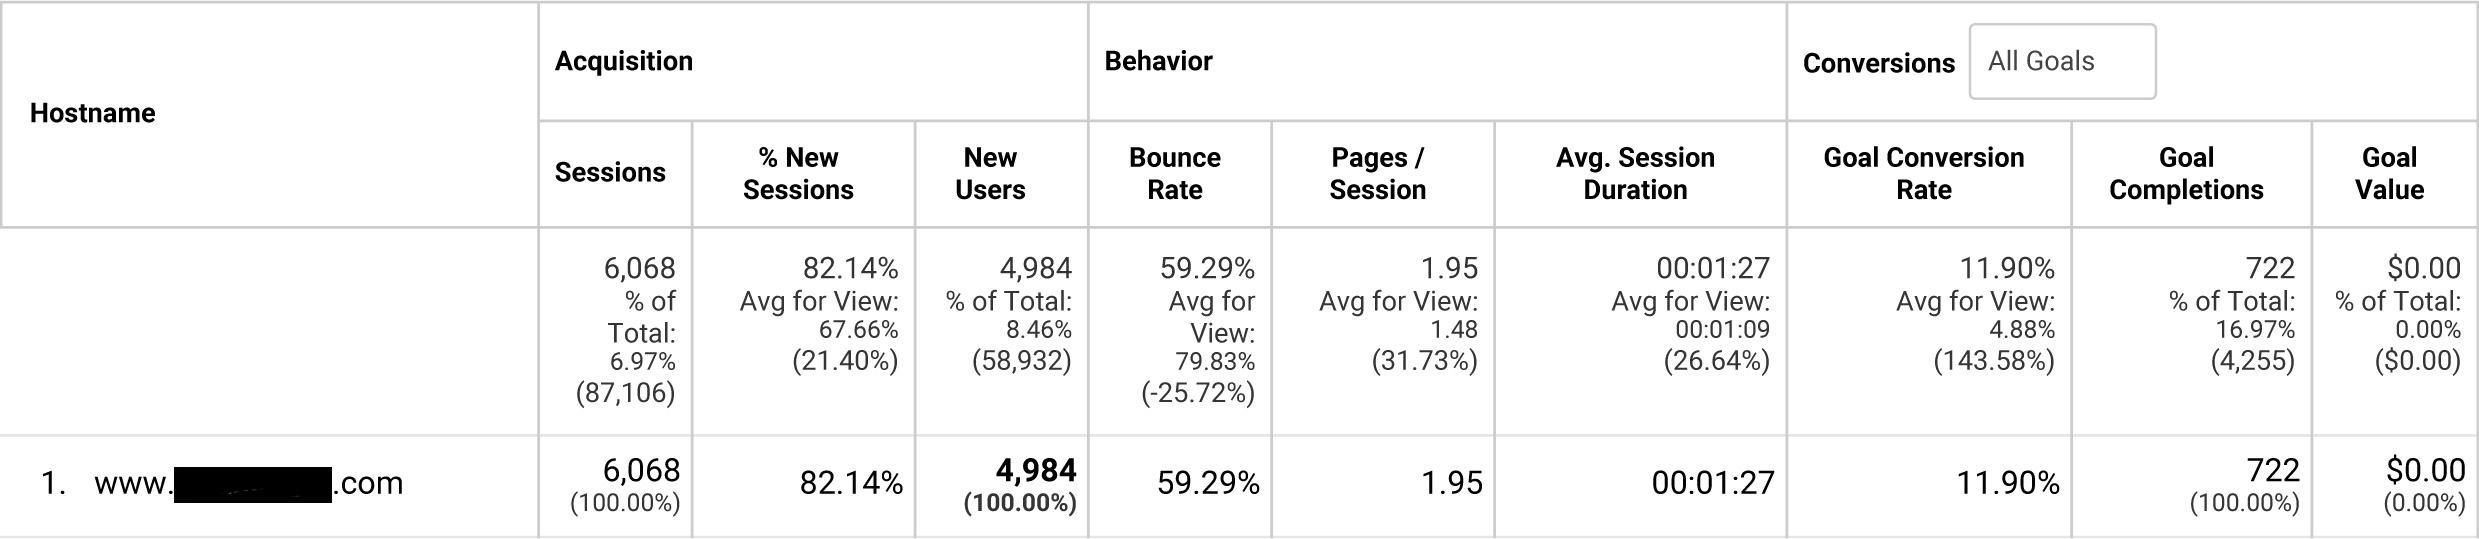
AdWords Attendance:
Facebook is the main source of traffic from social networks (gives almost 80% of traffic). At the same time, Facebook allows you to take an order without leaving the social network itself: the user simply sends a message to the manager through Facebook itself. Another situation is possible: Facebook user saw the contact number, called and placed an order by phone. In this case, we see a transition, paid click and order, but Google Analytics will not record a visit to the site by such a client. Accordingly, such indicators as attendance, conversion, etc. will need to be adjusted. In CRM customer such orders are entered and adjusted manually.
Also, according to conversion statistics, we see discrepancies. For example, this: 4 visitors came to our site for AdWords paid advertising, later they returned to our site via Facebook and filled out an order form on the site.

Another example: here we see that a visitor came to our site through contextual AdWords advertising, then he most likely looked for information about a company or product, returned to the site based on the results of the natural search engine results. After that, he again visited our site for contextual advertising. After that I moved from the social network. And after that, 3 more times I went to the site by contextual advertising and eventually filled out an order form on the site. There were two such users.

There are many similar examples, we will not dwell on them. I will just note that for accurate calculations, you need to look not only at the site attendance, but also the behavior of users. In general, we see that the conversion rate for visitors from Google AdWords is about 5 times higher.
By the way, we estimate the conversion by the attribution model of the last interaction (comparison model - last interation). Tourist products product is quite complicated, the sale of the tour stage is multi-stage. The decision to purchase is not taken immediately.
Part 2. Analyzing advertising campaigns
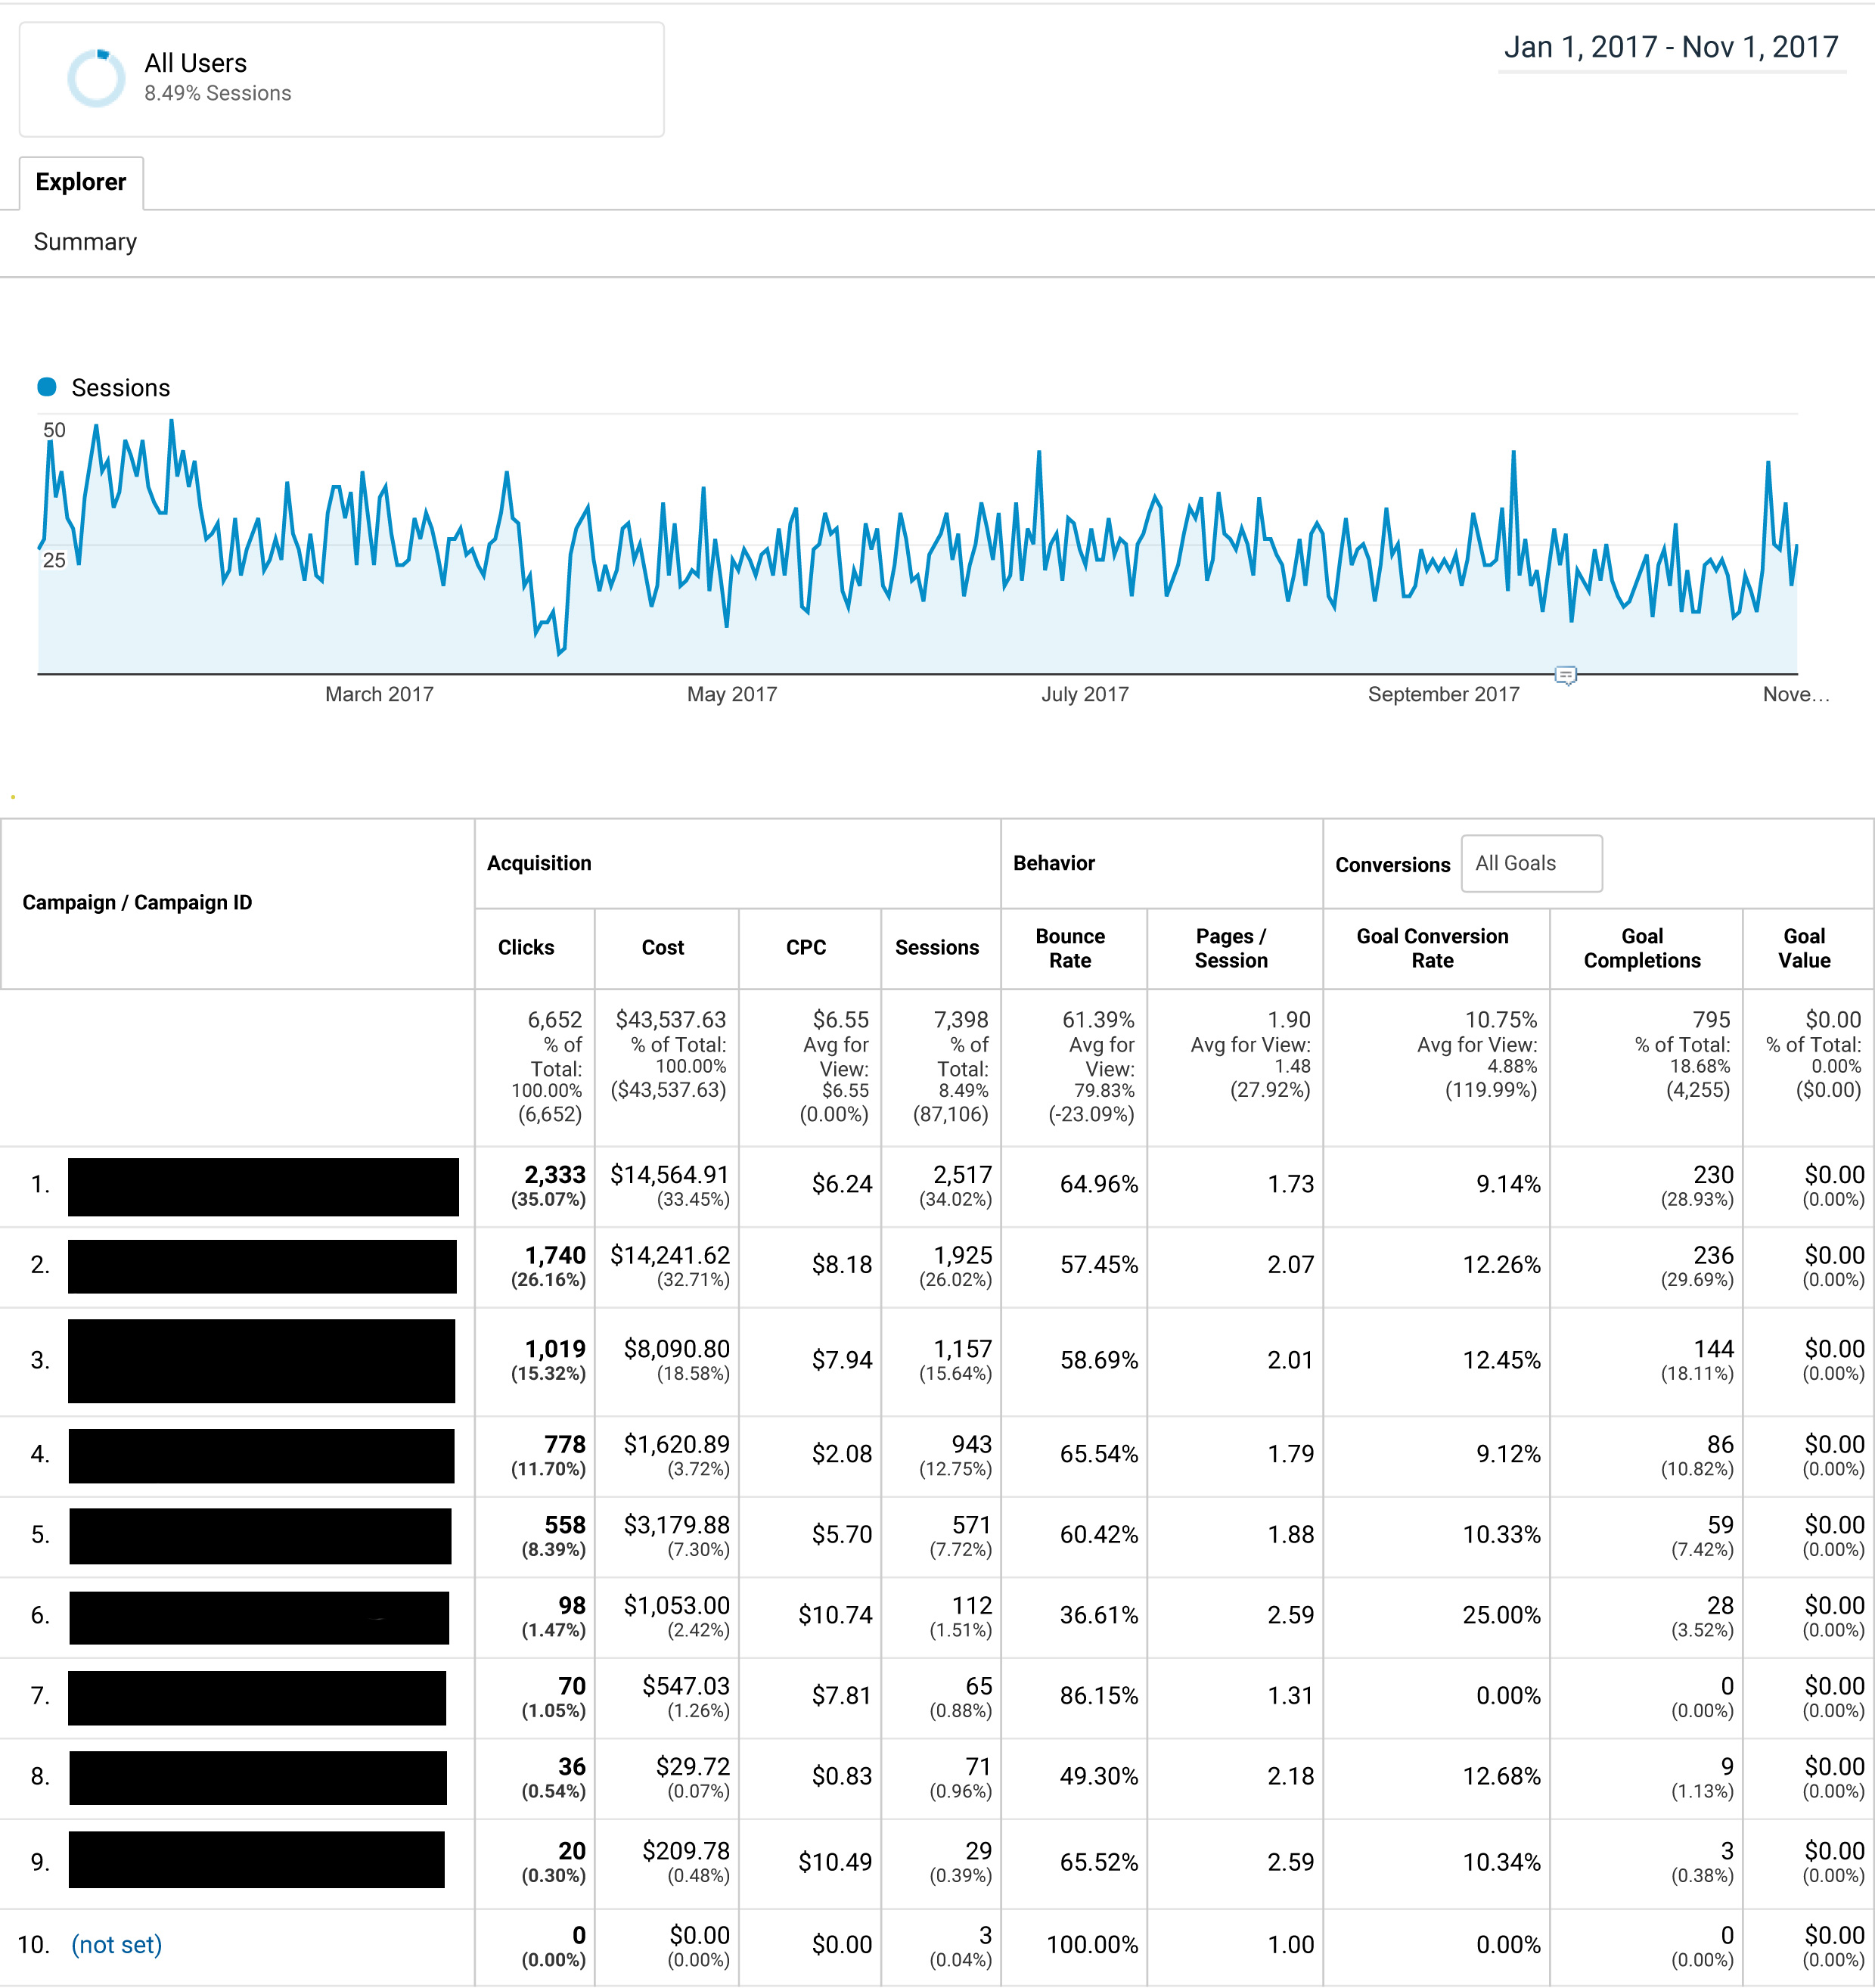
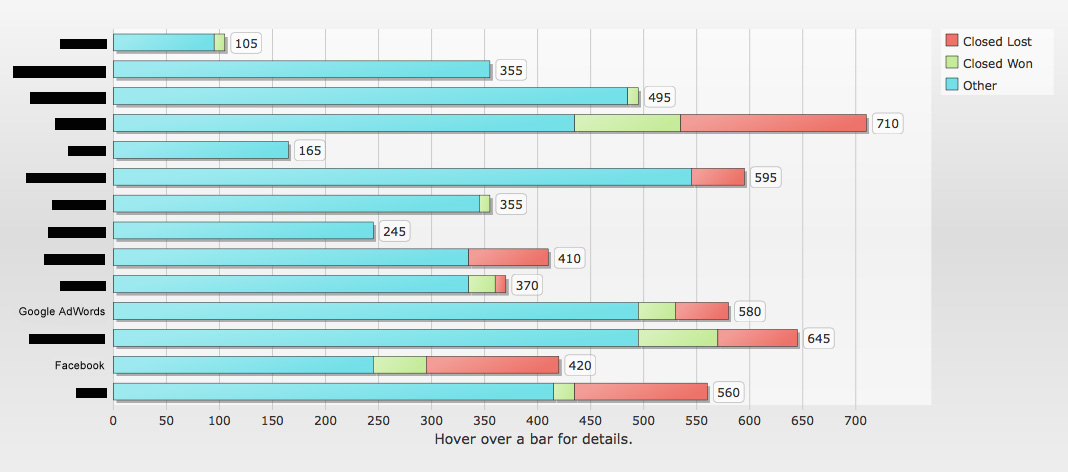
Google Adwords Campaign:
Facebook Campaign:

For convenience, we will put everything in one table:
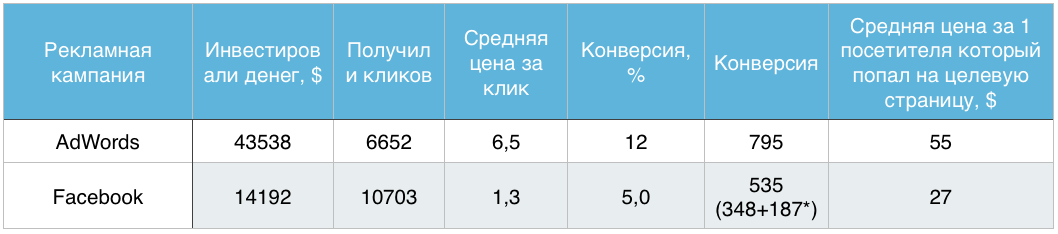
* - taking into account orders in the Facebook network itself. If a user has posted a Facebook order message, this is considered a conversion. There were 187 such orders.
From this table it follows that the cost of attracting a visitor to the landing page on Facebook is lower. But it’s too early to draw conclusions. First, you need to understand the specifics of user behavior in social networks. The user enters a social network primarily to update information about their environment (correspondence, events, photos, birthdays, etc.). In practice, most users are not specifically looking for anything. But search engines are used when there is a need to find or find out something. Secondly, the number of visitors who went to the landing page and the number of visitors who actually booked the tour may not coincide. Therefore, the next step is to check which of the visitors who hit the landing page actually made an order (including those who ordered the tour on Facebook).
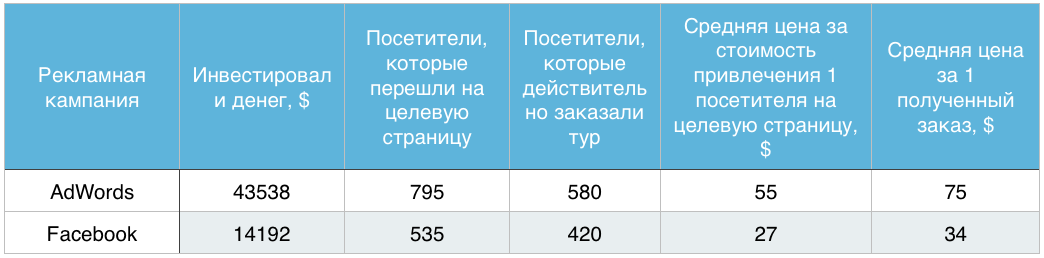
It turns out that the average cost of receiving 1 order from a visitor is $ 75 for Google AdWords and $ 34 for Facebook.
Part 3. Analyzing CRM. Sales Average check. Repeated sales.
We will divide all orders into 2 categories:
- Earned (Closed Won) - a customer ordered a tour and paid.
- Not earned (Closed Lost) - the client ordered a tour but did not pay (lost, changed his mind, canceled).
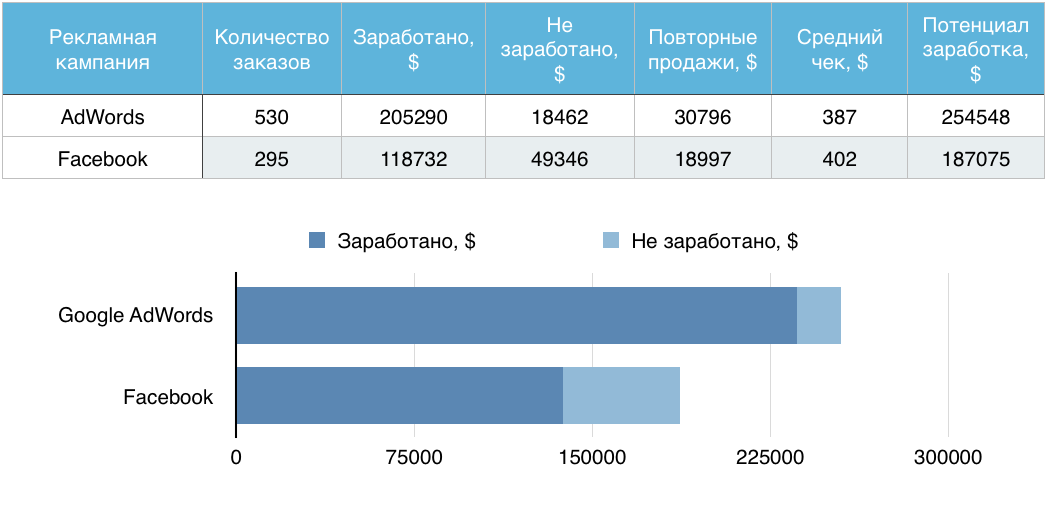
The summary table shows that 91% of Google AdWords customers paid for their orders. As for clients from Facebook, only 58% of them paid for their orders.
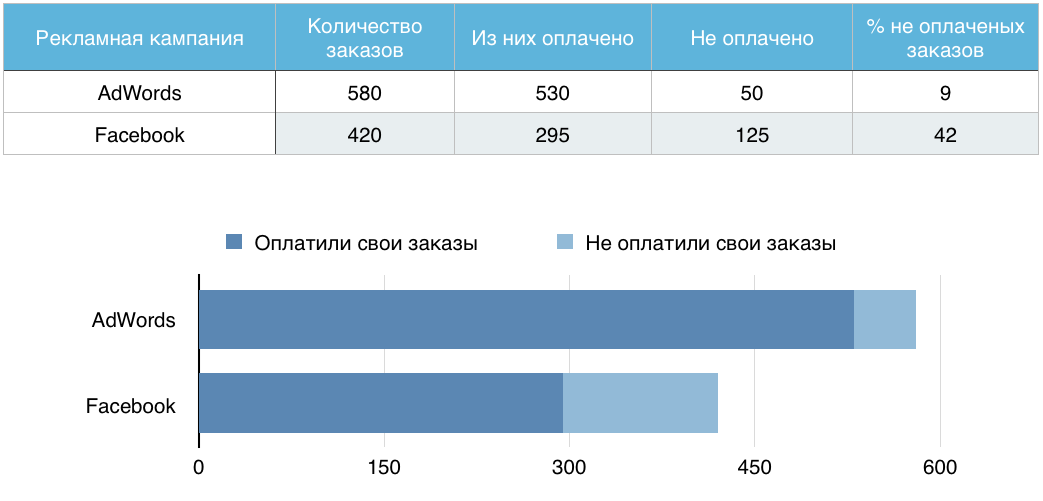
Conclusion: in our case, Google AdWords provides approximately 30% more responsible and solvent customers. On average, 9 out of 10 customers pay for their orders. As for Facebook clients, only 6 out of 10 pay for their orders.
Next, we calculate the total profit from all orders separately for AdWords and Facebook. The table also includes repeat sales to the same customers during 2017.
Part 4. We calculate the return on investment in advertising.
According to the formula of profit / invested capital we calculate the return on investment.
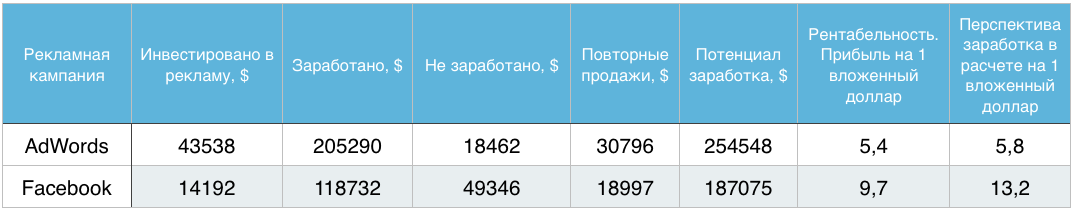
It turns out that by investing in AdWords advertising, we can earn 5.4-5.8 times more profit per each dollar invested.
By investing in Facebook advertising, we can earn 9.7-13.2 times more profit per each dollar invested.
In the end, according to data for 2017, it is more profitable to invest in Facebook advertising in the US travel market than in AdWords.
At the same time, as the budget of an advertising campaign on Facebook increases, the number of unpaid orders will inevitably increase. Those. the account manager will spend even more time on placing unpaid orders. You may need to hire additional managers.
Updated: Of course, this is not about net profit. This means a return on investment only in advertising. The tour operator has expenses. Salary to employees, commission to partners, maintenance costs, etc. This information was not provided by the business owner. In addition, CRM shows that the company has only 14 channels to attract visitors, and in this article only 2 are analyzed.
The business owner asks: Where is it more profitable to advertise? In other words, where is it better to invest a dollar in order to earn more profits and orders?
"')
So in order.
Part 1. Analyze attendance.
The overall picture looks like this:
From January 1 to November 1, 15.502 new visitors visited the site according to Google Analytics.
At the beginning, let's compare the attendance of Facebook and AdWords. We see that the traffic from social networks is 3 times higher than from AdWords, while the conversion is noticeably worse.
Facebook Attendance:
AdWords Attendance:
Facebook is the main source of traffic from social networks (gives almost 80% of traffic). At the same time, Facebook allows you to take an order without leaving the social network itself: the user simply sends a message to the manager through Facebook itself. Another situation is possible: Facebook user saw the contact number, called and placed an order by phone. In this case, we see a transition, paid click and order, but Google Analytics will not record a visit to the site by such a client. Accordingly, such indicators as attendance, conversion, etc. will need to be adjusted. In CRM customer such orders are entered and adjusted manually.
Also, according to conversion statistics, we see discrepancies. For example, this: 4 visitors came to our site for AdWords paid advertising, later they returned to our site via Facebook and filled out an order form on the site.
Another example: here we see that a visitor came to our site through contextual AdWords advertising, then he most likely looked for information about a company or product, returned to the site based on the results of the natural search engine results. After that, he again visited our site for contextual advertising. After that I moved from the social network. And after that, 3 more times I went to the site by contextual advertising and eventually filled out an order form on the site. There were two such users.
There are many similar examples, we will not dwell on them. I will just note that for accurate calculations, you need to look not only at the site attendance, but also the behavior of users. In general, we see that the conversion rate for visitors from Google AdWords is about 5 times higher.
By the way, we estimate the conversion by the attribution model of the last interaction (comparison model - last interation). Tourist products product is quite complicated, the sale of the tour stage is multi-stage. The decision to purchase is not taken immediately.
Part 2. Analyzing advertising campaigns
Google Adwords Campaign:
Facebook Campaign:
For convenience, we will put everything in one table:
* - taking into account orders in the Facebook network itself. If a user has posted a Facebook order message, this is considered a conversion. There were 187 such orders.
From this table it follows that the cost of attracting a visitor to the landing page on Facebook is lower. But it’s too early to draw conclusions. First, you need to understand the specifics of user behavior in social networks. The user enters a social network primarily to update information about their environment (correspondence, events, photos, birthdays, etc.). In practice, most users are not specifically looking for anything. But search engines are used when there is a need to find or find out something. Secondly, the number of visitors who went to the landing page and the number of visitors who actually booked the tour may not coincide. Therefore, the next step is to check which of the visitors who hit the landing page actually made an order (including those who ordered the tour on Facebook).
It turns out that the average cost of receiving 1 order from a visitor is $ 75 for Google AdWords and $ 34 for Facebook.
Part 3. Analyzing CRM. Sales Average check. Repeated sales.
We will divide all orders into 2 categories:
- Earned (Closed Won) - a customer ordered a tour and paid.
- Not earned (Closed Lost) - the client ordered a tour but did not pay (lost, changed his mind, canceled).
The summary table shows that 91% of Google AdWords customers paid for their orders. As for clients from Facebook, only 58% of them paid for their orders.
Conclusion: in our case, Google AdWords provides approximately 30% more responsible and solvent customers. On average, 9 out of 10 customers pay for their orders. As for Facebook clients, only 6 out of 10 pay for their orders.
Next, we calculate the total profit from all orders separately for AdWords and Facebook. The table also includes repeat sales to the same customers during 2017.
Part 4. We calculate the return on investment in advertising.
According to the formula of profit / invested capital we calculate the return on investment.
It turns out that by investing in AdWords advertising, we can earn 5.4-5.8 times more profit per each dollar invested.
By investing in Facebook advertising, we can earn 9.7-13.2 times more profit per each dollar invested.
In the end, according to data for 2017, it is more profitable to invest in Facebook advertising in the US travel market than in AdWords.
At the same time, as the budget of an advertising campaign on Facebook increases, the number of unpaid orders will inevitably increase. Those. the account manager will spend even more time on placing unpaid orders. You may need to hire additional managers.
Updated: Of course, this is not about net profit. This means a return on investment only in advertising. The tour operator has expenses. Salary to employees, commission to partners, maintenance costs, etc. This information was not provided by the business owner. In addition, CRM shows that the company has only 14 channels to attract visitors, and in this article only 2 are analyzed.
Source: https://habr.com/ru/post/342666/
All Articles