Optimize the speed of rendering web pages
Often, stories about how web developers take care of their applications start with the site rendering process, drop to the DOM level, and stop at statements like: "And this is fast because acceleration is used." Martin Splitt talks about bottom-up performance: he starts at a pixel and rises level after level, ending with the page layout.
The article is based on Martin's speech at the JavaScript conference of HolyJS 2017 in St. Petersburg, where he talks about how visualization takes place in browsers and what you need to do in order for your websites to “fly”.
About speaker
Martin is the head of the Archilogic engineering department. This is a small company that develops a web service of the same name that allows users to create virtual 3D tours in browsers on desktops and mobile devices.
Today we will talk about how to convert text into something visual. We start with markup and finish with pixels. How it works?
')

The first thing you need to know about performance optimization is how the site loads.
So, at the first stage there is a request to the server, from where it is necessary to obtain text data (HTML, CSS, JavaScript). Having received the text, we must mark it, that is, break it into elements and tags in order to work with it further.
When you deal with JavaScript, you need to get it all before you start working with the code. HTML has a tree structure, so you can start the analysis by getting one of the elements. Since the analysis is performed as you receive HTML data, it is called streaming.
When we have enough tokens, we begin to analyze them and create objects from them. Objects have a tree structure (for example, the document has a title, below it is text, an image, etc.). This is done not only for HTML, but also for CSS, so we have two trees - DOM and CSSOM.
After the tags have been analyzed and the objects have been received, we already know the sizes of these objects and can place them on the page. This stage is called layout.
When the page layout is created, it is necessary to make the objects visible. And the drawn objects are arranged to make a page. Once this process is complete, you can use JavaScript and CSS to make the pages dynamic.
Now we will dwell on these stages in more detail.
The analysis begins with the receipt of completed elements - like this:
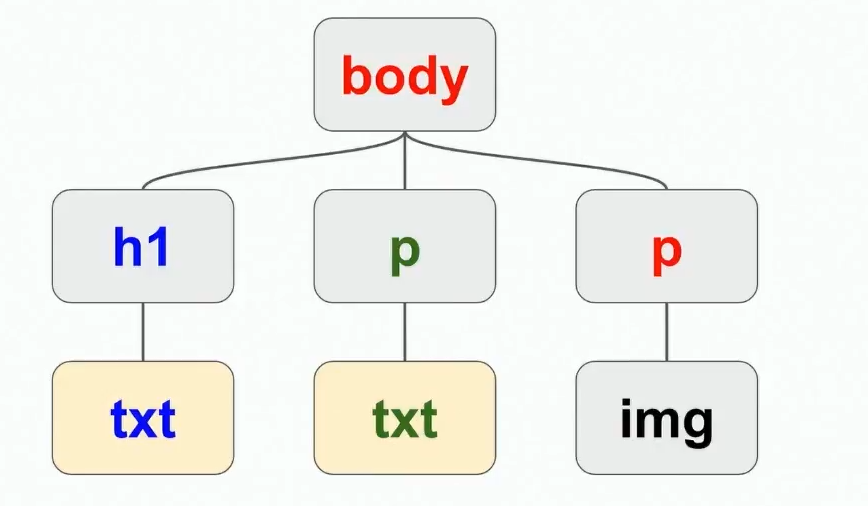
This is a complete element, so the browser decomposes it into a header element and a text node inside it.
Then the browser can see a paragraph element with a text node inside.
And another paragraph with the image, etc.
In the end, the browser says: “Ok, I have elements, I can build a tree.” It takes the body of the page, adds a title, text nodes, paragraphs, images, etc. He does this as new data is received.

This is what it looks like for style sheets. Here we see the external table and inline styles:
The problem with the external table is that we need to load it before doing something further. When the download is complete, we move on, see that the body of the page should be red, and color our tree.

Then we go to the next element and see that the title should be blue and the paragraph should be green. So we build the object model of the stylesheet.
But we do not visualize it. When you open a site, it looks wrong. Here are some things to keep in mind to improve the rendering speed during the site analysis phase:
Another moment. When analyzing animations and tables on how fast they are visualized, you can hardly catch all the problems in automatic mode, you always have to manually test. I know that the Chrome and Firefox developers are already working on improving performance measurement tools. Among them, animation inspectors who report how often it is rendered, new JavaScript API, measurement of build time. By the way, now you can estimate the rendering time. We ourselves use this opportunity, assessing how quickly the scene is visualized. If this happens too slowly, we turn off some things and test again.
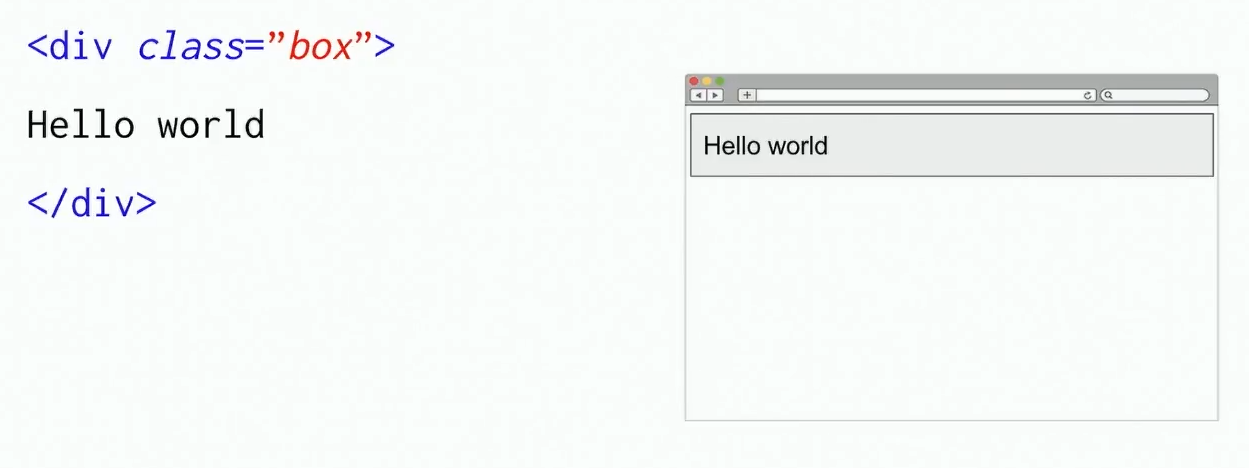
Now consider how the layout. For example, we have a class with some text.
The browser has a rectangle with the text on the entire width of the page.
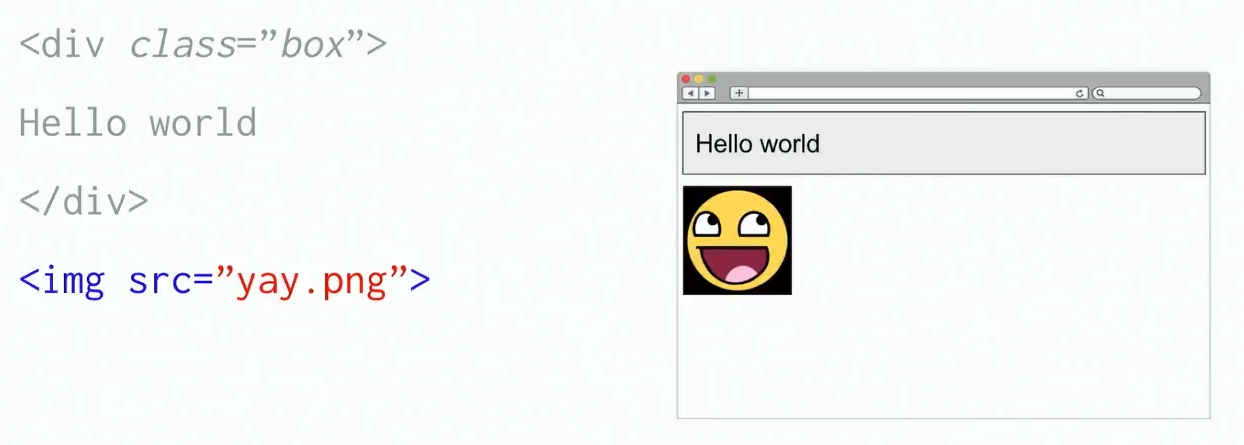
Then there is some image
It is located below, because the rectangle with the text occupied the entire width of the page.
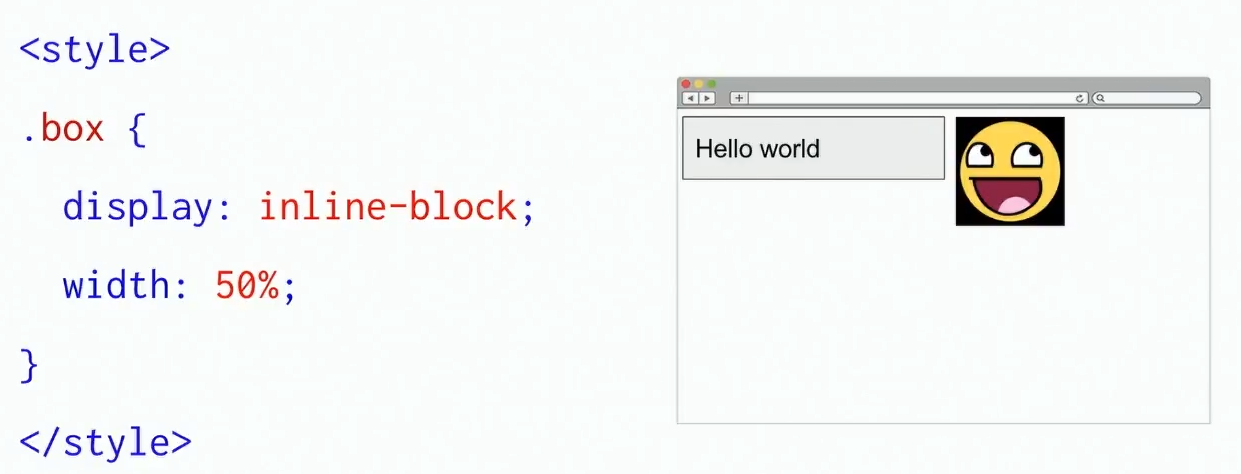
Now CSS is added to this:
And it turns out that the rectangle is an inline-block, which should occupy only half the width of the page. And if so, then the image appears above the place, so we transfer it there.
This is how layout works in a browser.
Here are some things that affect the speed of visualization, it is worth remembering at the stage of layout of the site:
To understand what is happening at this stage, remember what a pixel is. This is the smallest logical element of a two-dimensional digital image, consisting of three colors (green, red and blue), which differ in brightness. For each pixel, there are three numeric values that determine how bright the green, blue, and red will be.
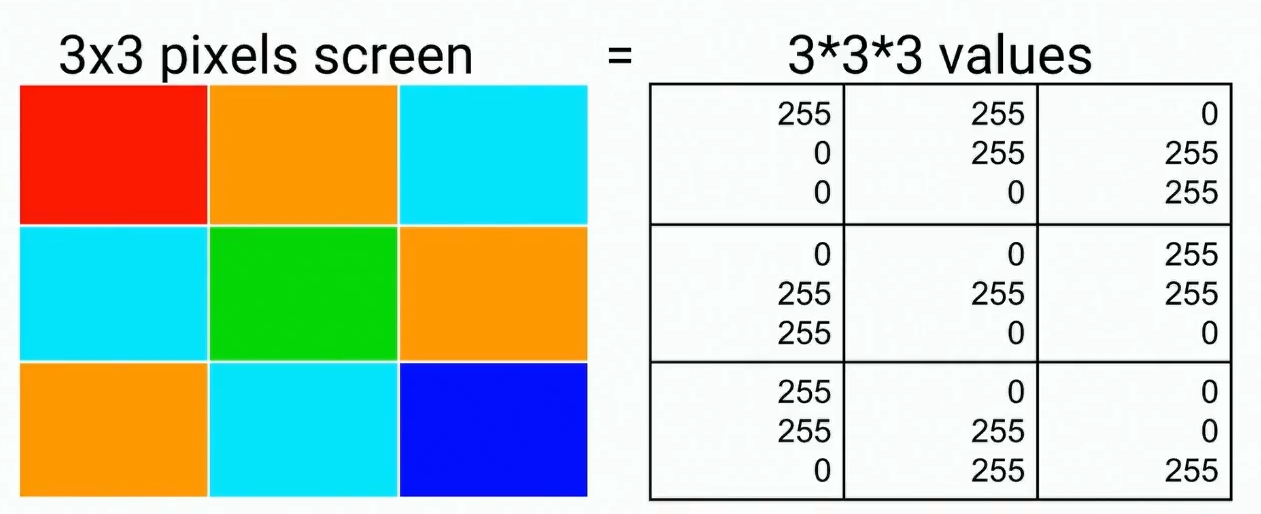
Therefore, drawing and rendering is in the end nothing but getting a list of numbers and writing them. It is very good that these numbers do not affect each other: we have three numbers for the first pixel, three for the second, etc. Therefore, if there is a need to make changes to some pixels, it will not entail a change in something else, there are no dependencies between the numbers. Also thanks to this we can write them in parallel, copy large volumes of numbers, etc.
Here are some things to keep in mind with respect to rendering:
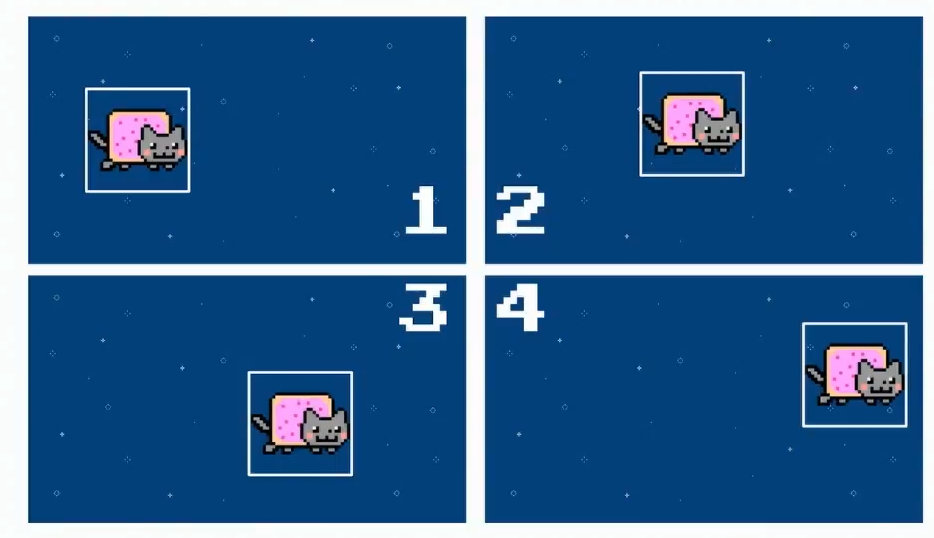
Since writing such a quantity of data is not rational, the layout is used. Instead of rewriting the pixel values each time, it’s enough to draw them once, keep them in memory and copy them from memory each time to speed up the process. Thus, if we have a background image and a picture with a cat in our memory, we can reuse them by placing the cat layer on top of the background in the right place.

We do not redraw all these pixels, we just change the numbers a little, getting, for example, an animation of a cat flying around the screen.
You can compose these images using blending - changing blending modes. In the blending process, a shader is applied to the two original layers - a function that shows how the layers should be mixed. Here is what it might look like in pseudocode:
In other words, for a specific pixel, the values of all layers are taken and combined in a certain way. There are 15 blending modes (multiply, screen, and others), each of which is essentially a formula by which colors are combined. For example, when using Multiply mode, the values are multiplied:
In this case, we get here such a cat:

After getting the mixed color, we can run another function - the filter. Examples of filters are opacity, contrast, color inversion, sepia, saturation, shadow casting, conversion to shades of gray, etc. For example, when using the Grayscale filter, the numerical values for the resulting color are added and then divided into three:
Thus, if the pixel colors were bright enough, when converting to shades of gray, we also get a bright image, and if they were faded - dark.
And this is how the Grayscale function actually looks like:
It is important that when using blending modes and filters, different browsers behave differently. Chrome is the only browser that redesigned the architecture so that visualization occurs only using layers. The rest of the browsers work roughly the same with CSS filters, but SVG filters for some reason I do not draw again. This happens in most browsers: Firefox, Safari, Internet Explorer, Edge.
So, what gives the layout:
However, it is worth remembering that each layer must be kept in memory, so you can not make many layers (otherwise mobile users will quickly face a memory shortage error). It is worth using layers only where they are needed, namely:
The will-change property is a hint for the browser, and the more hints, the better the rendering will be. That is, if you tell the browser: “I have this Canvas, and I'm going to change its location or size,” then most likely the browser will be able to process the page faster.
I propose now to play the game and check how you understand all of the above.
The code below moves the element 150 pixels to one side and then returns to its original position after 2 seconds. Answer the question whether this animation will be drawn, and then check the answer below.
Yes, it will, because this is a 2D transformation. No layers are used here, and the pixels will be redrawn.
Now the second round of the game, with a different code. He does the same thing, but with a different movement. Will this animation be drawn?
No, because 3D transformations are used here, which means layers.
Finally, the third round. What is it?
This is something that should not be done in any way. But I can change the rules of the game using the will-change property here. Now we have a two-second animation, and it can shift to the left. Do you think it is possible to use such a code?
It is possible, but only if the element does not depend on others in the layout (for example, the position of the element is absolute). If its position is relative, then when its position changes, other elements on the page will shift.
So, this is what you need to remember about layers and layouts:
A quote from Paul Lewis would be appropriate here: “Productivity is the art of avoiding work.” Always remember that when it comes to performance, the best thing you can do is do less.
Let's talk a little more about when to use Canvas 2D, and when to use WebGL.
Here is a simple example of using Canvas 2D. Suppose the size of our canvas is equal to the size of an HD frame. We have many objects in different places, make them of arbitrary size and then draw an image several times in different places and with different sizes. It's not that hard:
On the Y axis, we can see the number of frames per second, and on the X axis, the number of objects we are going to make. That is, the same object is drawn once, one hundred, two hundred fifty, five hundred and a thousand times.

Anything higher than the green line means super smooth rendering with a frame rate of more than 60 per second. The orange line shows how many frames the drawing still takes place smoothly, though not as fast as we would like. Red is a line behind which drawing is performed with jerks, in the mode of such a slide show (instead of smooth animation). As we can see, if the number of objects is 250, then the number of frames per second is significantly below the allowable one.
On the other hand, as can be seen in the graph below, when using WebGL, the same number of objects does not affect the number of frames per second.

Then they may ask me: “What if we use hardware acceleration?” As can be seen from the test result below, when rendering 10,000 WebGL objects, it gives at least 20 frames per second. This is not very cool, but in principle permissible. But with 2D Canvas, we get only 7 frames per second. And with 50,000 objects, the visualization will be very slow in both cases, but WebGL will give a slideshow, the speed of which is still twice as high.

That is why you should use WebGL not only for 3D, but also for 2D content, too.
However, do not think that you need to do EVERYTHING using WebGL, because it is fast. I always say this is a bad idea. You need to use the right tools, and not reinvent technology from scratch, as it happens if you start doing absolutely everything with WebGL.
Just remember what to use and when. And always try to make sure that you choose the right tool.
HTML + CSS is used to create:
SVG is used for:
Canvas 2D is convenient for creating:
WebGL should be used for:
I think that someday web animations will be able to play as fast as flash-animations used to be. Browser rendering engines are constantly improving. If you take the browser engine of 2010 and compare it with the modern one, you will see a big difference. Yes, of course, the engines are not perfect yet. The main problem of modern browsers is that they were created for less dynamic pages; now they must constantly adapt to interactive graphic applications.
Perhaps one of the best examples of what we will see in the near future is the experimental Servo engine from Mozilla. It uses hardware acceleration wherever possible, so where in other browsers visualization occurs at 60 frames per second, in Servo you get 120 FPS.
Those who are close to the topic of application performance will surely like the new report by Martin Better, faster, stronger - getting more from the web platform , which he will deliver at HolyJS in Moscow.
You may also be interested in other reports, for example:
The entire conference program is available on the website , tickets can be purchased here .
The article is based on Martin's speech at the JavaScript conference of HolyJS 2017 in St. Petersburg, where he talks about how visualization takes place in browsers and what you need to do in order for your websites to “fly”.
About speaker
Martin is the head of the Archilogic engineering department. This is a small company that develops a web service of the same name that allows users to create virtual 3D tours in browsers on desktops and mobile devices.
How does the site load from the network
Today we will talk about how to convert text into something visual. We start with markup and finish with pixels. How it works?
')
The first thing you need to know about performance optimization is how the site loads.
- HTML retrieved from web
- HTML text is parsed to tokens as they arrive.
- Tokens are object based (DOM / CSSOM)
- Objects are located on the page.
- Objects are drawn and assembled as a whole.
- Js or css can change content
So, at the first stage there is a request to the server, from where it is necessary to obtain text data (HTML, CSS, JavaScript). Having received the text, we must mark it, that is, break it into elements and tags in order to work with it further.
When you deal with JavaScript, you need to get it all before you start working with the code. HTML has a tree structure, so you can start the analysis by getting one of the elements. Since the analysis is performed as you receive HTML data, it is called streaming.
When we have enough tokens, we begin to analyze them and create objects from them. Objects have a tree structure (for example, the document has a title, below it is text, an image, etc.). This is done not only for HTML, but also for CSS, so we have two trees - DOM and CSSOM.
After the tags have been analyzed and the objects have been received, we already know the sizes of these objects and can place them on the page. This stage is called layout.
When the page layout is created, it is necessary to make the objects visible. And the drawn objects are arranged to make a page. Once this process is complete, you can use JavaScript and CSS to make the pages dynamic.
Now we will dwell on these stages in more detail.
How is the analysis of the site page
The analysis begins with the receipt of completed elements - like this:
<h1>Hello HolyJS!</h1> This is a complete element, so the browser decomposes it into a header element and a text node inside it.
<p>Lorem ipsum…</p> Then the browser can see a paragraph element with a text node inside.
<p><img…></p> And another paragraph with the image, etc.
In the end, the browser says: “Ok, I have elements, I can build a tree.” It takes the body of the page, adds a title, text nodes, paragraphs, images, etc. He does this as new data is received.
This is what it looks like for style sheets. Here we see the external table and inline styles:
<link rel="stylesheet" href="style.css"> <style> body { color: red; } h1 { color: blue; } </style> <p style="color: green">... </p> The problem with the external table is that we need to load it before doing something further. When the download is complete, we move on, see that the body of the page should be red, and color our tree.
Then we go to the next element and see that the title should be blue and the paragraph should be green. So we build the object model of the stylesheet.
But we do not visualize it. When you open a site, it looks wrong. Here are some things to keep in mind to improve the rendering speed during the site analysis phase:
- Use inline-styles for important CSS rules (color, position on the page, etc.) so that external CSS does not slow down the construction of the tree.
- When analyzing, pay attention to the order in which you receive the original HTML data.
- Minimize repetition when building a tree.
- Use server side rendering.
Another moment. When analyzing animations and tables on how fast they are visualized, you can hardly catch all the problems in automatic mode, you always have to manually test. I know that the Chrome and Firefox developers are already working on improving performance measurement tools. Among them, animation inspectors who report how often it is rendered, new JavaScript API, measurement of build time. By the way, now you can estimate the rendering time. We ourselves use this opportunity, assessing how quickly the scene is visualized. If this happens too slowly, we turn off some things and test again.
The location of objects on the page
Now consider how the layout. For example, we have a class with some text.
<div class="box"> Hello world </div> The browser has a rectangle with the text on the entire width of the page.
Then there is some image
<div class="box"> Hello world </div> <b><img src="yay.png"></b> It is located below, because the rectangle with the text occupied the entire width of the page.
Now CSS is added to this:
<style> .box { display: inline-block; width: 50%; } </style> And it turns out that the rectangle is an inline-block, which should occupy only half the width of the page. And if so, then the image appears above the place, so we transfer it there.
This is how layout works in a browser.
Here are some things that affect the speed of visualization, it is worth remembering at the stage of layout of the site:
- It is important to understand how the page will look at the layout level, not the content (where the blocks are located and what size they are).
- The layout is based on CSSOM + DOM, that is, if you have made important changes in JavaScript, you need to redo the layout.
- Layout determines the actual size of each element (when resizing elements, you need to re-do the layout).
- Layout can affect performance, so try to avoid changes in layout.
- Changes in the layout can lead to re-drawing of elements, which also affects performance (for example, when resizing an image, it is necessary to draw it on a new one).
- With animation, the layout can “fly off”.
Drawing objects
To understand what is happening at this stage, remember what a pixel is. This is the smallest logical element of a two-dimensional digital image, consisting of three colors (green, red and blue), which differ in brightness. For each pixel, there are three numeric values that determine how bright the green, blue, and red will be.
Therefore, drawing and rendering is in the end nothing but getting a list of numbers and writing them. It is very good that these numbers do not affect each other: we have three numbers for the first pixel, three for the second, etc. Therefore, if there is a need to make changes to some pixels, it will not entail a change in something else, there are no dependencies between the numbers. Also thanks to this we can write them in parallel, copy large volumes of numbers, etc.
Here are some things to keep in mind with respect to rendering:
- It does not occur consistently.
- This can affect performance (remember that the resolution of Full HD is 1920 × 1080, which is about two million pixels).
- At the same time, memory is used (even for an image with a resolution of 500x500 pixels, each of which has a volume of 3 bytes, 750 kilobytes of memory are needed).
Since writing such a quantity of data is not rational, the layout is used. Instead of rewriting the pixel values each time, it’s enough to draw them once, keep them in memory and copy them from memory each time to speed up the process. Thus, if we have a background image and a picture with a cat in our memory, we can reuse them by placing the cat layer on top of the background in the right place.
We do not redraw all these pixels, we just change the numbers a little, getting, for example, an animation of a cat flying around the screen.
You can compose these images using blending - changing blending modes. In the blending process, a shader is applied to the two original layers - a function that shows how the layers should be mixed. Here is what it might look like in pseudocode:
const shader = (x, y, layers, blend, filter) => { return filter( blend(x, y, layers) // returns colour ) // returns final colour } In other words, for a specific pixel, the values of all layers are taken and combined in a certain way. There are 15 blending modes (multiply, screen, and others), each of which is essentially a formula by which colors are combined. For example, when using Multiply mode, the values are multiplied:
color(x,y) = cat(x,y) * sky(x,y) In this case, we get here such a cat:
After getting the mixed color, we can run another function - the filter. Examples of filters are opacity, contrast, color inversion, sepia, saturation, shadow casting, conversion to shades of gray, etc. For example, when using the Grayscale filter, the numerical values for the resulting color are added and then divided into three:
(r, g, b) => (r + g + b) / 3 Thus, if the pixel colors were bright enough, when converting to shades of gray, we also get a bright image, and if they were faded - dark.
And this is how the Grayscale function actually looks like:
varying highp vec2 coord; uniform sampler2D layer; void main(void) { vec4 color = texture2D(layer, vec2(coord.s, coord.t)); float grayScale = (color.r + color.g + color.b) / 3.0; gl_FragColor = vec4(grayScale, grayScale, grayScale, 1.0); } It is important that when using blending modes and filters, different browsers behave differently. Chrome is the only browser that redesigned the architecture so that visualization occurs only using layers. The rest of the browsers work roughly the same with CSS filters, but SVG filters for some reason I do not draw again. This happens in most browsers: Firefox, Safari, Internet Explorer, Edge.
So, what gives the layout:
- Allows you to store different elements of the site in the form of layers in memory and arrange them as needed.
- Accelerates site loading due to the fact that copying operations from memory occur very quickly.
- Allows you to make some changes without re-drawing, using blending modes and filters.
- Allows you to move data to another position, perform scaling and rotation.
However, it is worth remembering that each layer must be kept in memory, so you can not make many layers (otherwise mobile users will quickly face a memory shortage error). It is worth using layers only where they are needed, namely:
- video, canvas - for video and games that contain a large number of changing frames;
- 3D transformations;
- composite animations (where moving, rotating, scaling data are involved);
- The new property will-change, with which you can specify what exactly you plan to change many times.
The will-change property is a hint for the browser, and the more hints, the better the rendering will be. That is, if you tell the browser: “I have this Canvas, and I'm going to change its location or size,” then most likely the browser will be able to process the page faster.
Let's play: practical examples
I propose now to play the game and check how you understand all of the above.
The code below moves the element 150 pixels to one side and then returns to its original position after 2 seconds. Answer the question whether this animation will be drawn, and then check the answer below.
#transform { transform: translateX(150px); } setTimeout(() => { el.style.transform = 'translateX(0)' }, 2000) Yes, it will, because this is a 2D transformation. No layers are used here, and the pixels will be redrawn.
Now the second round of the game, with a different code. He does the same thing, but with a different movement. Will this animation be drawn?
#transform { transform: translate3d(150px, 0,0); } setTimeout(() => { el.style.transform = 'translate3d(0, 0, 0)' }, 2000) No, because 3D transformations are used here, which means layers.
Finally, the third round. What is it?
@keyframes move { 0% { left: 0; } 100% { left: 200px; } } This is something that should not be done in any way. But I can change the rules of the game using the will-change property here. Now we have a two-second animation, and it can shift to the left. Do you think it is possible to use such a code?
#transform { will-change: left; animation: move 2s infinite; } It is possible, but only if the element does not depend on others in the layout (for example, the position of the element is absolute). If its position is relative, then when its position changes, other elements on the page will shift.
So, this is what you need to remember about layers and layouts:
- It is worth avoiding the re-layout and rendering - it reduces performance. Layers can be useful, but be careful. Do not create them if you are not sure if they are necessary in order not to use too much memory.
- Measure first, then optimize. Test your animations using the developer console in the browser, watch how often the elements are drawn, measure the memory usage.
- Try to use the layout wherever possible (enable the property will-change, 3D-transformation, etc.)
A quote from Paul Lewis would be appropriate here: “Productivity is the art of avoiding work.” Always remember that when it comes to performance, the best thing you can do is do less.
Canvas 2D and WebGL performance comparison
Let's talk a little more about when to use Canvas 2D, and when to use WebGL.
Here is a simple example of using Canvas 2D. Suppose the size of our canvas is equal to the size of an HD frame. We have many objects in different places, make them of arbitrary size and then draw an image several times in different places and with different sizes. It's not that hard:
for(var i=0; i<NUM_OBJECTS; i++) { var x = Math.random() * HD_WIDTH, y = Math.random() * HD_HEIGHT, size = Math.random() * 512 ctx.drawImage(img, x - HALF_SIZE, y - HALF_SIZE, size, size ) } On the Y axis, we can see the number of frames per second, and on the X axis, the number of objects we are going to make. That is, the same object is drawn once, one hundred, two hundred fifty, five hundred and a thousand times.
Anything higher than the green line means super smooth rendering with a frame rate of more than 60 per second. The orange line shows how many frames the drawing still takes place smoothly, though not as fast as we would like. Red is a line behind which drawing is performed with jerks, in the mode of such a slide show (instead of smooth animation). As we can see, if the number of objects is 250, then the number of frames per second is significantly below the allowable one.
On the other hand, as can be seen in the graph below, when using WebGL, the same number of objects does not affect the number of frames per second.
Then they may ask me: “What if we use hardware acceleration?” As can be seen from the test result below, when rendering 10,000 WebGL objects, it gives at least 20 frames per second. This is not very cool, but in principle permissible. But with 2D Canvas, we get only 7 frames per second. And with 50,000 objects, the visualization will be very slow in both cases, but WebGL will give a slideshow, the speed of which is still twice as high.
That is why you should use WebGL not only for 3D, but also for 2D content, too.
However, do not think that you need to do EVERYTHING using WebGL, because it is fast. I always say this is a bad idea. You need to use the right tools, and not reinvent technology from scratch, as it happens if you start doing absolutely everything with WebGL.
Just remember what to use and when. And always try to make sure that you choose the right tool.
HTML + CSS is used to create:
- Semantic and accessible content
- Graphic primitives
SVG is used for:
- Images that scale well
Canvas 2D is convenient for creating:
- Simple 2D animations
WebGL should be used for:
- 3D content and any games
I think that someday web animations will be able to play as fast as flash-animations used to be. Browser rendering engines are constantly improving. If you take the browser engine of 2010 and compare it with the modern one, you will see a big difference. Yes, of course, the engines are not perfect yet. The main problem of modern browsers is that they were created for less dynamic pages; now they must constantly adapt to interactive graphic applications.
Perhaps one of the best examples of what we will see in the near future is the experimental Servo engine from Mozilla. It uses hardware acceleration wherever possible, so where in other browsers visualization occurs at 60 frames per second, in Servo you get 120 FPS.
Those who are close to the topic of application performance will surely like the new report by Martin Better, faster, stronger - getting more from the web platform , which he will deliver at HolyJS in Moscow.
You may also be interested in other reports, for example:
- Faster Angular applications (Minco Gechev)
- New Adventures in Responsive Web Design (Vitaly Friedman)
- Dirty animations in the world of states (Alexey Taktarov)
The entire conference program is available on the website , tickets can be purchased here .
Source: https://habr.com/ru/post/342632/
All Articles