Classification of the humanities and techies by comments in VK
Hi, Habr! I want to share my experience in classifying users of a social network according to their comments into two classes according to the way they think: humanitarian or technical. This article will not use the latest achievements of deep learning, but will be analyzed the completed project on the classification of texts: from finding suitable data to predictions. At the end there will be a web application in which you can check yourself.
Formulation of the problem
The task in our case of a binary classification is set as follows: there is a user, there are his comments, and it is necessary to determine the class from them: humanities or techies. To solve this problem, we apply the technique of machine learning and natural language processing. The final result can be used, for example, for targeted advertising.
Data
There is no existing labeled sample: it is difficult to formalize these concepts, and it will be necessary for some reasons to divide users into two classes.
It was decided to collect your data set based on the comments of the users of the social network “VKontakte”. On public pages, people usually discuss posts or simply communicate, leaving many comments. The public / group page should be neutral in order for the number of humanities and techies to be approximately the same. I chose a public page dedicated to discussing the life of a particular city. The number of subscribers is about 300 thousand, the number of publications is about 50 thousand, the average number of comments for a publication is 20.
Receiving and marking data
You can download all comments using VK Open API, with which it was received about 3 million comments from 130 thousand users. This amount should be enough to reserve almost any model of machine learning, but there is one “but”: we do not have the markup of this data, we do not know who is the humanities and who is techie. Of course, one could try to write to each of the users and ask them personally, but this is a dubious idea. We'll have to use the knowledge that we can get from the pages of users.
Only 11 thousand out of 130 people were given the faculty of education. As a result of this filtering, only 170 thousand comments remained, which is only 6% of the initial volume. In total, there were 160 different faculties. I divided all faculties into humanitarian, technical, and other (natural or non-scientific, for example, music or art). These “other” faculties were abandoned and did not participate in the experiment. Each user was assigned a class in accordance with the faculty, which was listed in his profile.
Perhaps not all who study in the humanities departments are humanities scholars, and the same can be said about technical ones, but against the general background of such users there should be a minority. To confirm or refute this theory, I organized a poll in my department. Of the 200 people, 62 (that is, 31%) indicated that their mentality is humanitarian despite the fact that the faculty itself is technical. Similarly, at the Faculty of Humanities, out of 150 respondents, 14 people (only 9%) admitted that they were techies at heart. Thus, it is more correct to call the classification according to such data a classification according to the type of higher education received.
Data analysis
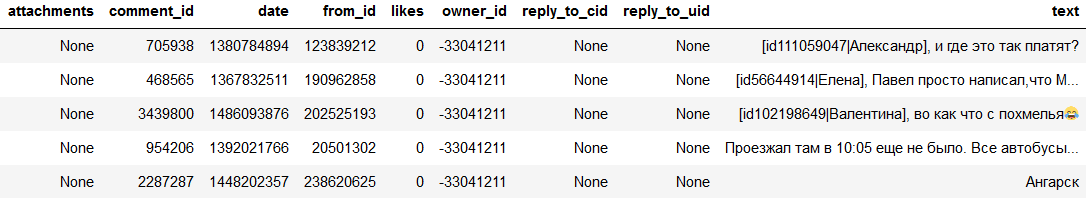
An example of a table with data by comments:
Before proceeding to the construction of models, it is necessary to analyze the existing sample. This will help you understand which attributes need to be considered, how they are distributed, and which models are best to use. It also helps to find outliers and anomalies in the data that are not typical for a given sample. Their removal will help to build a model with a greater generalizing ability. After the separation of users in both classes, about 4000 people turned out. First, look at the distribution of non-text features of users.
Floor
In the sample of male users turned out to be 55%. In society, there is a stereotype that men have a more analytical mind, and women have a humanitarian or creative mind. According to the sample, a graph is drawn that shows the distribution of this attribute separately into two classes.
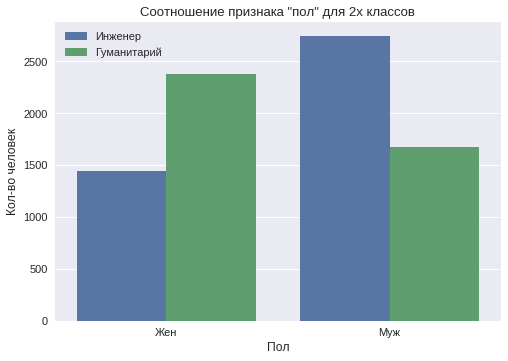
It can be seen that among the male users the “techie” class prevails, and among the female users the “humanities” class prevails.
attitude to alcohol
About 1500 users from each class noted their attitude to alcohol and about 1600 - to smoking. Of course, many do not fill this item on social networks, only 30% had it listed. Some of them could have provided false information in order to show themselves in the best light or impress classmates. But the general trend in the distinction between the two classes is still visible.
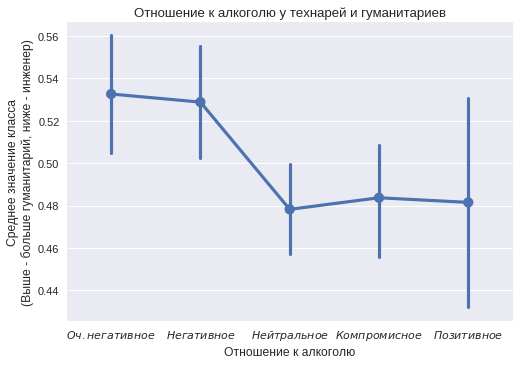
On the abscissa axis are categories from "very negative" to "positive" attitude to alcohol. For each category was considered the number of people in both classes. The ordinate axis indicates the proportion of humanities in the group. The vertical bar indicates the confidence interval. The graph shows that techies often indicate in their profile a positive attitude towards alcohol. Very negative attitudes often indicate humanities.
Attitude towards smoking
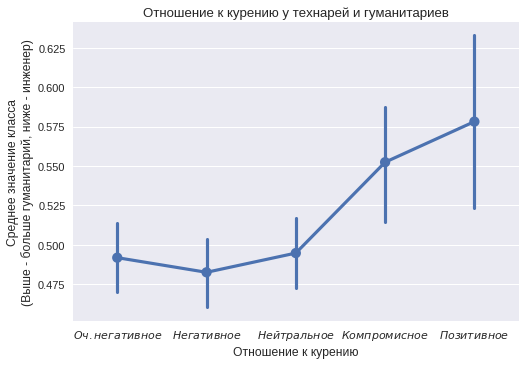
In relation to smoking, the opposite situation is visible. Users from the “humanities” class more often indicate a positive attitude towards smoking. It can be seen that not all values differ from statistically significant (some confidence intervals include the value of 0.5, which means that no distinction can be declared), but the trend is still interesting.
Marital status and the main thing in life
On the basis of "marital status," there is only a strong bias in two: "everything is difficult" and "actively searching." Both of them are biased towards the humanities.
On the basis of “the main thing in life” - there is only one significant deviation - “beauty and art” - and it is in the direction of the “humanities” class.
Activity time
We construct the distribution of user activity at different times of the day.
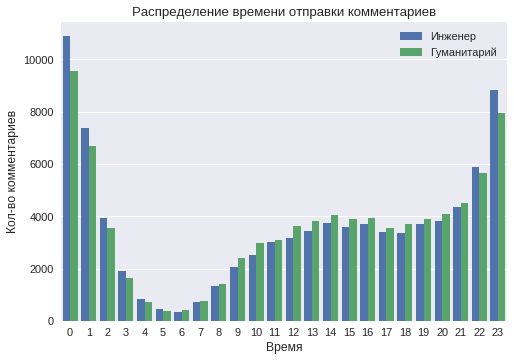
The graph shows that at night (from 11 to 2) the number of comments from the techie class is much larger. This suggests a more "night" lifestyle of users of this class. It can also be seen that the least activity is observed at 5-6 o'clock in the morning. Nevertheless, starting at 4 o'clock in the morning, the number of comments from users of the humanities class is much larger, which indicates an earlier rise time.
Comment Examples
Before further analysis, you can see the comments themselves. Below are a few examples from both groups.
Class "techie": " Anton, have you ever stopped on the locked wheels? What is the stopping distance? "," We will support ours, of course) on the 21st on Labor) "," The first photo is very original and very beautiful! ".
The class “humanities”: “ Very cute kittens”, “=))) ”, “ In my opinion, everything is being done so that the children know as much as possible about drugs. "," I do not have time for the speed of your thoughts)))) I am hopeless . "
It is seen that the comments are written on different topics. You can try to find differences in the topics covered. Words will need to lead to the initial form to avoid many similar words that have the same meaning. Perhaps even a simple selection of the words used can divide the two classes well. Also, great attention should be paid to the smilies, emoji and punctuation used.
Data preprocessing
Initially, it is necessary to remove too long and too short comments from the sample. They can interfere with generalizing models. The maximum length was limited to 50 words, and the minimum - 3 words. Next you need to get rid of spam. First, all comments were deleted, which included links to third-party sites, they turned out to be less than 1%. Then messages were deleted that were repeated more than 2 times, which means they were spam, also less than 1%.
There were a lot of hits in the data. In the comments you can contact a specific person through a link to his page. When downloading via API, the names are replaced with the user's page id. In order not to clutter the model with id information, as well as to prevent the memorization of specific individuals, all appeals were deleted.
Feature generation
After analyzing and clearing data in machine learning tasks, the stage of building and selecting features begins. The usefulness of the final model directly depends on the quantity and quality of the features obtained.
Before you start working with the text, you need to tokenize it, that is, break it into words. This can be done using stemming or lemmatization . Stemming is a selection of the stem of the word, folding the ending. For example, the words: “democracy”, “democratic”, “democratization” are brought to the word “democrat”. Lemmatization is the reduction of the word to the initial form. All three words from the previous example are given to the word “democracy.” In this task, the lemmatization performed with the pyMorphy2 library worked better .
Text vectorization
Comments need to be transformed into vectors, because most machine learning models take numerical vectors as input. The simplest approach is called a bag of words : it counts the number of entries in the text of each of the words. Before you get vectors in this way, you need to get rid of stop words. These are words that occur very often and do not carry a semantic load, for example, “otherwise”, “this”, “or” and so on.
This approach does not take into account the word order in the sentence. The phrases “non-black cat” and “black cat” will not be converted to the same vector, because they have the same set of words. To solve this problem, you can use successive tokens - N-grams.
The same feature vectors can be constructed at the character level. The text is divided into N-grams of characters, where N is usually taken equal to three. The word "forest" is divided into: "forest", "ec", "clear", "Noah". This approach has a great advantage: it is more resistant to new words that were not in the training set.
Tf-Idf was also used for text vectoring . This is a statistical measure used to assess the importance of a word in the context of a document that is part of a collection of documents or a corpus. Words with a high frequency within a particular document and with a low frequency of use in other documents receive great weight. In more detail on Habré, for example, here .
The most recently tested vectorization model is word2vec . A vector representation is based on contextual intimacy: words occurring in a text with a single context will have close coordinates in the vector representation. On the Internet, you can find models already trained on large buildings that match the word to its vector. Excellent examples of the work word2vec on Habré.
Other signs
Other sources of signs are the general characteristics of the commentary. They describe the commentary as a whole.
Punctuation signs:
- the presence of direct speech;
- the number of commas, question marks, exclamation marks, dots;
- number of smiles like ")", "))", "((".
Signs of content:
- percentage of words written by caps lock;
- percentage of English words;
- the presence of a large letter at the beginning of a sentence.
Common symptoms:
- number of words;
- number of offers;
- average word length;
- average sentence length.
The process of obtaining predictions
Having received the feature vector, we proceed to the training of models. Using an ensemble of several models instead of one is preferable, since it improves accuracy and reduces the variance of predictions. Several models are built, then they are polled for each object that needs to be classified, and the winner is selected by a majority of votes, the principle of simple voting.
The users were divided into two parts in the proportion of 80 to 20. At the first training of models was conducted, on the second - testing. Since the classes were balanced, accuracy was taken as the metric - this is the ratio of the number of correctly classified examples to the total number of examples.
The final task is to classify users, but since the classification is carried out according to text comments, the models will classify each comment separately. To make a prediction for the user, we will issue the most frequent class predicted for his comments by an ensemble of models.
Each model will be trained on its own subset of features. Thus, the models are more resistant to outliers, their predictions become less correlated, and the generalization error is minimal.
Used models
Linear regression is a model that weights input features linearly. Linear models are well suited for problems with a large number of sparse features, and the vector representation of the text is just that. You can also interpret weights before signs. For example, in the case of vectoring using a bag of words, a positive weight in front of a word means that the probability of belonging to the first class is greater.
Multilayer neural network - a model that consists of several layers with neurons. Due to the repeated use of the activation function, the neural network is a non-linear function, which allows, theoretically, to capture more complex data dependencies.
A recurrent neural network is a type of neural network that was specifically created for modeling and analyzing sequences (for example, words or symbols). With this model it turns out to take into account not only the presence of specific features, but also their order.
Predictions of neural networks are much more difficult to interpret. To get good results, you need to go through a lot of hyperparameters: the number of neurons, the number of layers, the amount of regularization and others. For training neural networks, the Keras framework was used . More details about neural networks can be found in a series of articles on habr .
The three models that were listed above accept comments with different vectorization options as input: a bag of words, Tf-Idf, word2vec. The technique of the bag of words was applied both at the level of words and at the level of symbols. As mentioned above, the more different models, the better, so several variants of the same models with different hyperparameters were selected.
The latest model is a gradient boosting of trees . This algorithm shows good results in the case of working with quantitative and categorical features. Unlike previous models, she studied the general characteristics of a comment (the number of commas, the average word length, and other statistics). Used library XGBoost .
With the help of validation, models were selected that showed the best quality at the user level. They entered the final ensemble. A correlation between model predictions was also analyzed.
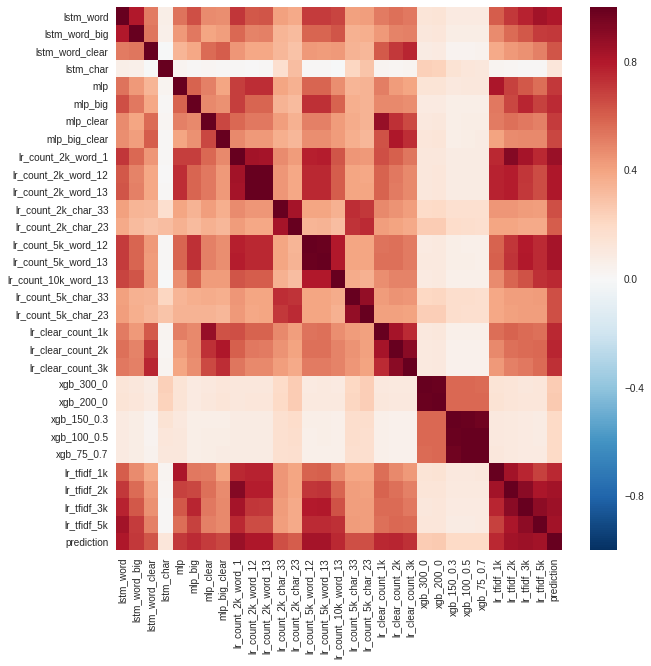
It can be noted that the predictions of the models of gradient boosting (xgb) and the recurrent network at the character level (lstm_char) differed the most. String prediction - the ensemble of all models.
The models were chosen for the ensemble not only in terms of accuracy, but also due to the uncorrelated predictions. If the two models have the same accuracy and are very similar, then there will be no sense in averaging them.
results
The quality of the final model depends on the minimum number of comments that will be used to classify one user. In theory, the more comments, the better.
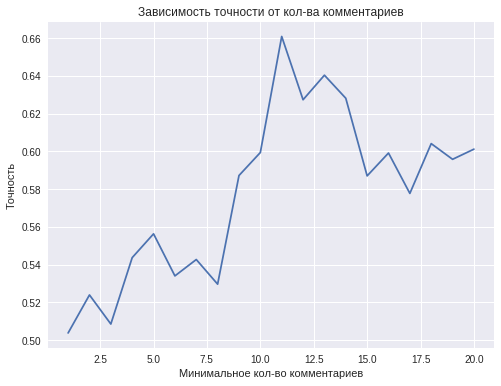
However, with an increase in the minimum number of comments from one person, the number of people who have this or more comments, i.e. decreases the size of the training sample. For example, about 4,000 people have 2 or more comments, and less than 1,000 people have 10 or more comments. This explains the decrease in the classification accuracy with an increase in the number of comments of one user to 11 or greater values.
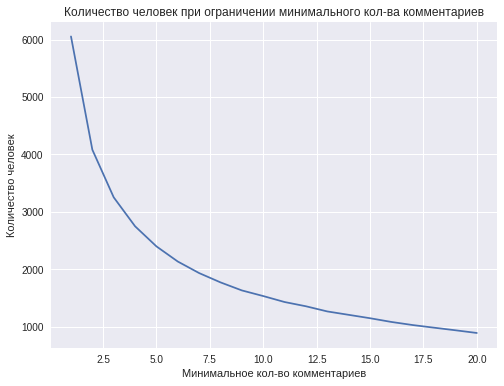
The best accuracy of 0.66 is achieved using 11 comments from one person. This result is not enough to talk about the successful solution of the classification problem, but still this accuracy is superior to the quality of predictions with the help of a coin toss. Further results can be improved by collecting more data.
The most important for the gradient boosting model, which does not directly use the words of comments, are the following features:
- average word length;
- number of words;
- share of English words in the comments;
- use of exclamation mark.
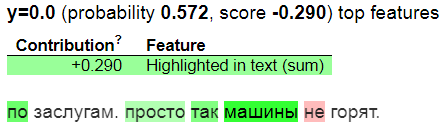
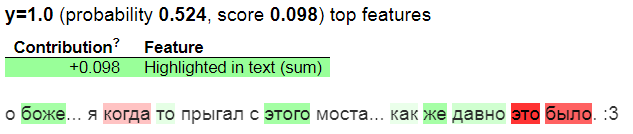
With the help of the eli5 library, we visualize the predictions of a linear model that works on top of the text in the form of a bag of words:
At the character level:
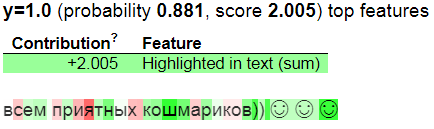
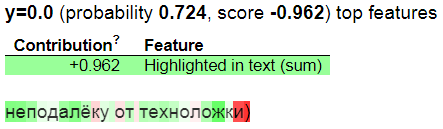
Green highlights the words and symbols that contribute the most to the predicted class, and red which contribute to the opposite class. y = 1 means that the model predicts the humanities class, y = 0 - the techie.
Web service
To demonstrate the work, I deployed the model as a web service. Flask was used as a backend, a simple design was made using Bootstrap, and Heroku was used for hosting. You can try it yourself at www.commentsanalysis.ru .
An important limitation was the time of the formation of a single prediction. Because of this, it was decided to leave only 5 of the best linear models for the ensemble.
The site has four main blocks: a brief instruction, a field with a random comment, a field for entering a user comment, and a field with the result of the classification. After at least 5 comments are entered, the result can be predicted.
Now that the system is developed and running, you can think about its application. For example, humanities students studying at technical faculties can be automatically transferred to more suitable faculties.
Link to github .
PS: thank you so much olferuk for editing the text.
')
Source: https://habr.com/ru/post/342572/
All Articles