Targeting the Odnoklassniki Moderator application
The Odnoklassniki social network, like other Internet resources, where users can download any content, has the task to filter images that violate the laws of the Russian Federation and the license agreement of the site itself. Such content in the social network is pornography in the public domain, as well as scenes of violence, cruelty and other horrible pictures.
Every day more than 20 million pictures are uploaded to the social network. In order to check them, our tools based on neural networks automatically filter images of certain categories. However, we skip some of the content through manual layout, as it is not always the neural model can unambiguously determine whether there is prohibited content in the picture or not. Our favorite example of borderline content is the “seemingly” sofa.

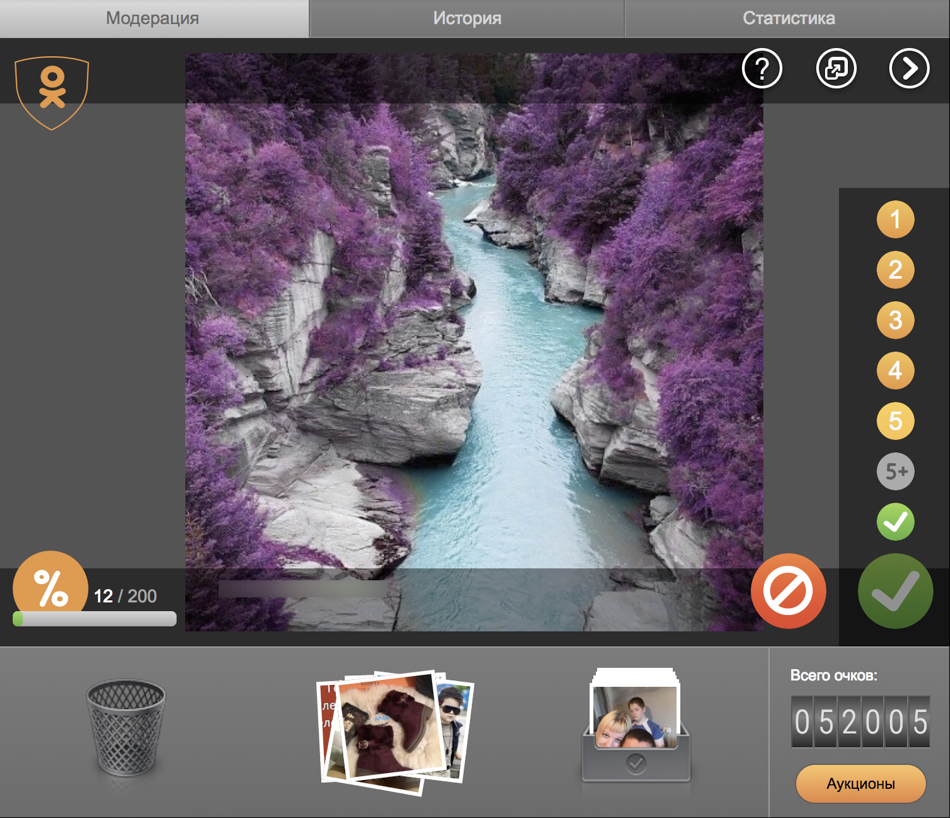
In addition to internal moderation, we have created the Odnoklassniki Moderator gaming application, where any social network user can process a stream of images, dividing photos into prohibited content and “good” - one that complies with the social network rules. For each correct decision, the moderator gets points, which can then be spent on the purchase of internal paid services of Odnoklassniki. Of course, users in the application are shown only public and public images. Below is an example screenshot of the application.

The markup from the application is further used to train neural models. And if it will be interesting to someone to read about how we gamified image markup, we will write a separate article about it. :)
Task
DAU (daily active users - the number of unique users per day) of the Odnoklassniki Moderator application is modest: about 40 thousand. This allows you to mark 3-4 million images per day. The problem, the solution of which we describe below, was to increase the DAU. After all, the more users will play, the more pictures will be marked.
In addition, we agreed that as a result of new users we will attract not so much, but at the same time the number of marked images per day will be significantly increased, then this result will also be positive. To cope with the task, we decided to use the methods of machine learning. All classifiers described below were built in Python using scikit-learn.
The first stage of creating a model
So, we are faced with the task of binary classification of users. Separate them into those who might like the application and those whom it is most likely not interested in. Let's start with the training sample preparation. Since we have statistics on users of the application (the application has been running since 2014), we select them as learning objects. Now we will define two things:
- How to divide users into two classes: interested and disinterested.
- What signs of the user to take for training.
It is logical to assume that if the user liked the application, then he will play repeatedly. Conversely, if the application is not attracted, it is unlikely that the user will return after the first game. We decided to divide users by this attribute as follows:
- Those who continue to play the app seven days after the first game are considered interested.
- Those who played once and never returned are considered disinterested.
As a result, we have the following training sample size: about 133,000 interested and about 262,700 uninterested users.
Half the battle is done, it's time to choose the signs.
For a start, we took the usual signs such as gender and age. Then we began to argue: what can motivate a user to help us moderate forbidden content? Most likely, this is a category of people who oppose it in public access. Such users are more likely than others to click the "Report" button. Therefore, the following sign, we took the number of complaints about the content.
In addition to "bright" goals, a person may have a small self-serving interest: get a paid service for free for marking pictures. Therefore, we added signs related to the purchase of Odnoklassniki services. And of course, we could not help but wonder what other applications the user ran on Odnoklassniki. Using the chi-square criterion (the filtering method of the chi-square test), we selected the applications that were most significant for the classification, and which became our last signs.
As a result, we have a dataset of about 396,000 users with 49 features. Dataset divided into training and test samples. The first sample was used for training, and the second one - for comparison of the following classifiers: kNN, SVM, AdaBoost, RandomForest, DecisionTree, LogisticRegression, GradientBoostingClassifier.
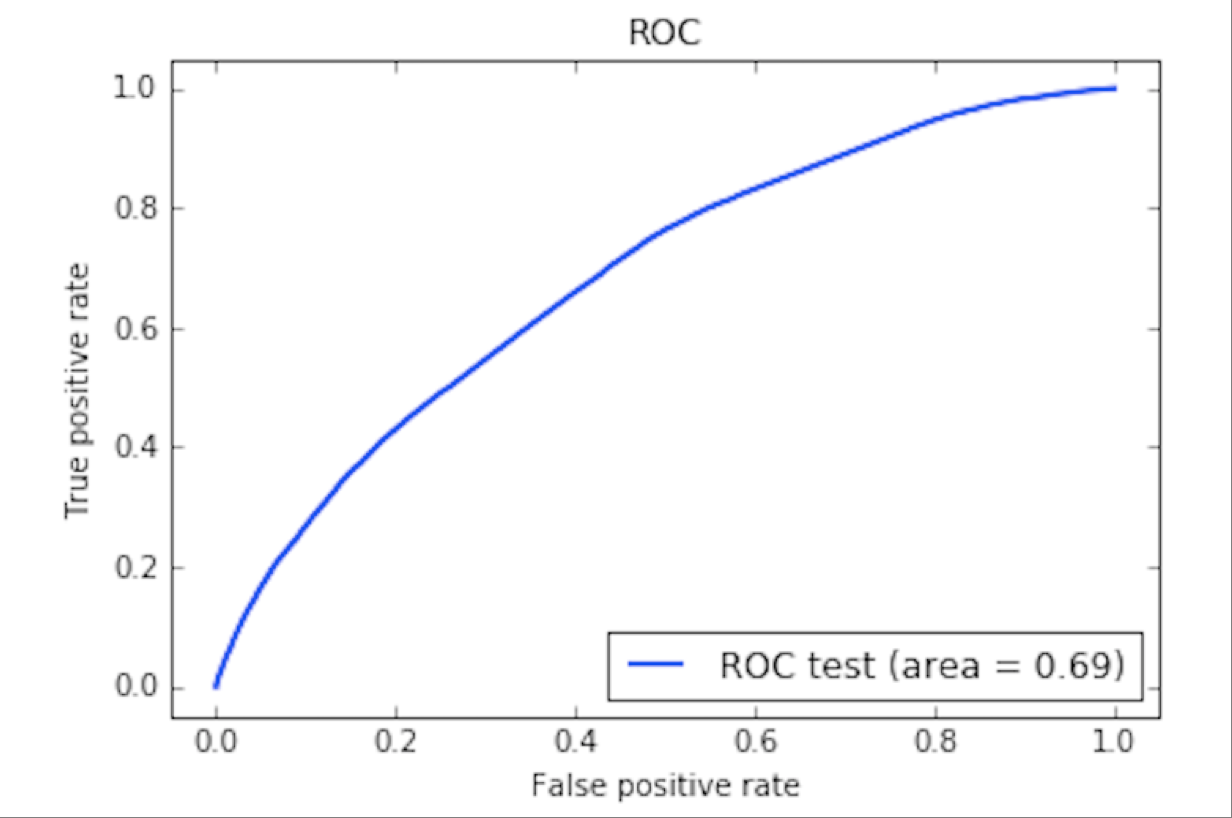
Classifiers have their own initial parameters (for example, the number of kNN neighbors) on which their quality depends. Such parameters were selected for each classifier on the training sample using cross-validation. For this, GridSearch and Stratified KFold from scikit-learn were used. For trained classifiers with selected parameters, ROC-curves (receiver operating characteristig) were built on the test set. After that, the classifiers were compared by AUC score (area under ROC-curve, the area under the ROC curve) of the corresponding ROC curves. The higher this indicator, the better the classifier is considered. As a result, the GradientBoostingClassifier classifier turned out to be the best in AUC. Below is shown its ROC curve for learning outcomes.
Field tests of the first model
We tested the resulting classifier for 500,000 random users. After that, they were filtered by activity on the social network, by age (our application has a rating of 18+) and received 3,949 candidates. Candidates within Odnoklassniki were sent out with invitations to try our application.
During the week from the moment of sending the messages, only 59 people entered the application (1.5% of the total number of candidates). The results were, to put it mildly, far from desired.
Nevertheless, 59 new users processed about 19,000 images in a week, so we did not despair and decided to make a second attempt.
The second stage of creating a model
In the second attempt, we decided to change the approach to the division of users into two classes. The main focus was on increasing the number of processed images. Based on this criterion, we identified interested users who play constantly and mark out more than 6,000 images per week.
We unloaded the data for the week and received a new size of the training sample: about 4,400 interested users, about 7,740 disinterested (less than 5 marked-up images) and about 106,630 users who checked from 5 to 6,000 images.
In dataset added new signs: the fact of filling the profile (marital status, school, university, place of work), the user's karma: added it to the black list, complained about its content, and also activity in the social network: the creation of posts, "classes" , comments to the content of other users.
We also added information about which applications the user opened in the last month (after all, a person’s tastes may change over time, but we are interested in the current state of affairs).
Having collected a new dataset, we decided to look at the most significant signs. Some of them turned out to be suspiciously good. For example, the distribution of the sign of "evaluation of photos" among categories of users was as follows.

On the graph on the X axis - the number of photo ratings for the week, and on the Y axis - the proportion of users from the relevant category who gave X ratings. The fact is that the interface of our application (in the screenshot, the ratings column on the right) allows the player to, among other things, put ratings on the photos to be checked during the parsing of pictures, which explains the resulting graph.
In this regard, we decided to remove this and similar suspicious signs from the sample. But by age, for example, it turned out to be a more interesting picture (see graph below), so the age criteria were left.
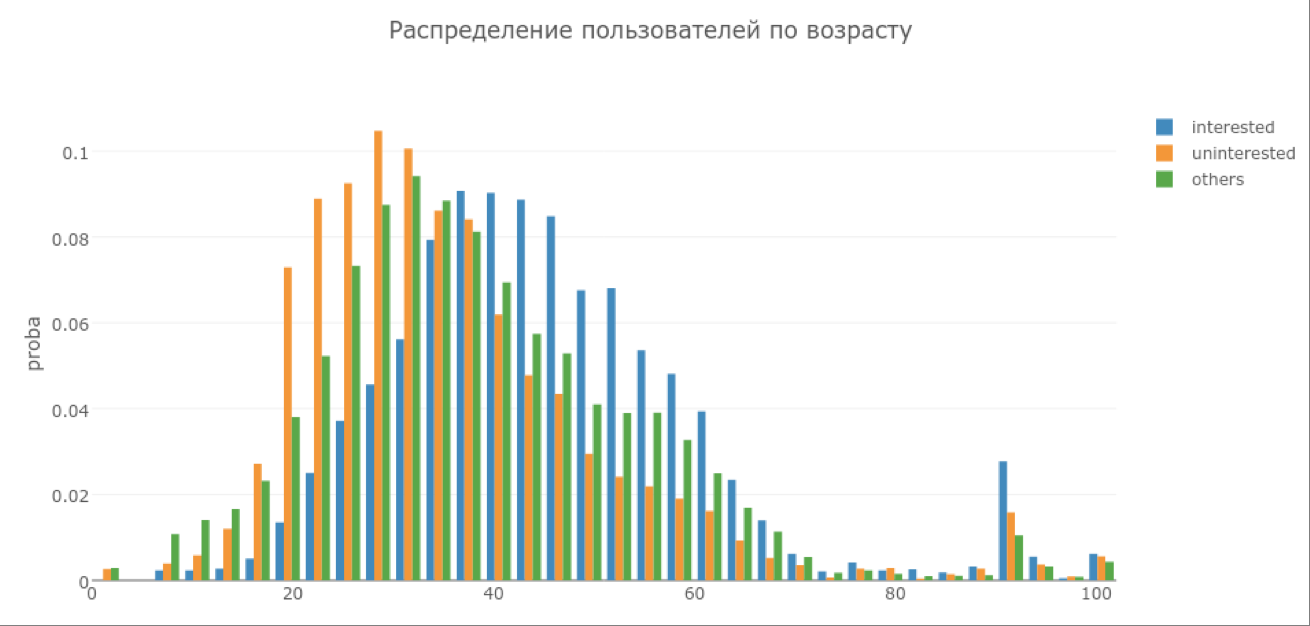
On the graph on the X axis - the age of users, and on the Y axis - the proportion of the user field with age X in the corresponding category. By repeating the training on a new data set, we obtained the following ROC curve for the best classifier.
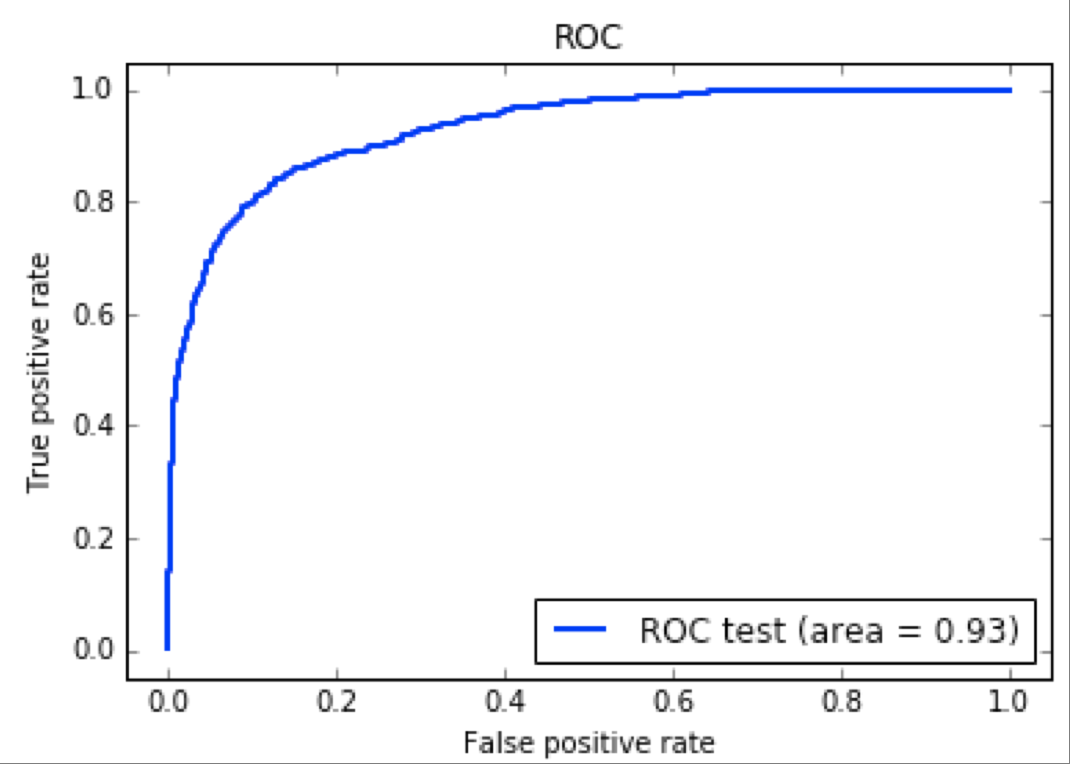
Compared with the first approach, the AUC already looked more attractive, and we switched to field trials.
Field tests of the second model
This time, our model selected 60,000 potential candidates from a random subset of users, filtered by activity and age. In addition, 60,000 additional users randomly selected additional comparative statistics.
As a result, a notification with an offer to test our application was sent to 60,000 candidates from the model and 60,000 random users. A week later, statistics showed that 5056 people entered the application, that is, about 4% of the 120,000 push users. Let's see which one of them was chosen by the classifier, and who got through the all-powerful random:
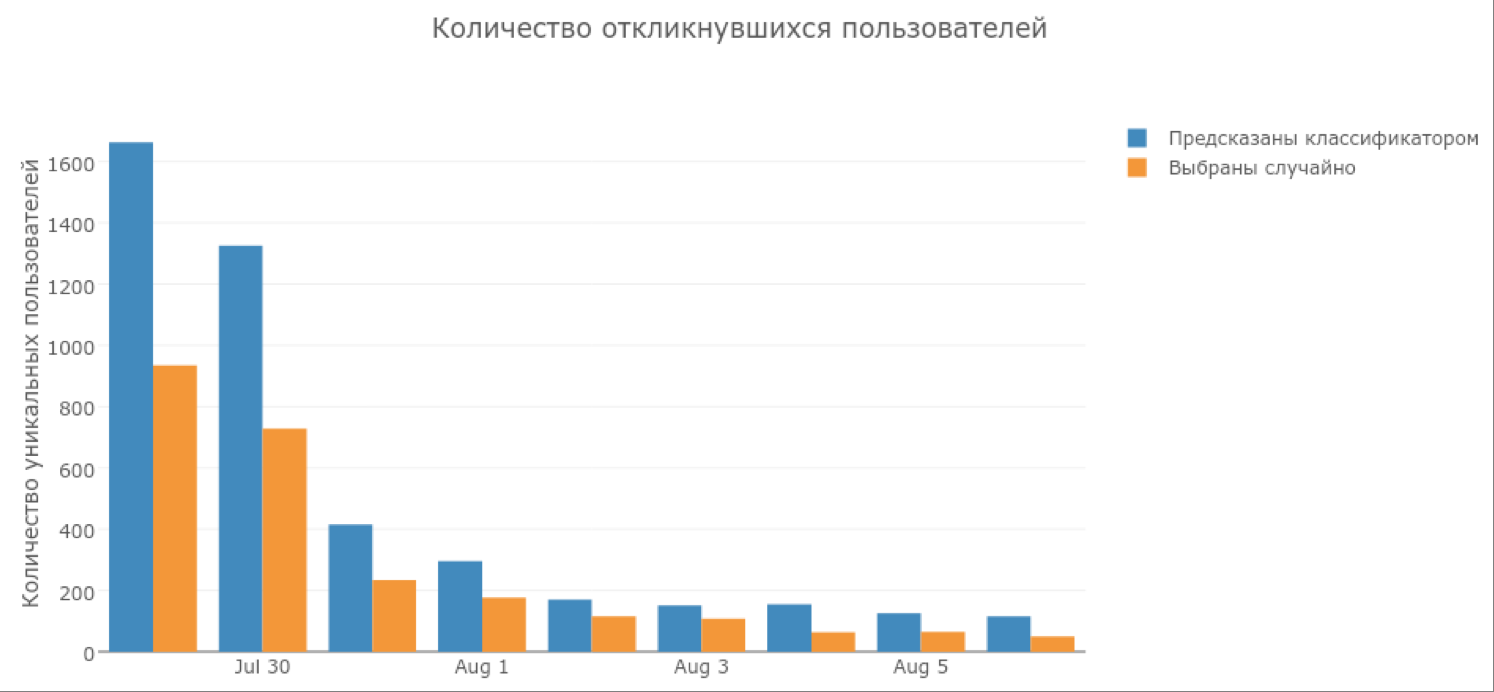

The second model attracted twice as many users as random mailing. Similarly, the situation with the number of processed images: users attracted by the model, marked out 2-2.5 times more images.
It is also worth noting that some of the users selected by the model started playing every day, while users from random sampling almost stopped entering the game by the end of the week.
Results
What we learned for ourselves on the basis of the creation and testing of the model:
- The first result of the classifier training will not always be positive. But he should not lead to a halt in learning, but, on the contrary, provide food for subsequent experiments.
- When choosing signs for dataset, it is worth understanding how each sign can affect the result. It is optimal to support the choice of each feature with statistics.
- A well-trained model is only part of the success. Other factors influence the final result:
- How does the user get advertising. For example, it was possible to add a sign of how often users click on the pushes in the mobile and in the web version of the portal.
- The text of the push itself is very important. Users are more likely to respond to viral text than normal. For example, the push with the text "Free OKI, play and win!" Will be more clicks than the push "Try our app." If a viral text is backed up with a viral picture, the effect will increase.
- What time is it worth sending out pushes. For example, if users from dataset mostly live in Moscow, according to the forecast of the Weather Center, we look at the next rainy day and define it as the day for mailing. The expectation is that in the rain people will not go for a walk and will sit on the social network. So, the chance that they will see our push right after sending will increase.
- The same applies to the mailing time: if the users mostly live in Vladivostok, then they will read the newsletter at 18:00 Moscow time only in the morning, after 7-8 hours. During this time, our push may be lost among other push users.
')
Source: https://habr.com/ru/post/342400/
All Articles