Load testing, process automation history
Hi, Habr! I work as a system administrator, combining this business with the organization and conduct of load testing for various projects (both gaming and not so). It just so happened that only one person is engaged in the load (this is me).
In my company, several studios are working at the same time and in order to maintain the quality of each game project each of these studios need to carry out load testing independently of each other, and this has led to the fact that it has become necessary to automate this business to the maximum and minimize manual participation.
The process of load testing in my mind is divided into several stages:
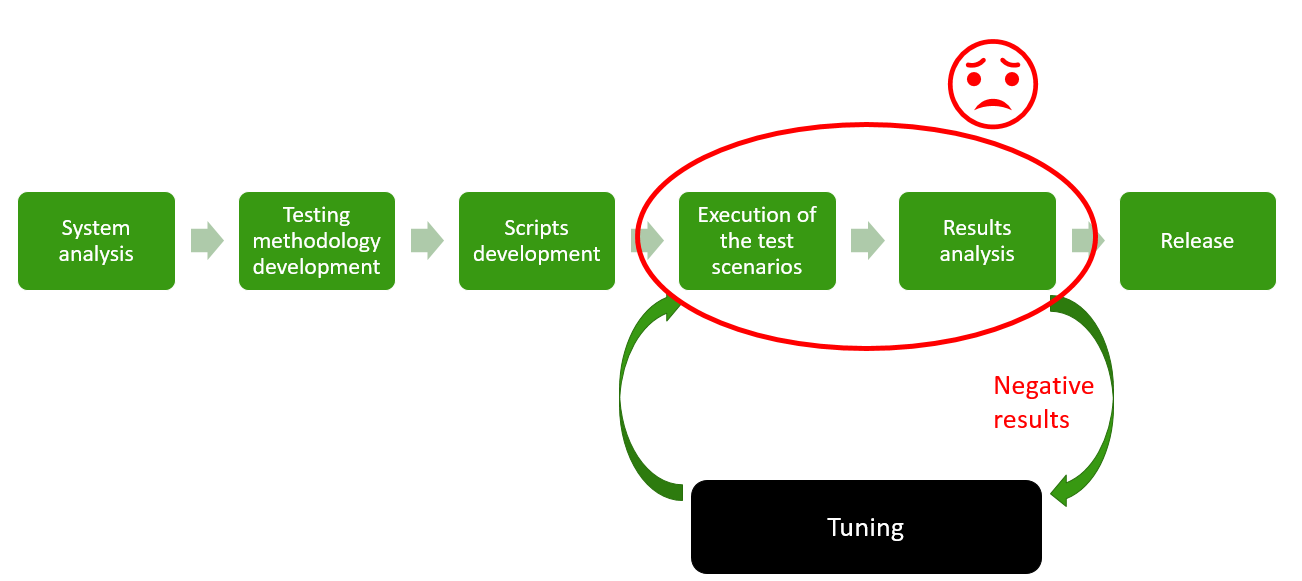
The first three stages are simply an analysis of the system and the development of scripts. Then begins the most boring and long iterative stage, namely: the testing itself and the analysis of the results, as a result of which, depending on the results, we turn to the most interesting - tuning .
')
But the tuning stage takes a few minutes, but waiting for the results a few hours. Next you need to collect and analyze the results, which quite recently required a lot of manual work, from which, in fact, I had to get rid of, in order to reduce the whole process to more interesting things: the development of scripts and tuning.
As a tool for load testing, we (of course) use Apache Jmeter .
Innogames projects use various protocols that can be easily emulated using this product (of course, often using additional proprietary plugins): http, websockets, protobuf, protobuf + STOMP, and even udp. Also, thanks to a good load distribution system, we can easily emulate the required number of VUs (virtual users) and traffic. For example, on one project, it was necessary to raise 65k VUs and make 3000 requests / s.
Naturally, like all fashionable offices, we began to run tests using Jenkins CI. But the problem with the analysis of the results, and most importantly the comparison of the results with the results of previous tests was very relevant. As well as the problem of online monitoring: tests, of course, run in console mode, we have only console output from jmeter, but I want graphs.
At first, as a solution, the Performance plugin for jenkins worked well. But with the growing number of tests on each project and the emergence of really large files for analysis (a 3-hour test with 3000 requests / s produces a CSG file of 4Gb +), this plugin started working hours and falling into OOM along with Jenkins.
The number of projects, data, interested persons grew, it was necessary to do something.
The search for themeaning of life of any ready-made solution has not given any result. Until I came across one article where the author described how using python and pandas (a library for data analysis ) analyzed the csv files from Jmeter and plotted graphs. After reading this and realizing that pandas can easily work with gigabyte files and aggregate the data from them, I wrote a simple script that generated HTML reports with test results and published them in jenkins using the HTML Publisher plugin .
Here is the link to this script , do not look there.
At the time this solved the problem. But it was a very bad decision, with a bunch of loadable images and Java scripts that read local CSV files and built tags.
At some time, the reports also began to load for a long time (several minutes), this infuriated everyone and some suggested considering the option of working with one of the well-known SaaS load testing providers, whose service is based on generating load using the free Jmeter, but They sell this business for a lot of money, offering a convenient environment for running tests and analyzing results. I do not really like these services, although they do a lot for the same Jmeter (for example, BlazeMeter).
I must say, I did not understand how they were going to emulate non-standard protocols and raise a large number of VUs, but I liked the idea of their convenient environment for load testing with all these graphs and reports, as well as the fact that many people can use it at the same time.
Keeping pandas in mind, I decided to try to come up with a solution.
Finally, we come to the main topic. During a considerable time of trial and error, as well as the study of Django, HTML, java-scripts and others, the following solution was born, which I called Innogames Load Testing Center (hereinafter LTC ).
You can download and participate in the development of the project (there is a lot to do there) from the official git-hub of the company: Jmeter Load Testing Center .
This is a Django web application and uses Postgres to store data. For the analysis of data files, the above-mentioned pandas module is used.
It consists of the following main components (in the Django language - applications):
At the moment, Jenkins is still here, the Controller application is still in development. But soon it will be possible to replace Jenkins.
Thus, if a user named Hans wants to run a test, he opens Jenkins selects a project and presses a start:

After this, Jenkins runs the main instance of Jmeter on the main server (let's call it admin.loadtest , Jenkins and LTC itself are there), as well as Jmeter-servers on one or more remote virtual machines in the required amount (more on that later) and the actual testing process.
During the test, a CSV file with JMeter results, as well as another CSV file with monitoring data of remote hosts is created and updated in the $ WORKSPACE folder of the project.
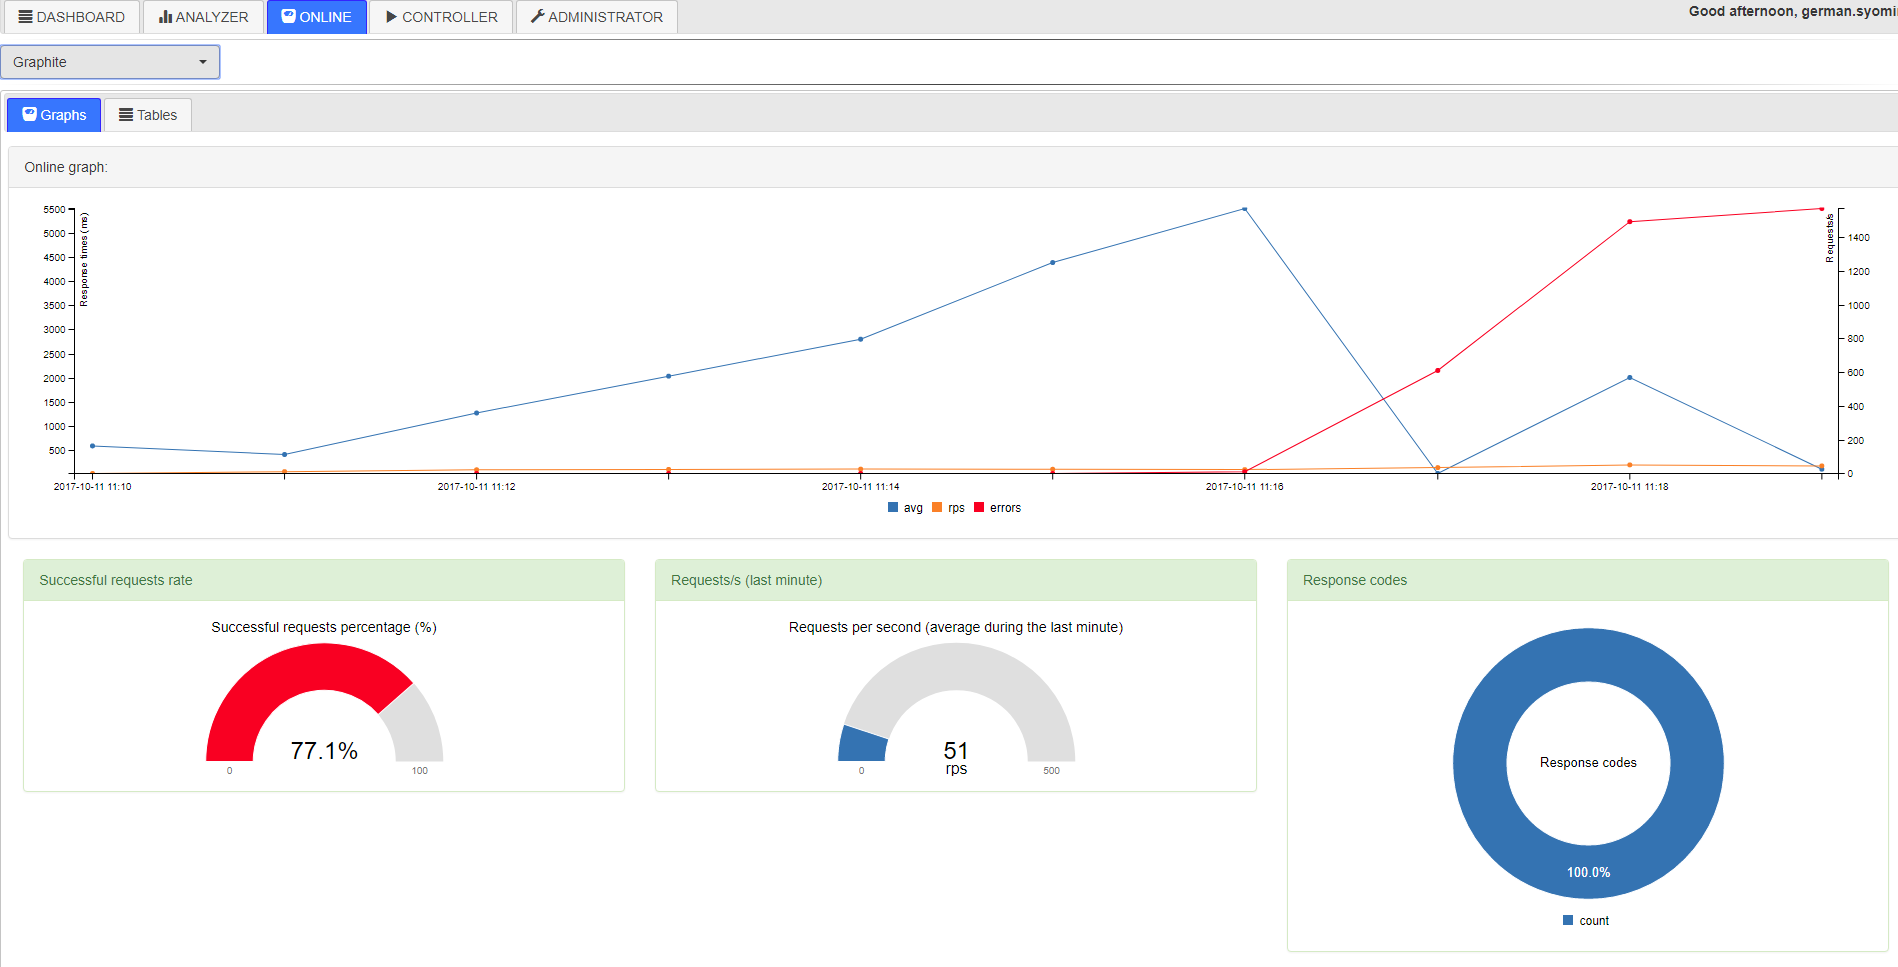
Next, Hans can open LTC and watch the test pass online. (At this time, the application will parse the above-mentioned CSV files and put them in temporary tables into the database, from which Online draws the charts:
Or, this same Hans can wait until the end of the test, when at the end a special script collects all the data into the database and can be used in the Analyzer for analysis and comparison with other results:
The last problem remains: there are several projects, projects require different powers for carrying the load (read, they emulate different numbers of VUs), users can run them at the same time, but they may not. How to distribute the existing 10 virtual machines-generators at all. You can assign each project for certain generators (at the beginning it was), you can make a schedule or use a blocking plugin for Jenkins, or you can make something clever interesting. About this below.
As I said, the backend is written on the Django framework. In developing the frontend, I used all the standard libraries: jquery and bootstrap. As charts, I needed a solution that easily draws data obtained in JSON format. Not bad cope with this c3.js.
Tables in the database usually contain a pair of keys and one field with the JSONField () data type. JSONField is used because later you can easily add new metrics to this table without changing its structure.
Thus, a typical model that stores data on response times, the number of errors and other things during one test looks very simple:
The data in the data field itself is, respectively, JSONs that store information aggregated in one minute:

To retrieve data from this table, there is one endpoint in the urls.py file, which calls the function that processes this data and returns conveniently readable JSON:
Endpoint:
Function:
On the frontend, we have a c3.js graph that refers to this endpoint:
As a result, we have this:
Actually, the entire application consists of graphs that draw data from the corresponding endpoints on the back end.
You can see from the source codes how the whole system works for analyzing tests, then I want to tell you the process of launching a load test in Innogames (and this part is relevant only for our company).
As I said, the entire load testing environment consists of one main server, admin.loadtest, and several generatorN.loadtest servers.
admin.loadtest is the Debian Linux 9 virtualka, 16 cores / 16 gigs, it runs Jenkins, LTC and other additional unimportant software.
The generatorN.loadtest is a bare debian Linux 8 virtual machine, with Java 8 installed. The power is different, but let's say 32 core / 32 gig.
On admin.loadtest, Jmeter (the latest version with the most basic plugins) is installed in the / var / lib / apache-jmeter folder as a pre-built deb distribution.
The test plan for each project is in a separate project on our GitLab inside InnoGames, respectively, the developers or QA from each team can make their own corrections. And each project is configured to work with Git:

Each project consists of:
./jmeter_ext_libs/src/
./test-plan.jmx
./prepareAccouts.sh
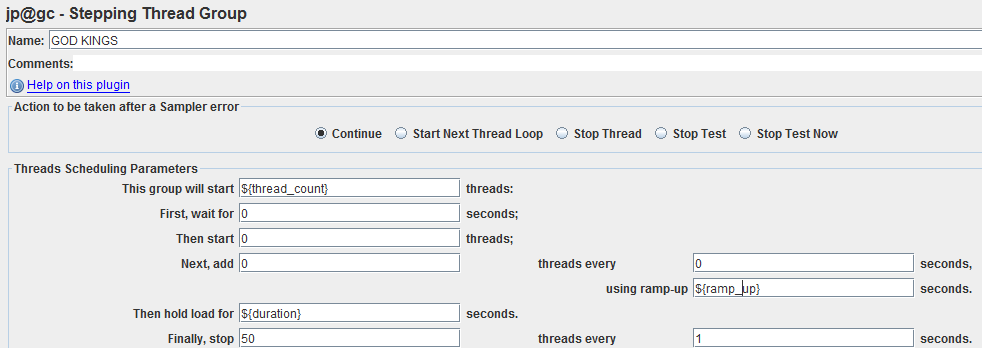
Each test plan as a thread group uses the Stepping Thread Group with three variables: thread_count, ramp_up, duration:
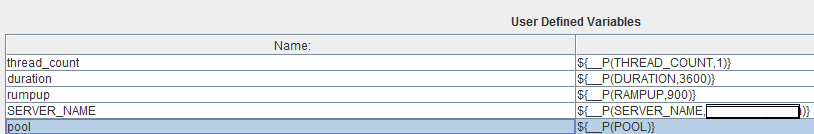
Values for these variables come from Jenkins when you run the test, but first you need to appropriately declare them in the main element of the test plan in the User Defined Variables, like all other parameterized variables. One of the important ones, let's call it pool - a sequential number is sent to it for each running Jmeter-server in order to subsequently delimit the used data pools (for example, user logins):
where in $ {__ P (THREAD_COUNT, 1)}: THREAD_COUNT is the name of the variable that comes from Jenkins, 1 is the default value if it does not.
Also in each test plan there is a SimpleDataWriter which writes the results of the execution of samplers in a CSV file. It has the following options activated:
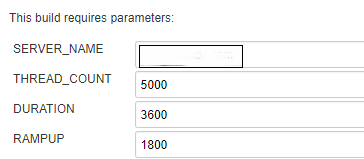
Before running the test, each user can set some parameters that are passed to the above-mentioned variables of the Jmeter test plan:
Now for the scripts. First of all, in the pre-build script we prepare the Jmeter distribution:
Next, we return to the last task: we have 10 virtual machines designed to generate load (we also don’t know if tests from other projects are running) and based on the required total number of emulated threads THREAD_COUNT, you need to run a certain number of Jmeter servers on these virtual machines sufficient to emulate the required load.
In our script, this is done using three lines in the Jenkins bash script, which, of course, leads to more serious things the LTC scripts:
So, in the first line:
Call the prepare_load_generators function and pass the project name to it, the path to the project workspace directory, the path to the Jmeter temporary distribution (/ tmp / jmeter-xvgenq /) created above, the test duration and, most importantly, the desired total number of emulated threads $ THREAD_COUNT.
What happens next you can see in the repository, if in general:
Actually at the moment all Jmeter-servers are running and waiting for the test itself to connect to and start. Thus, next in the second and third lines we take values from this JSON and send to the main instance Jmeter, the initial value of THREAD_COUNT is shared between remote jmeter-servers and each has threads_per_host (note that we pass the received value of threads_per_host to THREAD_COUNT) :
where $ JMETER_DIR is the folder with the Jmeter time distribution (/ tmp / jmeter-xvgenq /).
For running remote Jmeter-servers, there is its own model. We save data about what test is running, on which virtual machine, port, id of this process and so on. All this is necessary to further stop the test, when these same jmeter-servers must be destroyed:
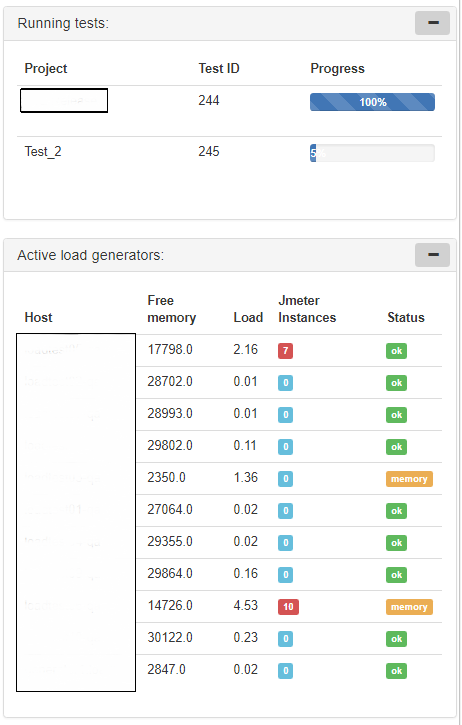
Also on the front page we have special beautiful plates with information about running tests and the status of load generators:
After the test, you must destroy all running Jmeter-servers, remove temporary Jmeter-distributions and collect the results.
In the post-build script, add:
At the beginning, we remove the temporary distr from the main server, then call the stop_test_for_project function, passing the project name to it. The function passes through a special table in the database, which stores information about running Jmeter instances and stops them.
And the very last step, the collection of results can be done in two ways, run the script:
Or locally call a web service:
At the moment I use the script, it goes over all the jobs in the jenkis folder and compares it with what is in the database, while maintaining consistency.
In LTC, I built a couple of kronos jobs that collect information about virtual machines and jmeter instances running every N minutes, for example, collecting S0U, S1U, EU and OU for the jmeter server process and then dividing the sum of these metrics by the number of threads running on it - I get the average size of memory consumed by one thread. The metric is rather strange, and maybe stupid, but it helps to roughly calculate the necessary memory size for the java-process required to emulate a certain number of threads.
By itself, many use the built-in reporting system Jmeter, which also does not stand still and is constantly evolving. If someone needs to store data and compare results between different tests, he can use services like BlazeMeter.
In my realities, these services will be quite expensive, and we also have enough capacity to generate load, so I tried to create an “insider” solution.
It already knows a lot, but it’s far from perfect and it’s not a matter of opinion. So now I am in the hope that there are still people with similar problems.
Thank you all and good luck.
In my company, several studios are working at the same time and in order to maintain the quality of each game project each of these studios need to carry out load testing independently of each other, and this has led to the fact that it has become necessary to automate this business to the maximum and minimize manual participation.
The process of load testing in my mind is divided into several stages:
The first three stages are simply an analysis of the system and the development of scripts. Then begins the most boring and long iterative stage, namely: the testing itself and the analysis of the results, as a result of which, depending on the results, we turn to the most interesting - tuning .
')
But the tuning stage takes a few minutes, but waiting for the results a few hours. Next you need to collect and analyze the results, which quite recently required a lot of manual work, from which, in fact, I had to get rid of, in order to reduce the whole process to more interesting things: the development of scripts and tuning.
Initial data
As a tool for load testing, we (of course) use Apache Jmeter .
Innogames projects use various protocols that can be easily emulated using this product (of course, often using additional proprietary plugins): http, websockets, protobuf, protobuf + STOMP, and even udp. Also, thanks to a good load distribution system, we can easily emulate the required number of VUs (virtual users) and traffic. For example, on one project, it was necessary to raise 65k VUs and make 3000 requests / s.
Naturally, like all fashionable offices, we began to run tests using Jenkins CI. But the problem with the analysis of the results, and most importantly the comparison of the results with the results of previous tests was very relevant. As well as the problem of online monitoring: tests, of course, run in console mode, we have only console output from jmeter, but I want graphs.
At first, as a solution, the Performance plugin for jenkins worked well. But with the growing number of tests on each project and the emergence of really large files for analysis (a 3-hour test with 3000 requests / s produces a CSG file of 4Gb +), this plugin started working hours and falling into OOM along with Jenkins.
The number of projects, data, interested persons grew, it was necessary to do something.
Initial decision
The search for the
Here is the link to this script , do not look there.
At the time this solved the problem. But it was a very bad decision, with a bunch of loadable images and Java scripts that read local CSV files and built tags.
At some time, the reports also began to load for a long time (several minutes), this infuriated everyone and some suggested considering the option of working with one of the well-known SaaS load testing providers, whose service is based on generating load using the free Jmeter, but They sell this business for a lot of money, offering a convenient environment for running tests and analyzing results. I do not really like these services, although they do a lot for the same Jmeter (for example, BlazeMeter).
I must say, I did not understand how they were going to emulate non-standard protocols and raise a large number of VUs, but I liked the idea of their convenient environment for load testing with all these graphs and reports, as well as the fact that many people can use it at the same time.
Keeping pandas in mind, I decided to try to come up with a solution.
Decision
Finally, we come to the main topic. During a considerable time of trial and error, as well as the study of Django, HTML, java-scripts and others, the following solution was born, which I called Innogames Load Testing Center (hereinafter LTC ).
You can download and participate in the development of the project (there is a lot to do there) from the official git-hub of the company: Jmeter Load Testing Center .
This is a Django web application and uses Postgres to store data. For the analysis of data files, the above-mentioned pandas module is used.
It consists of the following main components (in the Django language - applications):
- Dashboard is a front page with general information about the latest running tests.
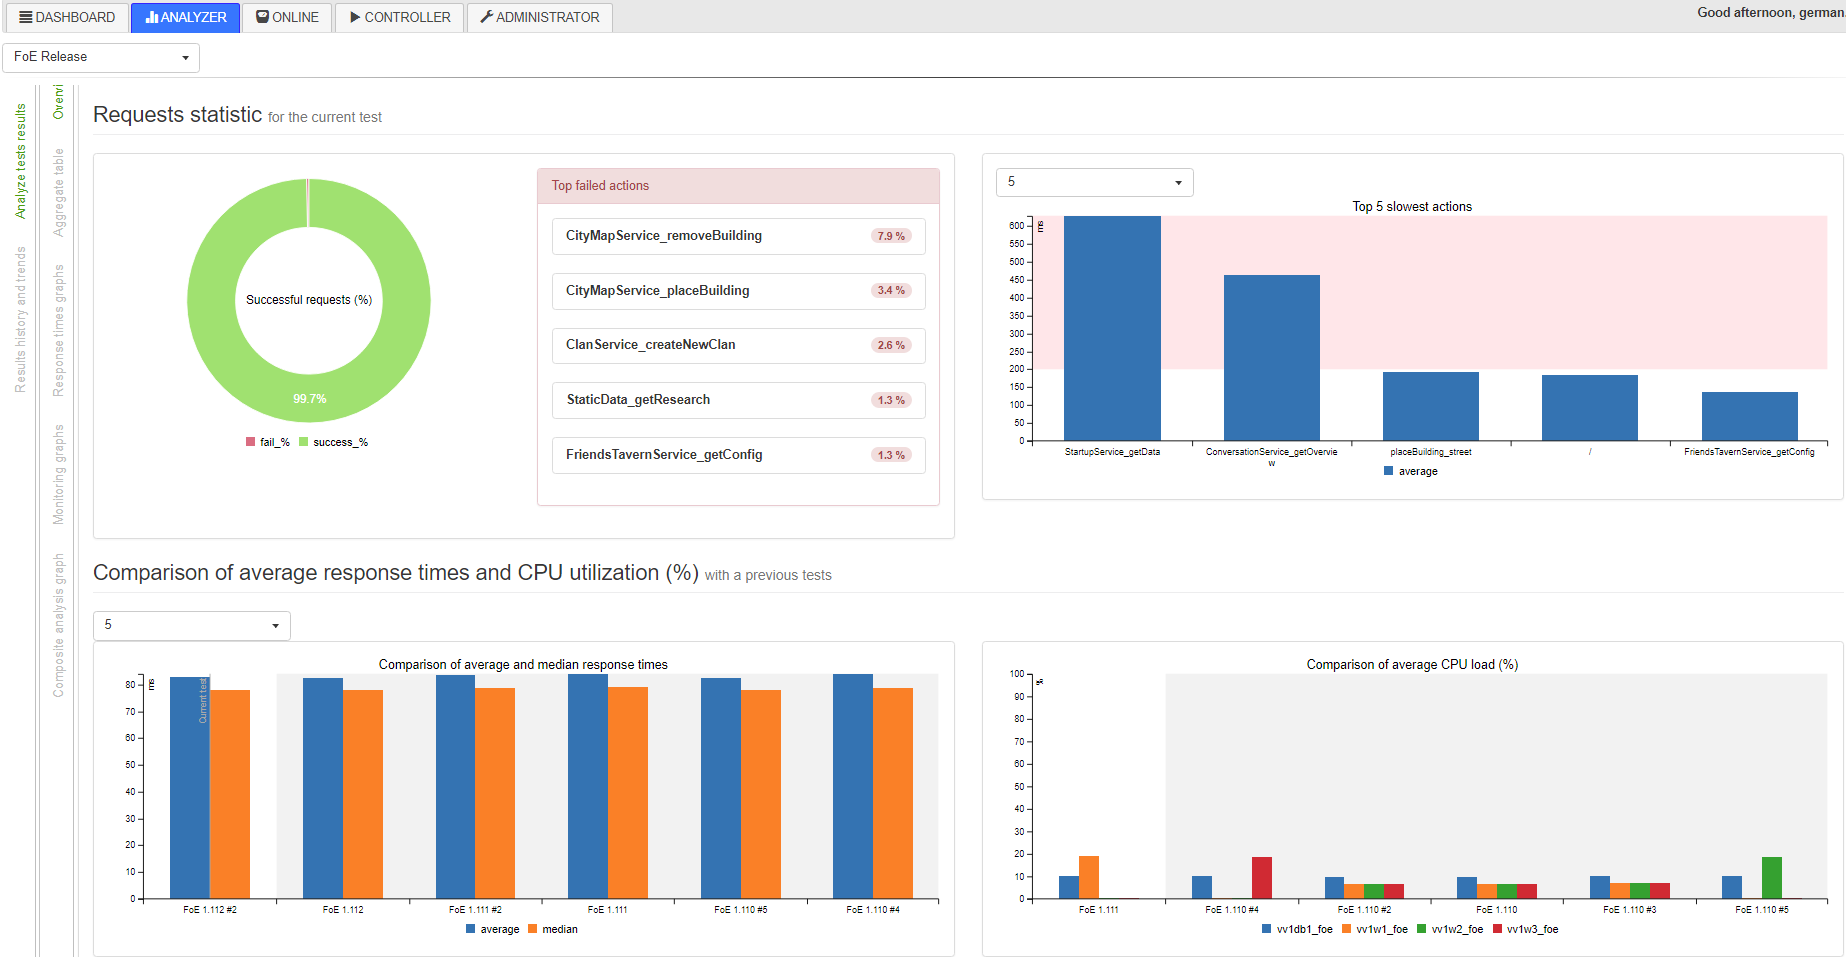
- Analyzer - here you can build reports and analyze test results.
- Online - allows you to monitor the tests online
- Controller - here you can configure and run tests (during development)
- Administrator - to configure different parameters / variables.
At the moment, Jenkins is still here, the Controller application is still in development. But soon it will be possible to replace Jenkins.
Thus, if a user named Hans wants to run a test, he opens Jenkins selects a project and presses a start:
After this, Jenkins runs the main instance of Jmeter on the main server (let's call it admin.loadtest , Jenkins and LTC itself are there), as well as Jmeter-servers on one or more remote virtual machines in the required amount (more on that later) and the actual testing process.
During the test, a CSV file with JMeter results, as well as another CSV file with monitoring data of remote hosts is created and updated in the $ WORKSPACE folder of the project.
Next, Hans can open LTC and watch the test pass online. (At this time, the application will parse the above-mentioned CSV files and put them in temporary tables into the database, from which Online draws the charts:
Or, this same Hans can wait until the end of the test, when at the end a special script collects all the data into the database and can be used in the Analyzer for analysis and comparison with other results:
The last problem remains: there are several projects, projects require different powers for carrying the load (read, they emulate different numbers of VUs), users can run them at the same time, but they may not. How to distribute the existing 10 virtual machines-generators at all. You can assign each project for certain generators (at the beginning it was), you can make a schedule or use a blocking plugin for Jenkins, or you can make something clever interesting. About this below.
Common device
As I said, the backend is written on the Django framework. In developing the frontend, I used all the standard libraries: jquery and bootstrap. As charts, I needed a solution that easily draws data obtained in JSON format. Not bad cope with this c3.js.
Tables in the database usually contain a pair of keys and one field with the JSONField () data type. JSONField is used because later you can easily add new metrics to this table without changing its structure.
Thus, a typical model that stores data on response times, the number of errors and other things during one test looks very simple:
class TestData(models.Model): test = models.ForeignKey(Test) data = JSONField() class Meta: db_table = 'test_data' The data in the data field itself is, respectively, JSONs that store information aggregated in one minute:
To retrieve data from this table, there is one endpoint in the urls.py file, which calls the function that processes this data and returns conveniently readable JSON:
Endpoint:
url(r'^test/(?P<test_id>\d+)/rtot/$', views.test_rtot), Function:
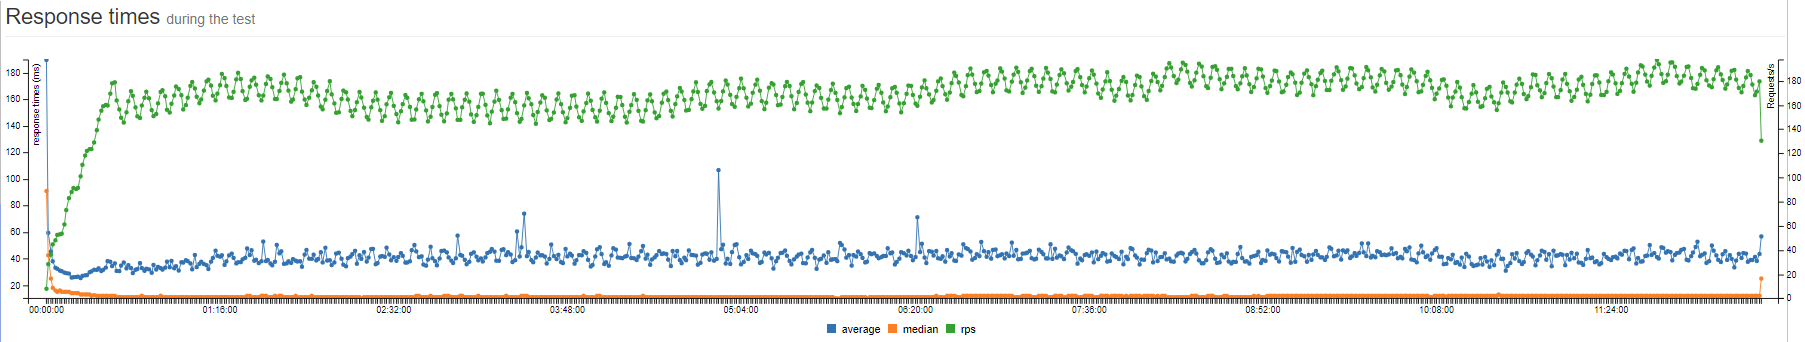
def test_rtot(request, test_id): # timestamp min_timestamp = TestData.objects. \ filter(test_id=test_id). \ values("test_id").\ aggregate(min_timestamp=Min( RawSQL("((data->>%s)::timestamp)", ('timestamp',))))['min_timestamp'] # , min_timestamp, , timestamp, JSON . d = TestData.objects. \ filter(test_id=test_id). \ annotate(timestamp=(RawSQL("((data->>%s)::timestamp)", ('timestamp',)) - min_timestamp)). \ annotate(average=RawSQL("((data->>%s)::numeric)", ('avg',))). \ annotate(median=RawSQL("((data->>%s)::numeric)", ('median',))). \ annotate(rps=(RawSQL("((data->>%s)::numeric)", ('count',))) / 60). \ values('timestamp', "average", "median", "rps"). \ order_by('timestamp') data = json.loads( json.dumps(list(d), indent=4, sort_keys=True, default=str)) return JsonResponse(data, safe=False) On the frontend, we have a c3.js graph that refers to this endpoint:
var test_rtot_graph = c3.generate({ data: { url: '/analyzer/test/' + test_id_1 + '/rtot/', mimeType: 'json', type: 'line', keys: { x: 'timestamp', value: ['average', 'median', 'rps'], }, xFormat: '%H:%M:%S', axes: { rps: 'y2' }, }, zoom: { enabled: true }, axis: { x: { type: 'timeseries', tick: { format: '%H:%M:%S' } }, y: { padding: { top: 0, bottom: 0 }, label: 'response times (ms)', }, y2: { min: 0, show: true, padding: { top: 0, bottom: 0 }, label: 'Requests/s', } }, bindto: '#test_rtot_graph' }); As a result, we have this:
Actually, the entire application consists of graphs that draw data from the corresponding endpoints on the back end.
You can see from the source codes how the whole system works for analyzing tests, then I want to tell you the process of launching a load test in Innogames (and this part is relevant only for our company).
Fire!
Load testing environment
As I said, the entire load testing environment consists of one main server, admin.loadtest, and several generatorN.loadtest servers.
admin.loadtest is the Debian Linux 9 virtualka, 16 cores / 16 gigs, it runs Jenkins, LTC and other additional unimportant software.
The generatorN.loadtest is a bare debian Linux 8 virtual machine, with Java 8 installed. The power is different, but let's say 32 core / 32 gig.
On admin.loadtest, Jmeter (the latest version with the most basic plugins) is installed in the / var / lib / apache-jmeter folder as a pre-built deb distribution.
Git
The test plan for each project is in a separate project on our GitLab inside InnoGames, respectively, the developers or QA from each team can make their own corrections. And each project is configured to work with Git:
Each project consists of:
./jmeter_ext_libs/src/
./test-plan.jmx
./prepareAccouts.sh
- jmeter_ext_libs - a folder with the source codes of additional plug-ins that are built using Gradle and put in / var / lib / apache-jmeter / lib / ext before each test.
- test-plan.jmx - test plan
- * .sh - additional scripts for the preparation of user accounts and other things.
Test-plan
Each test plan as a thread group uses the Stepping Thread Group with three variables: thread_count, ramp_up, duration:
Values for these variables come from Jenkins when you run the test, but first you need to appropriately declare them in the main element of the test plan in the User Defined Variables, like all other parameterized variables. One of the important ones, let's call it pool - a sequential number is sent to it for each running Jmeter-server in order to subsequently delimit the used data pools (for example, user logins):
where in $ {__ P (THREAD_COUNT, 1)}: THREAD_COUNT is the name of the variable that comes from Jenkins, 1 is the default value if it does not.
Also in each test plan there is a SimpleDataWriter which writes the results of the execution of samplers in a CSV file. It has the following options activated:
<time>true</time> <latency>true</latency> <timestamp>true</timestamp> <success>true</success> <label>true</label> <code>true</code> <fieldNames>true</fieldNames> <bytes>true</bytes> <threadCounts> true</threadCounts> Jenkins
Before running the test, each user can set some parameters that are passed to the above-mentioned variables of the Jmeter test plan:
Test run
Now for the scripts. First of all, in the pre-build script we prepare the Jmeter distribution:
- Create a temporary folder like / tmp / jmeter-xvgenq /
- Copy the main distribution from / var / lib / apache-jmeter /
- We collect additional plugins from the jmeter_ext_libs folder (if any).
- Copy the collected * .jar to / tmp / jmeter-xvgenq /
- The finished temporary distribution Jmeter further we extend to load generators.
#!/bin/bash export PATH=$PATH:/opt/gradle/gradle-4.2.1/bin echo "JMeter home: $JMETER_HOME" JMETER_INDEX=$(cat /dev/urandom | tr -dc 'a-zA-Z0-9' | fold -w 8 | head -n 1) # JMETER_DIR="/tmp/jmeter-$JMETER_INDEX" echo "JMeter directory: $JMETER_DIR" echo $JMETER_DIR > "/tmp/jmeter_dir$JOB_NAME" mkdir $JMETER_DIR cp -rp $JMETER_HOME* $JMETER_DIR if [ -d "$WORKSPACE/jmeter_ext_libs" ]; then echo "Building additional JMeter lib" cd "$WORKSPACE/jmeter_ext_libs" gradle jar cp ./build/libs/* $JMETER_DIR/lib/ext/ ls $JMETER_DIR/lib/ext/ fi cd $WORKSPACE Next, we return to the last task: we have 10 virtual machines designed to generate load (we also don’t know if tests from other projects are running) and based on the required total number of emulated threads THREAD_COUNT, you need to run a certain number of Jmeter servers on these virtual machines sufficient to emulate the required load.
In our script, this is done using three lines in the Jenkins bash script, which, of course, leads to more serious things the LTC scripts:
REMOTE_HOSTS_DATA=`python /var/lib/jltc/manage.py shell -c "import controller.views as views; print(views.prepare_load_generators('"$JOB_NAME"','"$WORKSPACE"','"$JMETER_DIR"', '$THREAD_COUNT', '$duration'));"` THREADS_PER_HOST=`python -c 'import json,sys;data=dict('"$REMOTE_HOSTS_DATA"');print data["threads_per_host"]'` REMOTE_HOSTS_STRING=`python -c 'import json,sys;data=dict('"$REMOTE_HOSTS_DATA"');print data["remote_hosts_string"]'` So, in the first line:
Call the prepare_load_generators function and pass the project name to it, the path to the project workspace directory, the path to the Jmeter temporary distribution (/ tmp / jmeter-xvgenq /) created above, the test duration and, most importantly, the desired total number of emulated threads $ THREAD_COUNT.
What happens next you can see in the repository, if in general:
- Based on the given thread_count, the required number of Jmeter-servers - X. is calculated using the formulas invented by me.
- Next, based on the current load and available memory on the generatorN.loadtest machines on each of these machines, the n-th number of Jmeter-servers is started until their total number is equal to X.
- For each of the selected generatorN.loadtest, rsync loads that temporary distribution of Jmeter:
- On each generator, the n-th number of Jmeter-servers is started (obtained in the previous step), we transfer the sequential number pool to each running process, to distribute the data pools (as I wrote earlier):
- All data about running Jmeter-instances are stored in the database, after the test, all of them will be destroyed on the basis of this data.
- At the end, the function returns a JSON of the form:
{ “remote_hosts_string”: “generator1.loadtest:10000,generator2.loadtest:10000, generator2.loadtest:10001”, "threads_per_host": 100 } Actually at the moment all Jmeter-servers are running and waiting for the test itself to connect to and start. Thus, next in the second and third lines we take values from this JSON and send to the main instance Jmeter, the initial value of THREAD_COUNT is shared between remote jmeter-servers and each has threads_per_host (note that we pass the received value of threads_per_host to THREAD_COUNT) :
java -jar -server $JAVA_ARGS $JMETER_DIR/bin/ApacheJmeter.jar -n -t $WORKSPACE/test-plan.jmx -R $REMOTE_HOSTS_STRING -GTHREAD_COUNT=$threads_per_host -GDURATION=$DURATION -GRAMPUP=$RAMPUP where $ JMETER_DIR is the folder with the Jmeter time distribution (/ tmp / jmeter-xvgenq /).
For running remote Jmeter-servers, there is its own model. We save data about what test is running, on which virtual machine, port, id of this process and so on. All this is necessary to further stop the test, when these same jmeter-servers must be destroyed:
class JmeterInstance(models.Model): test_running = models.ForeignKey(TestRunning, on_delete=models.CASCADE) load_generator = models.ForeignKey(LoadGenerator) pid = models.IntegerField(default=0) port = models.IntegerField(default=0) jmeter_dir = models.CharField(max_length=300, default="") project = models.ForeignKey(Project, on_delete=models.CASCADE) threads_number = models.IntegerField(default=0) class Meta: db_table = 'jmeter_instance' Also on the front page we have special beautiful plates with information about running tests and the status of load generators:
Stop the test
After the test, you must destroy all running Jmeter-servers, remove temporary Jmeter-distributions and collect the results.
In the post-build script, add:
JMETER_DIR=$(cat /tmp/jmeter_dir$JOB_NAME) echo "Removing Jmeter dir from admin: $JMETER_DIR" rm -rf $JMETER_DIR python /var/lib/jltc/manage.py shell -c "import controller.views as views; print(views.stop_test_for_project('"$JOB_NAME"'))" At the beginning, we remove the temporary distr from the main server, then call the stop_test_for_project function, passing the project name to it. The function passes through a special table in the database, which stores information about running Jmeter instances and stops them.
And the very last step, the collection of results can be done in two ways, run the script:
python /var/lib/jltc/datagenerator_linux.py Or locally call a web service:
curl --data "results_dir=$JENKINS_HOME/jobs/$JOB_NAME/builds/$BUILD_NUMBER/" http://localhost:8888/controller/parse_results At the moment I use the script, it goes over all the jobs in the jenkis folder and compares it with what is in the database, while maintaining consistency.
Additionally
In LTC, I built a couple of kronos jobs that collect information about virtual machines and jmeter instances running every N minutes, for example, collecting S0U, S1U, EU and OU for the jmeter server process and then dividing the sum of these metrics by the number of threads running on it - I get the average size of memory consumed by one thread. The metric is rather strange, and maybe stupid, but it helps to roughly calculate the necessary memory size for the java-process required to emulate a certain number of threads.
Conclusion
By itself, many use the built-in reporting system Jmeter, which also does not stand still and is constantly evolving. If someone needs to store data and compare results between different tests, he can use services like BlazeMeter.
In my realities, these services will be quite expensive, and we also have enough capacity to generate load, so I tried to create an “insider” solution.
It already knows a lot, but it’s far from perfect and it’s not a matter of opinion. So now I am in the hope that there are still people with similar problems.
Thank you all and good luck.
Source: https://habr.com/ru/post/342380/
All Articles