New features for monitoring Java applications in Zabbix 3.4
What happened?
The long-awaited release of Zabbix 3.4 was released, which brought many useful improvements, among which were customizable JMX endpoints and flexible detection of MBeans.
This is so cool, huh?
If you use Zabbix and you need to monitor Java applications, then yes - it can make your life much easier, because you had to resort to various tricks before, but now everything works, as they say, out of the box.

What's wrong with these JMX endpoints?
Native monitoring of Java applications via JMX appeared in Zabbix long ago - starting from version 2.0 - and since then this functionality has improved from version to version. But it turned out that in previous releases, the JMX endpoint was tightly wired into the Zabbix Java Gateway code in a completely naive way.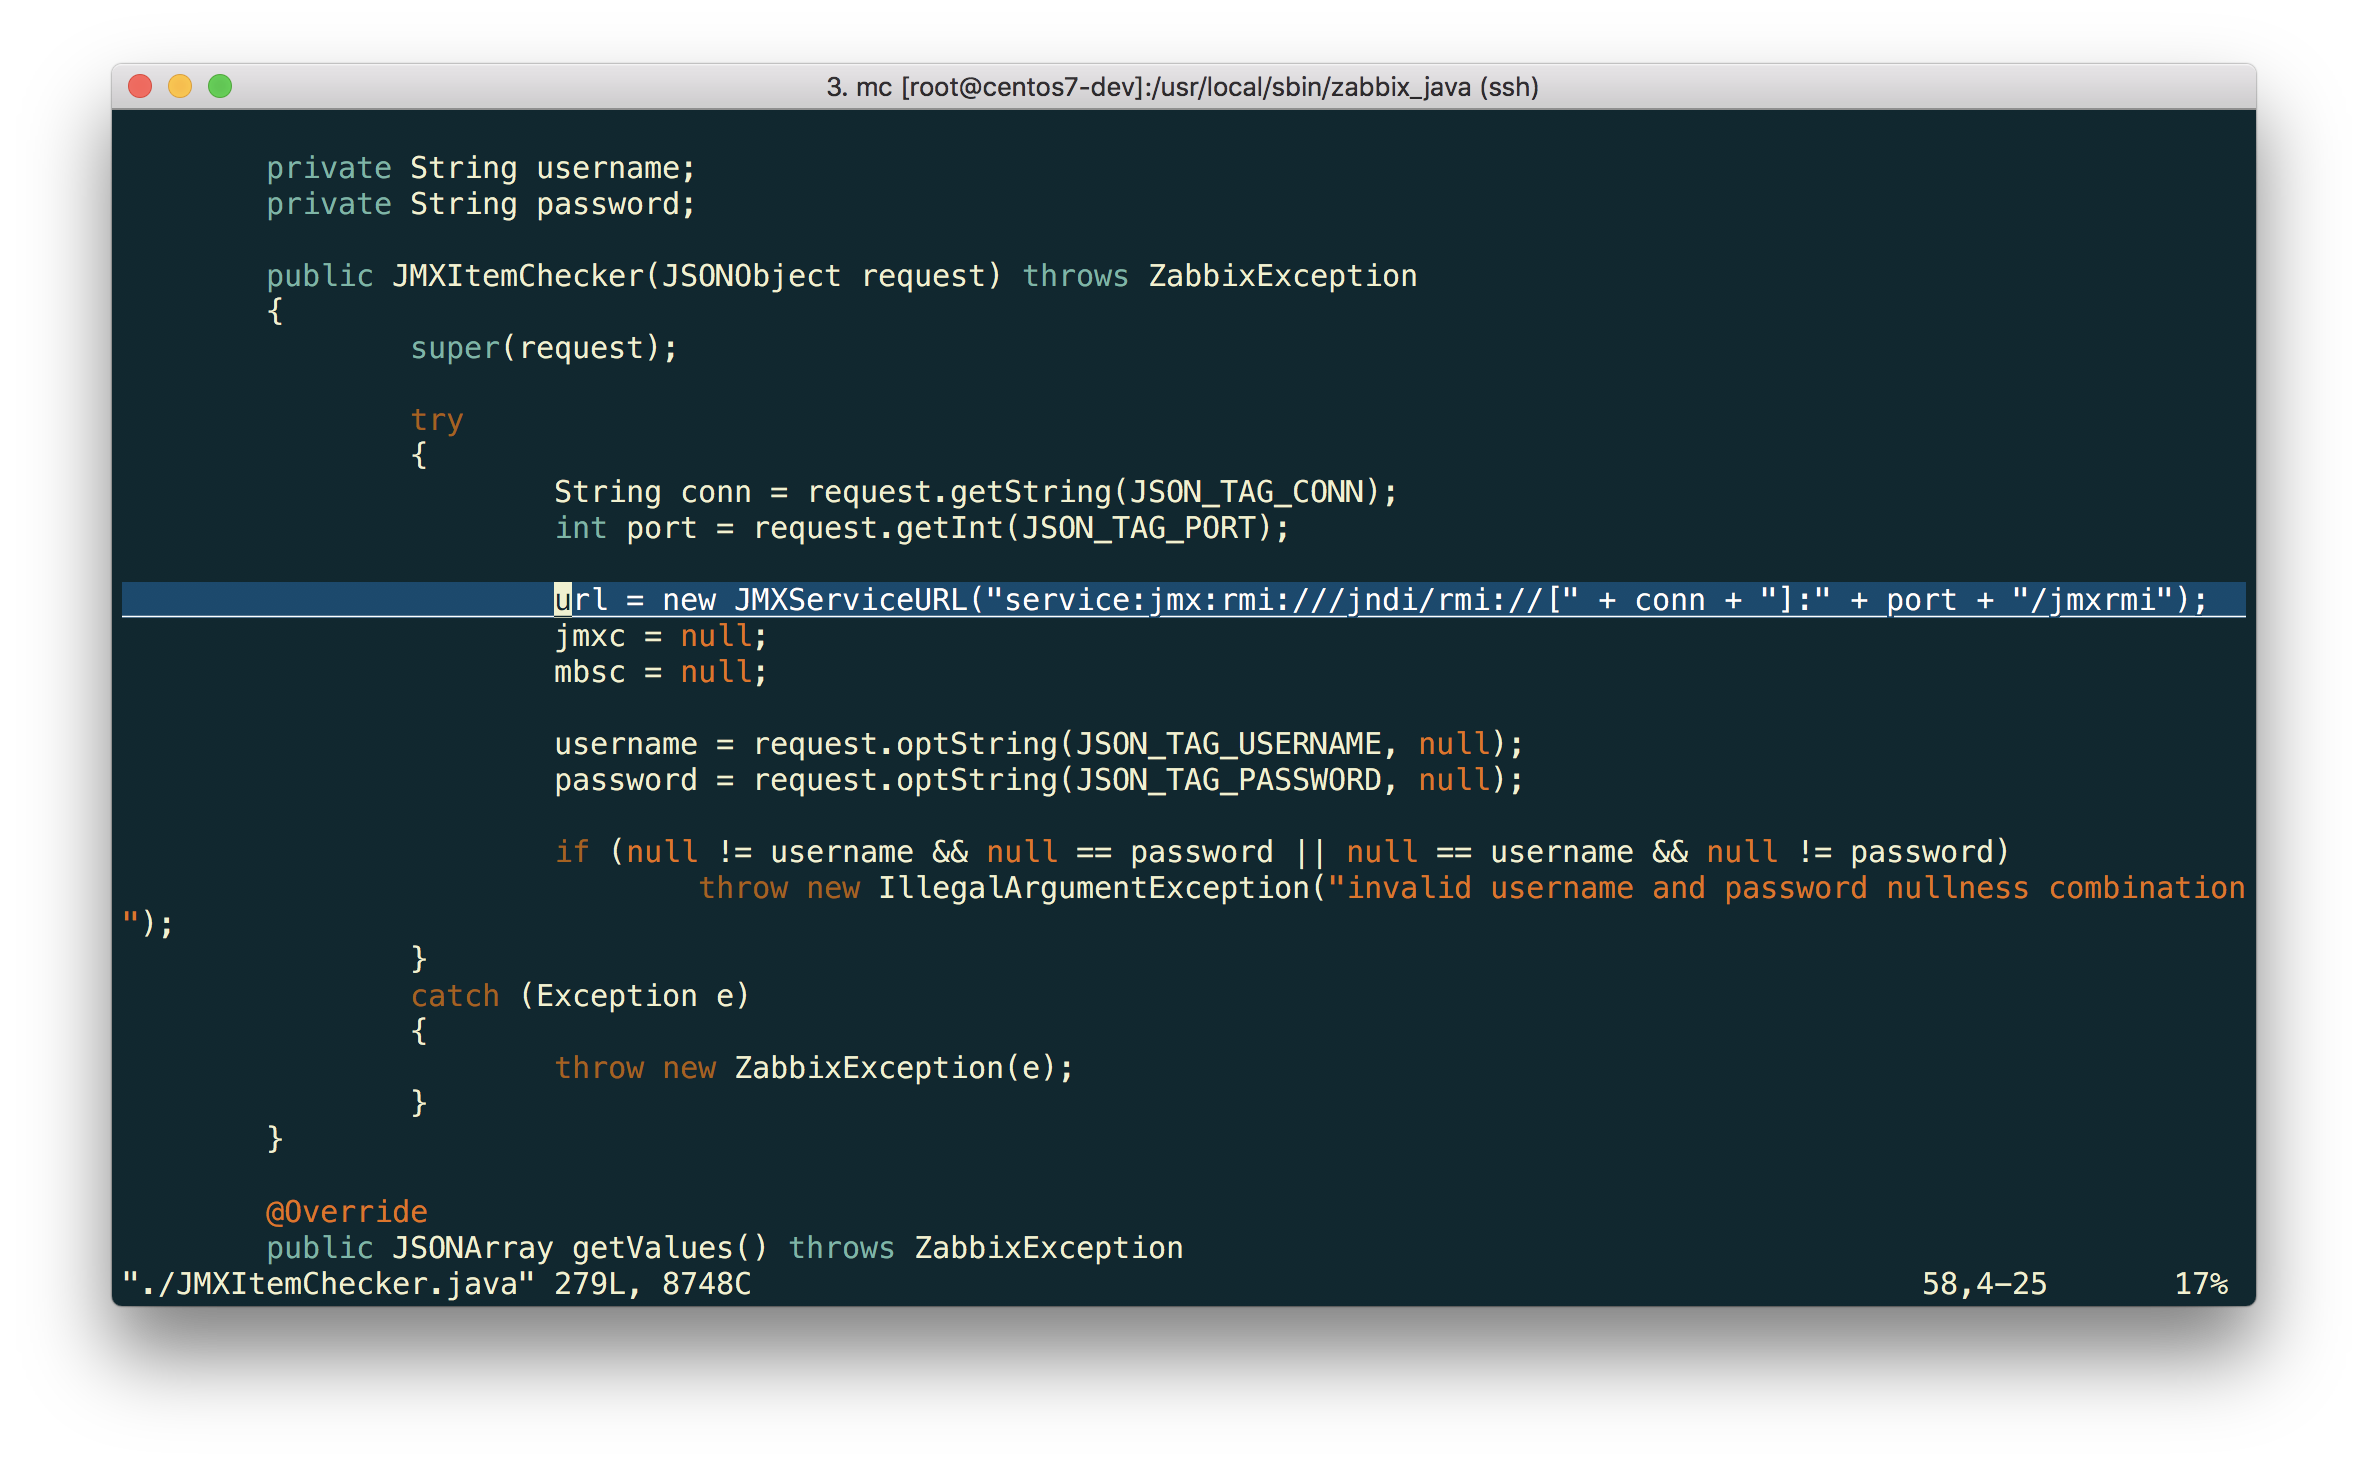
As it turned out, in the Java world there is a mass of software that uses other endpoints, and older versions of Zabbix did not allow changing this parameter. For many users, this has become a real problem. For example, the popular application server JBoss EAP 6 uses its JBoss Remoting protocol instead of RMI and JMXServiceURL for it to look like this for remote access to JMX:
service:jmx:remoting-jmx://{HOST.CONN}:{HOST.PORT}
And, for example, WebSphere 8.5 uses RMI over IIOP (and not JRMP ) and for it JMXServiceURL should be like this:
service:jmx:iiop://{HOST.CONN}:{HOST.PORT}/jndi/JMXConnector
Zabbix 3.4 just solves this problem.
I do not understand anything. JMX, RMI, JNDI? WTF?
Okay, well, let's see how it all works.
JMX (Java Management Extensions) is a Java technology designed to monitor and control (including remotely) various objects (resources): applications, devices, networks - if only this object was written in Java.
These resources are called MBeans (ManagedBeans) . Each such object implements a specific interface through which you can access the attribute values of this object, as well as call its methods and receive notifications (if the application registers the appropriate “listening” MBeans).
MBeans are registered on the MBean Server - the object registry. Any registered object becomes available for applications (more precisely, its interface becomes available).
Resources are accessed using JMX connectors , which make the MBean Server accessible to JMX clients. The JMX connector consists of a client and a server. The server connector connects to the MBean server and listens for connection requests from clients. Connector-client is usually located on another JVM, and more often it is generally on a different machine with respect to the connector-server.
JMX API has a standard connection protocol based on Remote Method Invocation (RMI) . This protocol allows the JMX client to remotely access MBeans on an MBean server. In addition to the regular RMI, there are other protocols: JMXMP, JBoss Remoting, Hessian, Burlap, and even HTTP and SNMP.
Using the MBean interface, the client can receive various metrics of this object, as well as call public methods.
Schematically, the interaction of the components can be represented as:
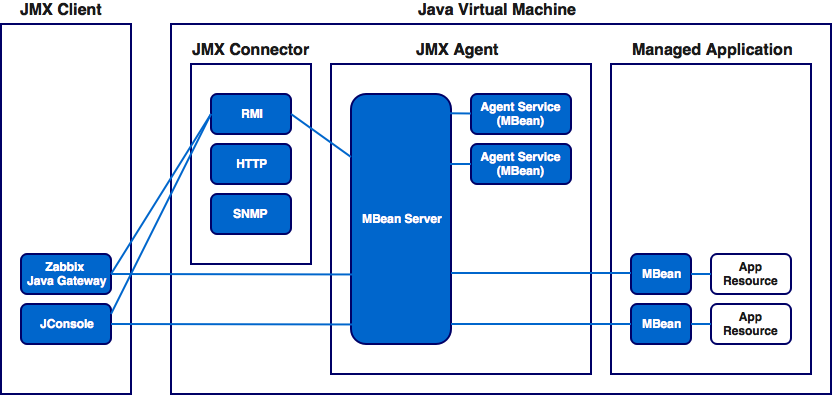
Any application on the Java SE platform “out of the box” has the ability to monitor it: the RMI connector automatically makes your Java application available for remote control and monitoring. Just run the application with the necessary parameters, and JMX clients (and Zabbix Java Gateway is a JMX client) can already connect to it remotely and receive the necessary metrics.
To tell the JMX client the specific application to which you want to connect, use a special address called the JMX endpoint (aka JMXServiceURL ). Strictly speaking, this is the address of the JMX API server connector. The format of this address is defined by RFC 2609 and RFC 3111 . In general, it looks like this:
service:jmx:protocol:sap
Where "service: jmx:" is a constant.
protocol is a transport protocol (one of many: RMI, JMXMP, etc) used to connect to a connector server.
sap is the address where the connector-server can be found. Specified in this format (this is a subset of the syntax defined in RFC 2609):
//[host[:port]][url-path]
host [: port] - the ipv4 address of the host (or ipv6, enclosed in square brackets) and an optional (depending on the protocol) port number.
url-path - optional URL (mandatory depends on the protocol).
Best deal with this with an example. You can often find such a JMX endpoint, the form of which some can enter into a stupor
service:jmx:rmi://host:port1/jndi/rmi://host:port2/jmxrmi
But in fact, not everything is so scary.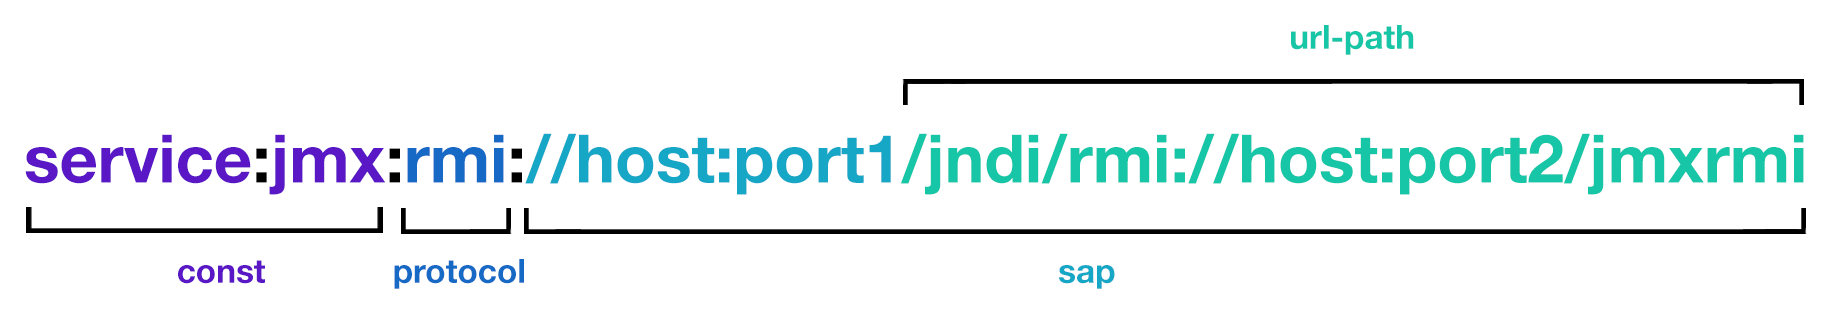
host is the target host where our application is running.
port1 is the port of the RMI server to which we want to connect.
and port2 is the port of the RMI registry (the directory where RMI servers are registered). Default: 1099.
If you know that the RMI registry provides the address and port of the RMI server at the request of the client, then it becomes clear that the first part is superfluous. Thus, the address can be reduced to this form: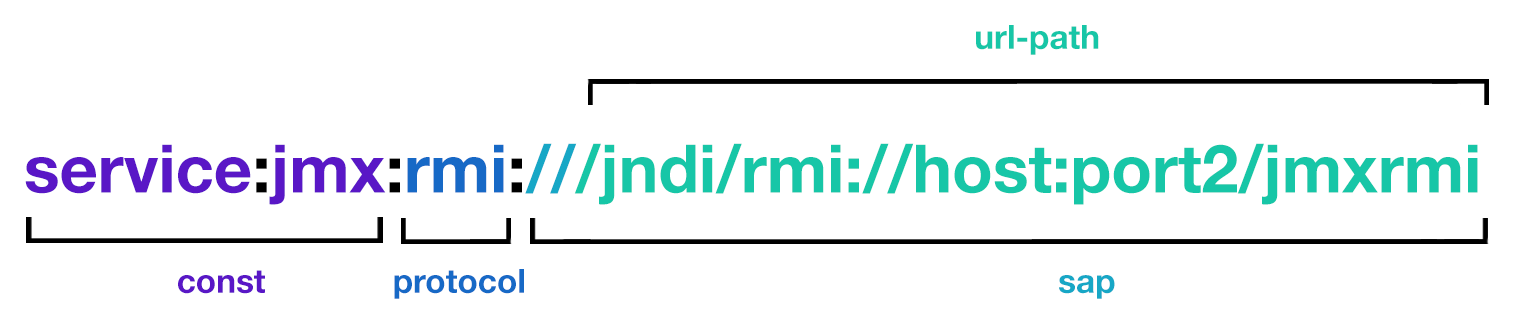
The url-path part means literally the following: take that part of the URL that immediately follows / jndi / and execute a JNDI request in the RMI registry at this address to get information about the RMI server. The registry will return its host and port.
It should be noted that in this case the port is randomly generated and there may be problems with setting up the firewall. In such cases, they use the previous version of the JMX endpoint's record, because it allows you to explicitly specify the port.
If you would like to get deeper into JMX, we recommend that you refer to the official Oracle documentation .
Maybe better in practice?
Nothing is simpler :) Let's try setting up JBoss EAP 6.4 monitoring for an example.
To begin with, we will make a few assumptions:
- You have already installed Zabbix 3.4 and Zabbix Java Gateway. If not, then you can do it in accordance with the documentation of Zabbix .
- Zabbix Server and Java Gateway with the prefix / usr / local /.
- JBoss is already installed in /opt/jboss-eap-6.4/ and runs in standalone mode.
- For the sake of simplicity, we assume that all these components work on the same machine.
- Firewall and SELinux are disabled (or configured appropriately, but this is beyond the scope of the article).
Let's make some simple settings in zabbix_server.conf:
JavaGateway=127.0.0.1 StartJavaPollers=5 And in the config zabbix_java / settings.sh (or zabbix_java_gateway.conf):
START_POLLERS=5 Check that JBoss is listening to its standard management port:
$ netstat -natp | grep 9999 tcp 0 0 127.0.0.1:9999 0.0.0.0:* LISTEN 10148/java Now let's create a host with JMX interface 127.0.0.1:9999 in Zabbix.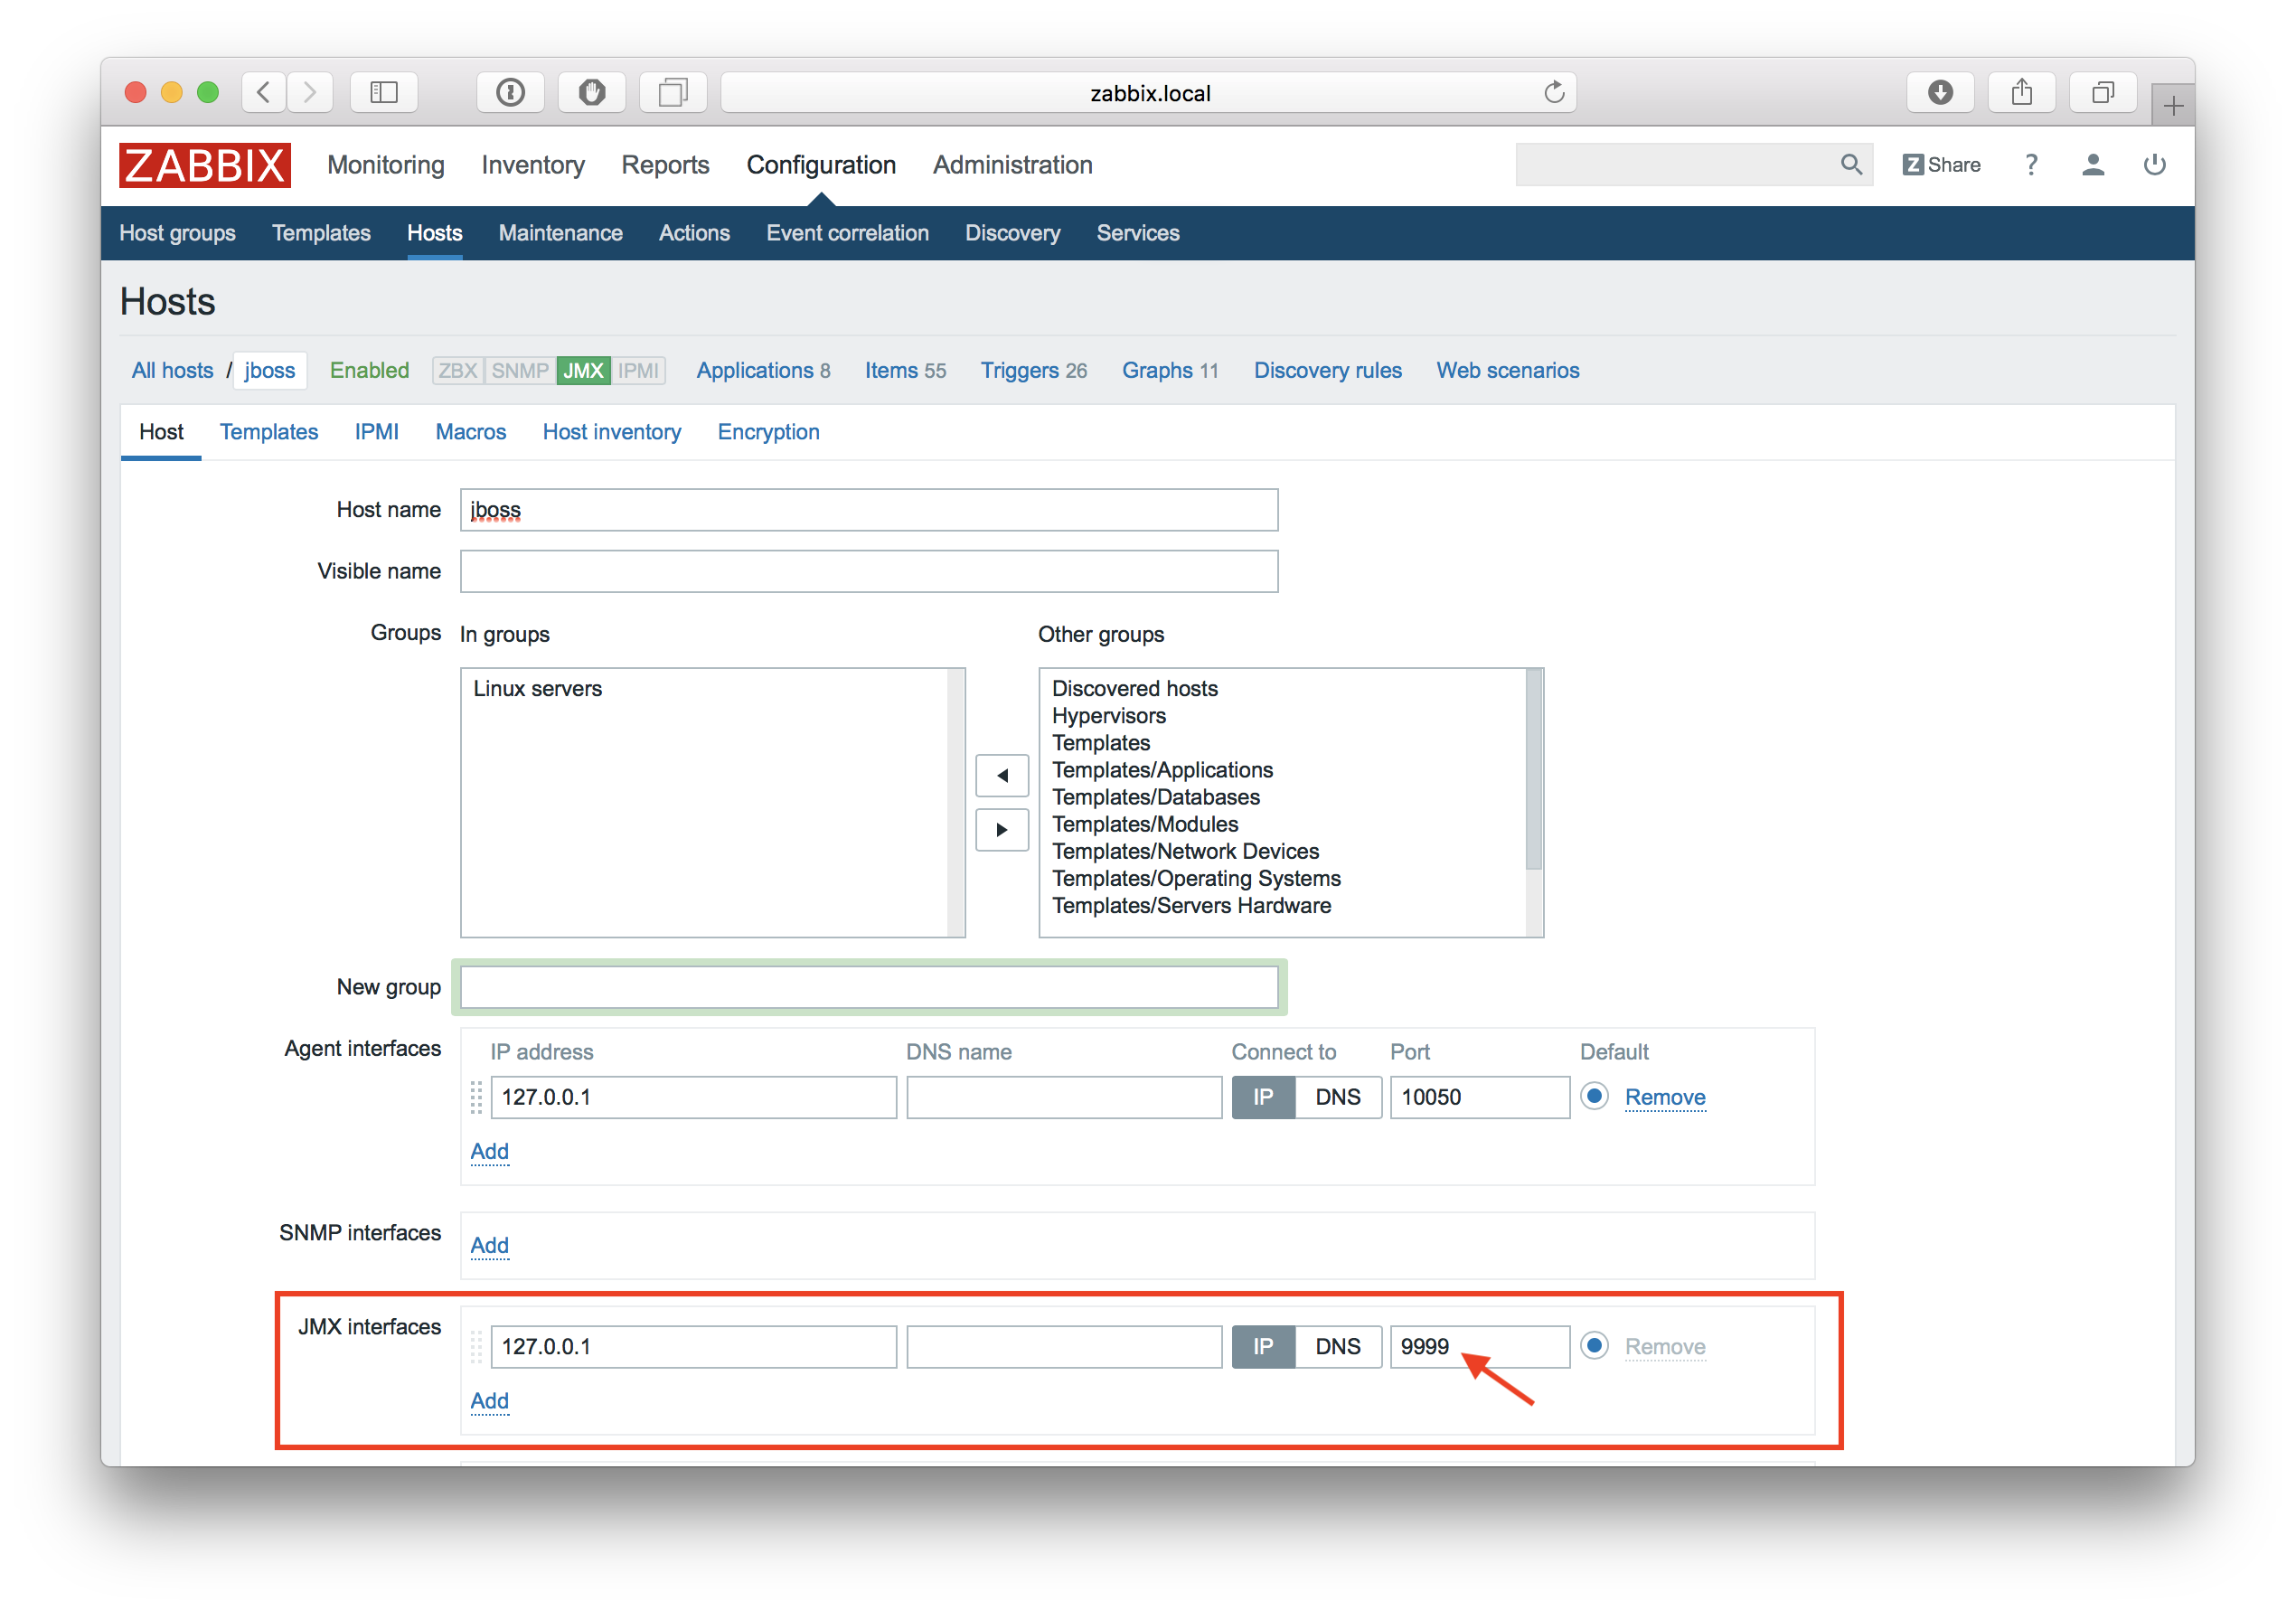
If we now just take the standard Template Template Generic Java JMX template and link it to the host, we will surely get an error:
$ tail -f /tmp/zabbix_java.log 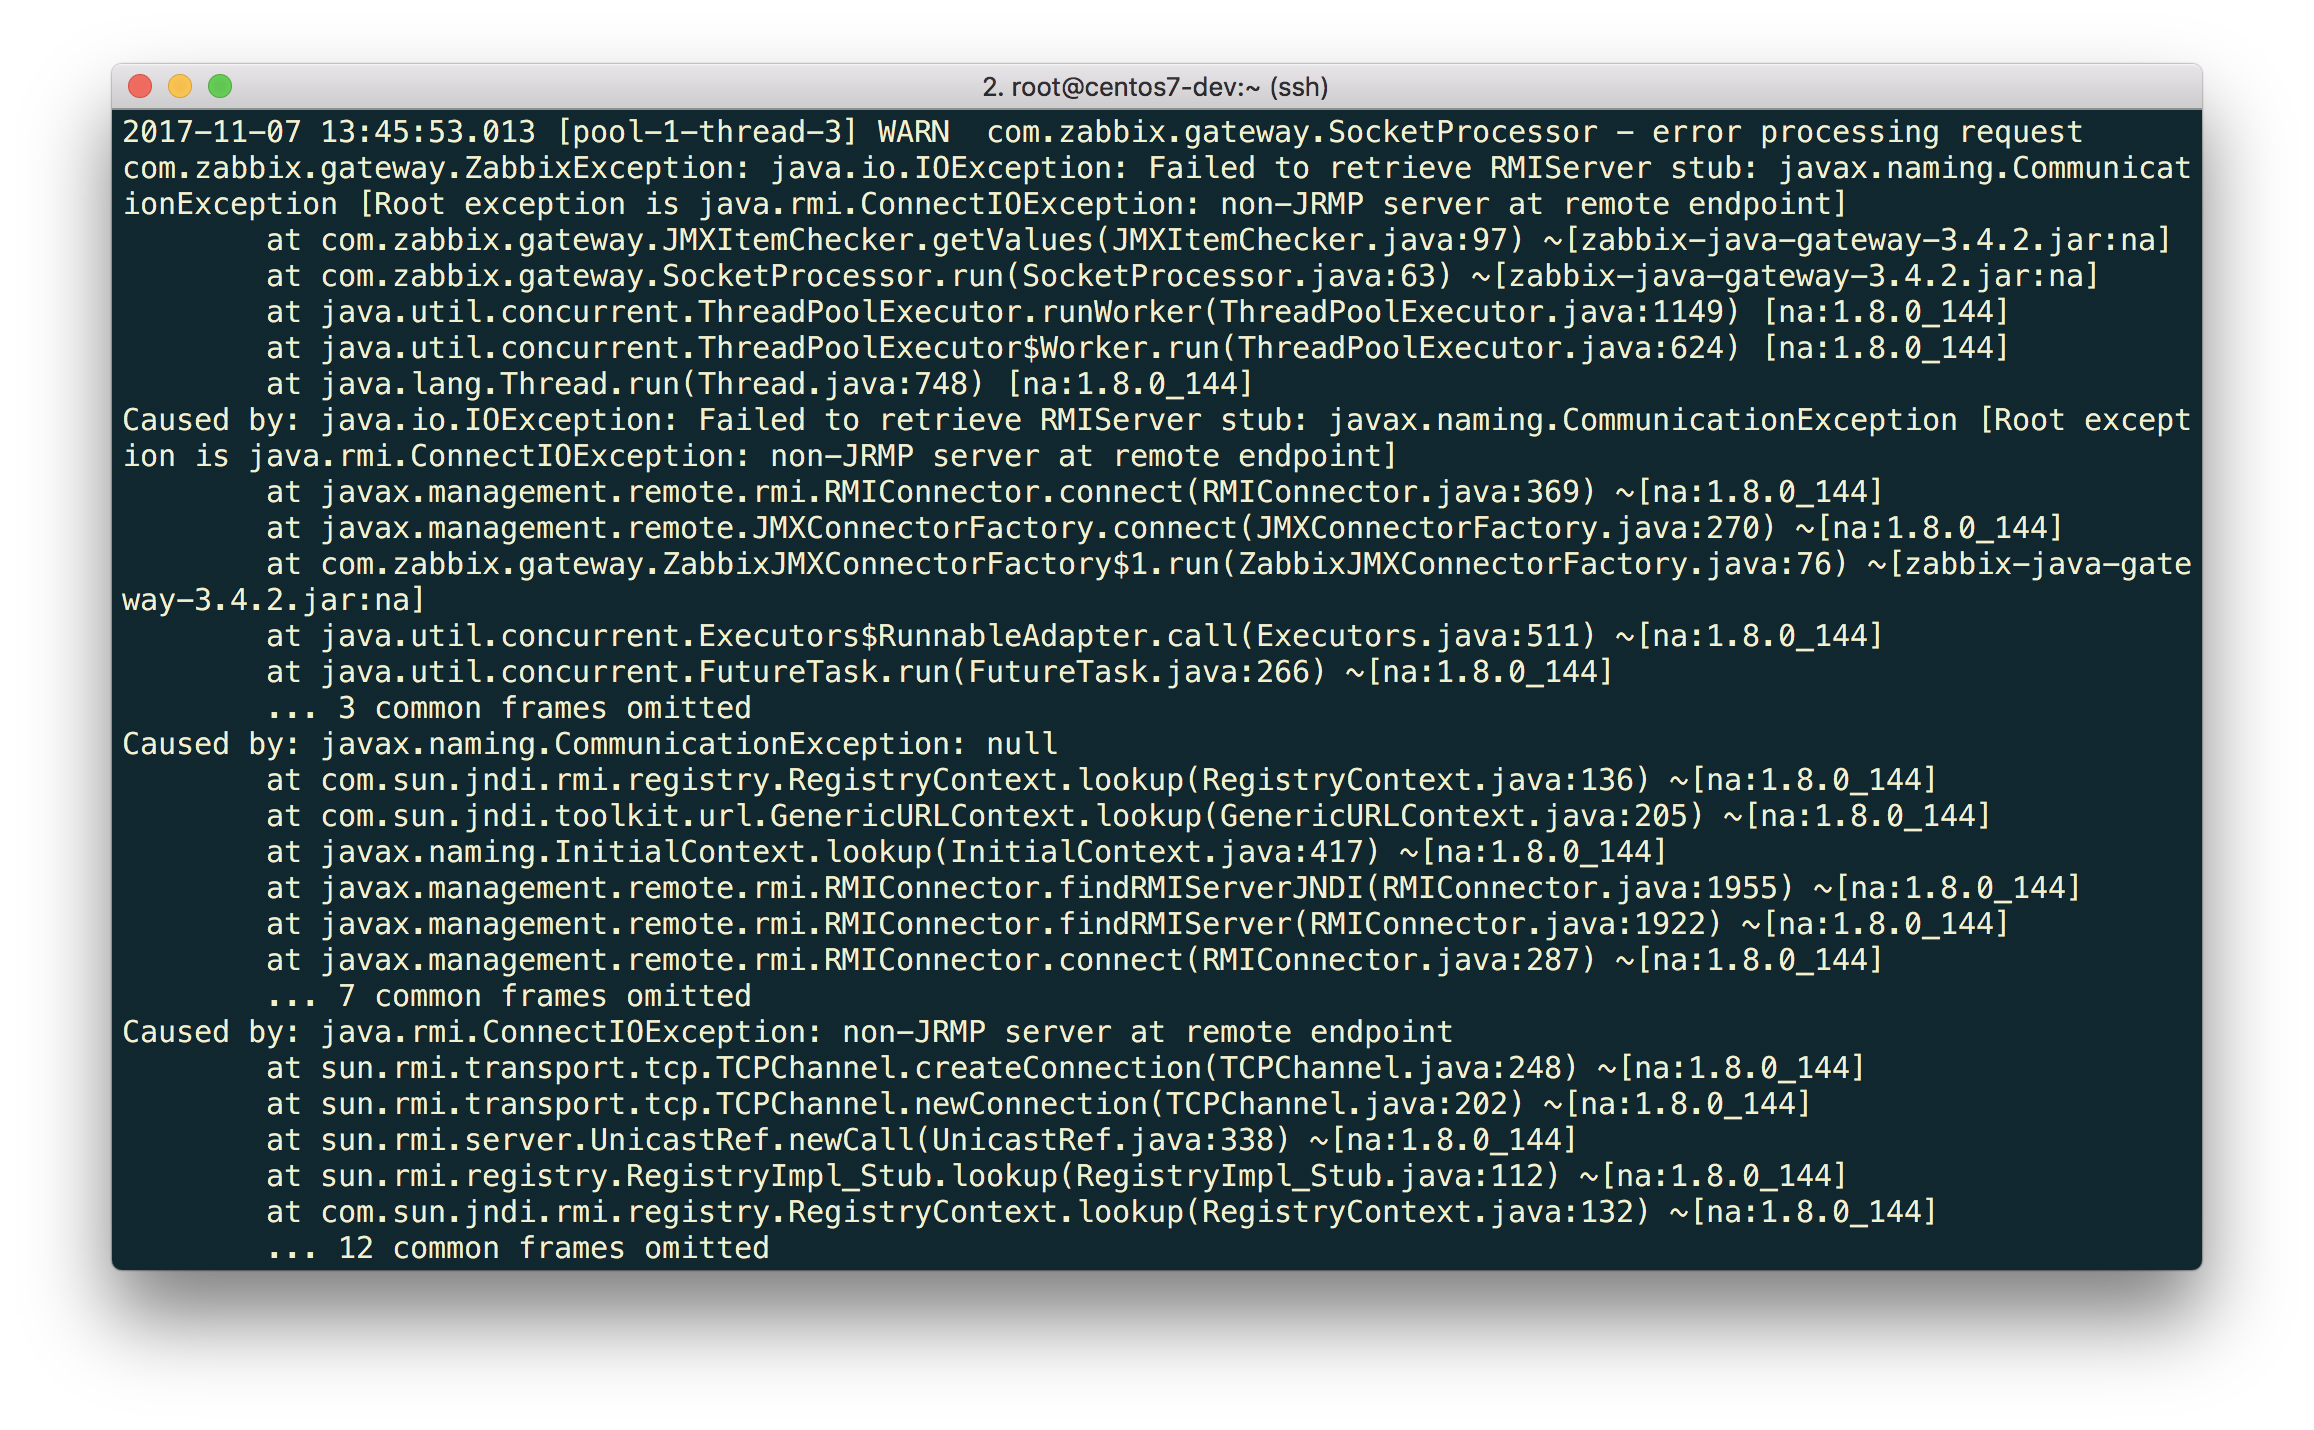
Java Gateway informs us that at the specified endpoint the answer is not RMI at all. Well, we already know that this version of JBoss uses the JBoss Remoting protocol instead of RMI, and we just need to start knocking at the right endpoint.
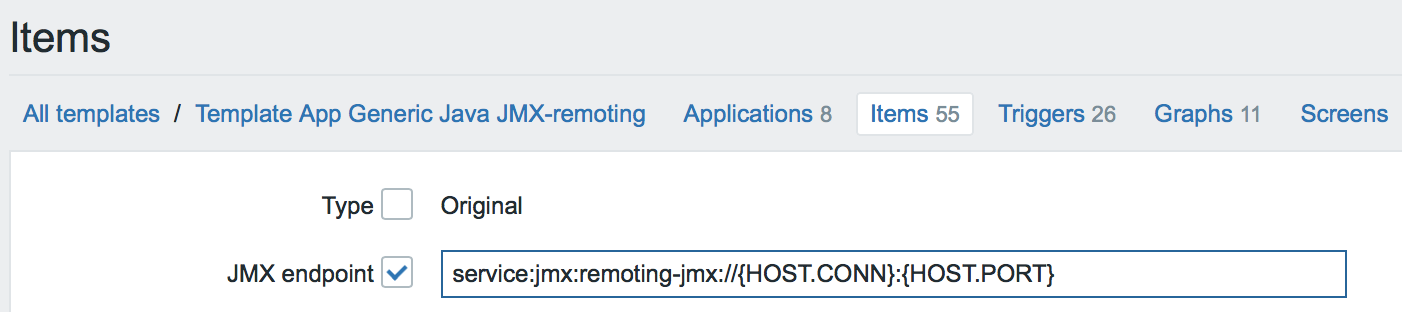
Let's do the Full Clone Template App Generic Java JMX template and call it "Template App Generic Java JMX-remoting". Select all the data elements inside this template and execute the Mass update operation for the JMX endpoint parameter. Let's write this URL:
service:jmx:remoting-jmx://{HOST.CONN}:{HOST.PORT}
Update the configuration cache:
$ /usr/local/sbin/zabbix_server -R config_cache_reload And again a mistake.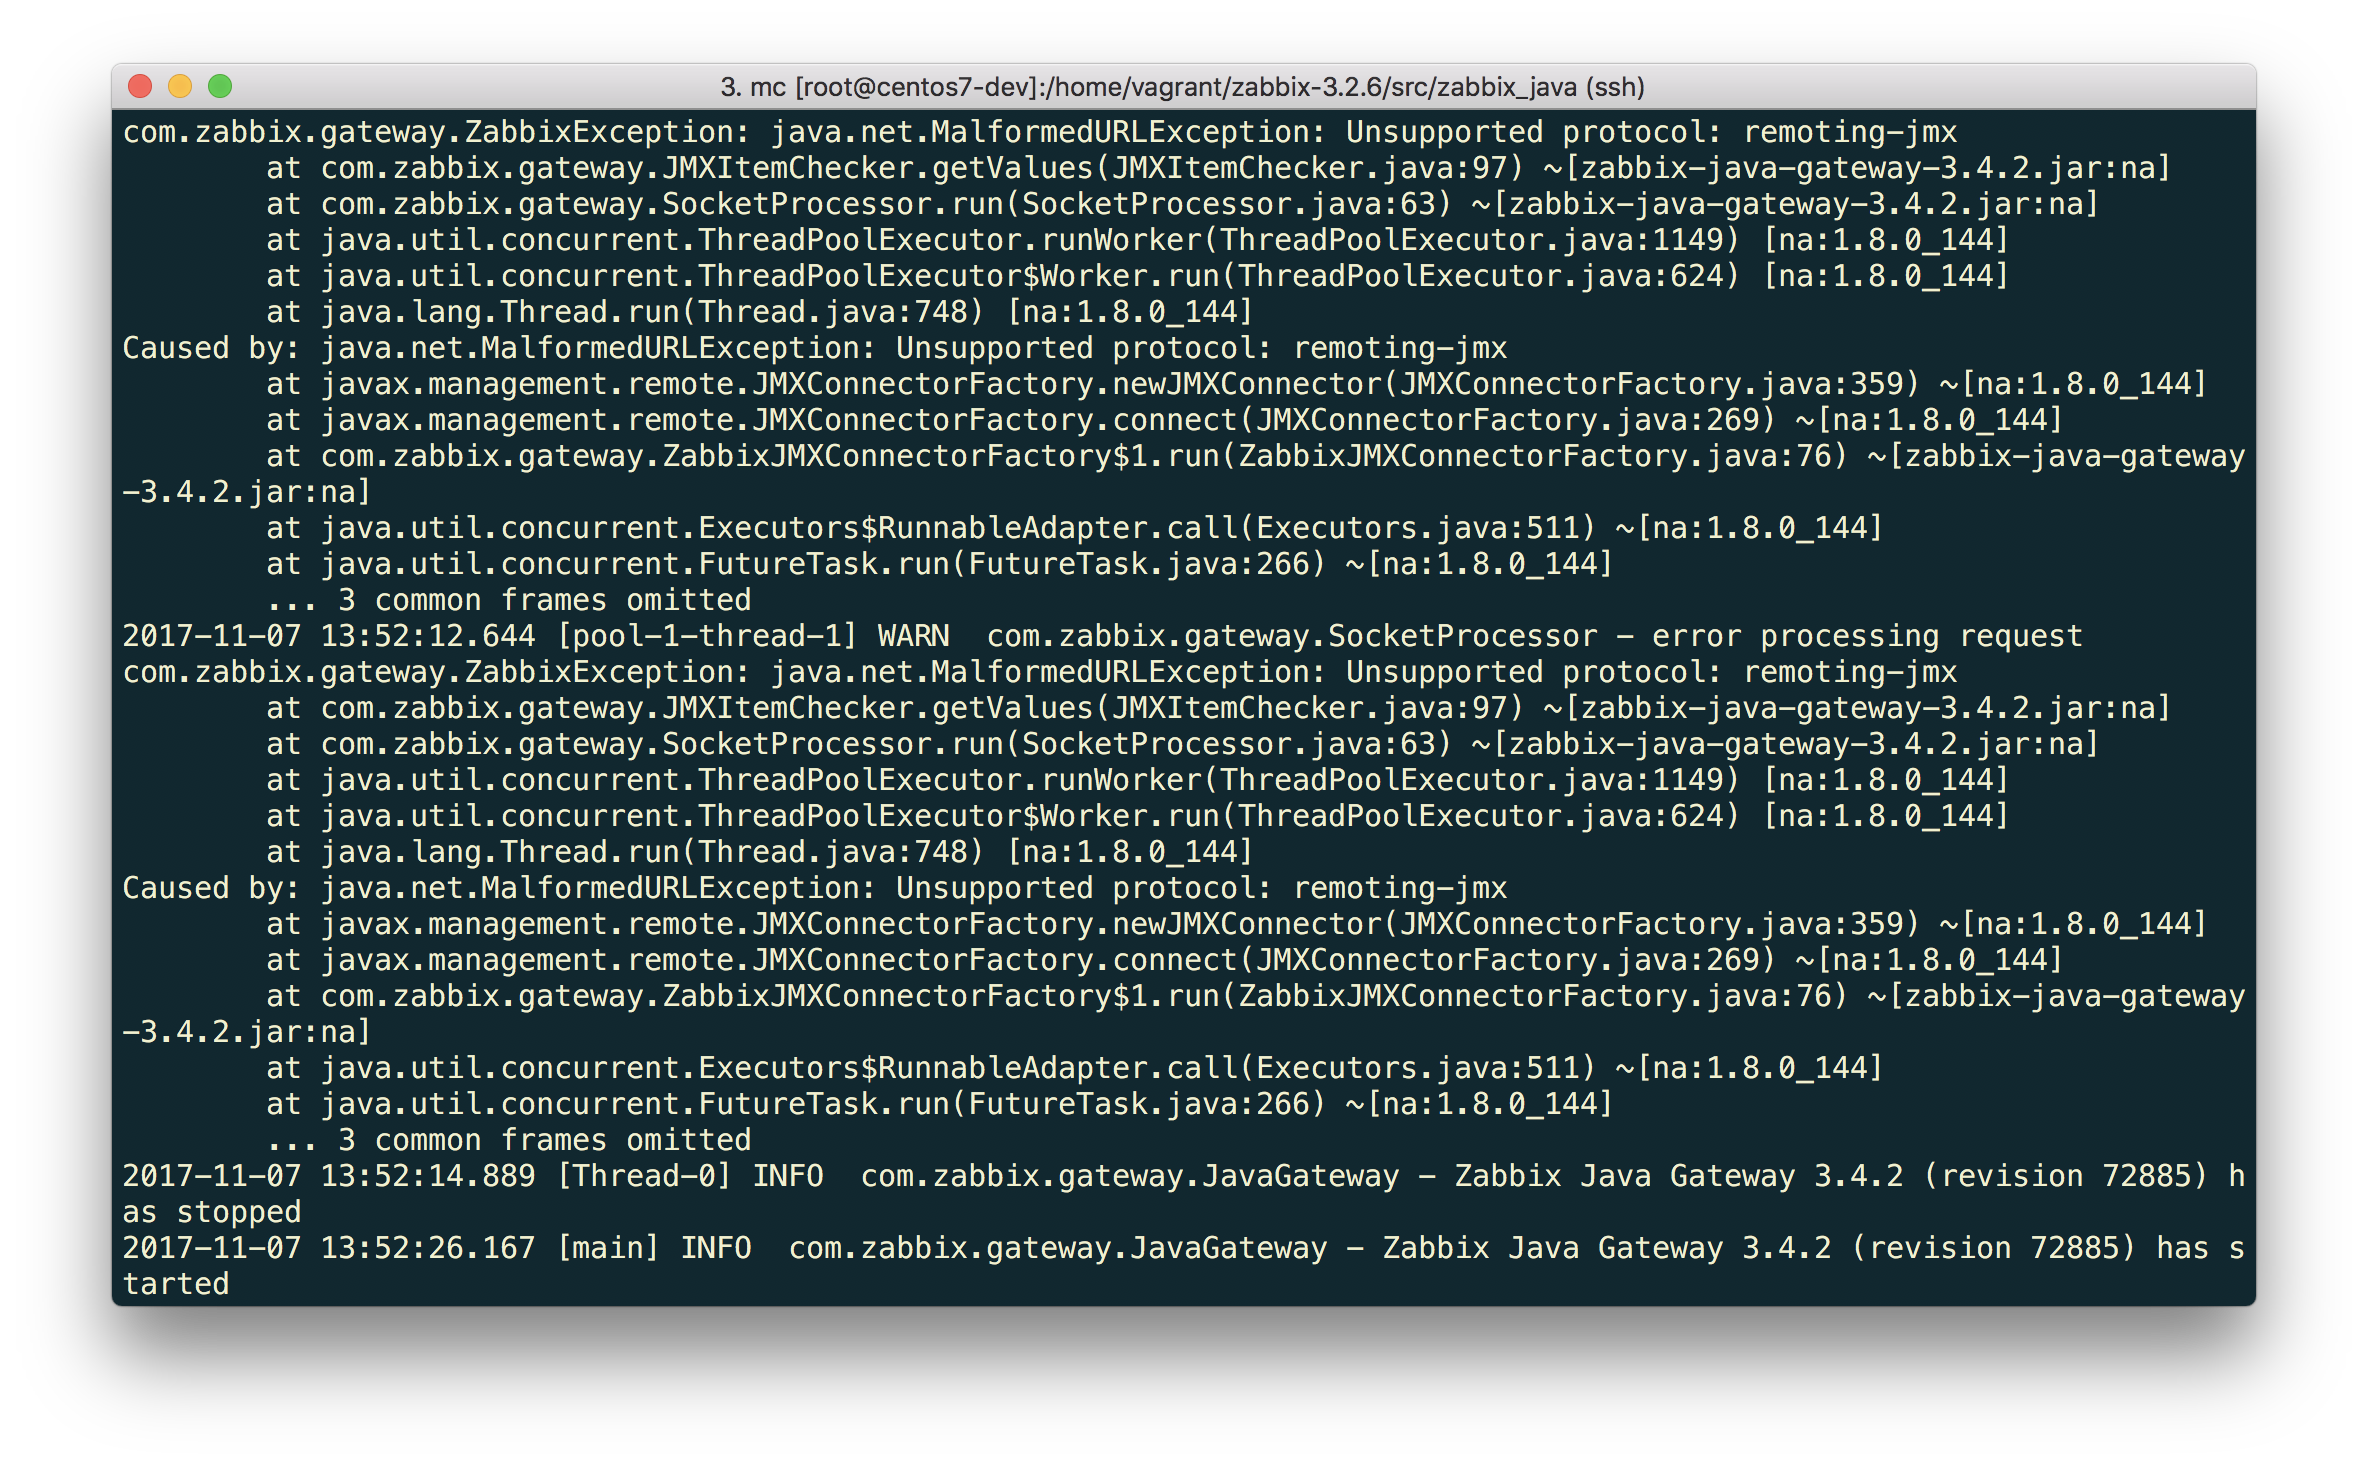
What is it this time?
“Unsupported protocol: remoting-jmx” means that Java Gateway cannot work with the specified protocol. Well, let's teach him. The advice from the article "JBoss EAP 6 monitoring using remoting-jmx and Zabbix" will help us with this.
Create a file ~ / needed_modules.txt with the following contents:
jboss-as-remoting jboss-logging jboss-logmanager jboss-marshalling jboss-remoting jboss-sasl jcl-over-slf4j jul-to-slf4j-stub log4j-jboss-logmanager remoting-jmx slf4j-api xnio-api xnio-nio Run the command:
$ for i in $(cat ~/needed_modules.txt); do find /opt/jboss-eap-6.4 -iname ${i}*.jar -exec cp {} /usr/local/sbin/zabbix_java/lib/ \; ; done Thus, Java Gateway will have all the necessary modules for working with jmx-remoting. It remains only to restart Java Gateway, wait a bit and, if you did everything correctly, see that the cherished data began to flow to Zabbix: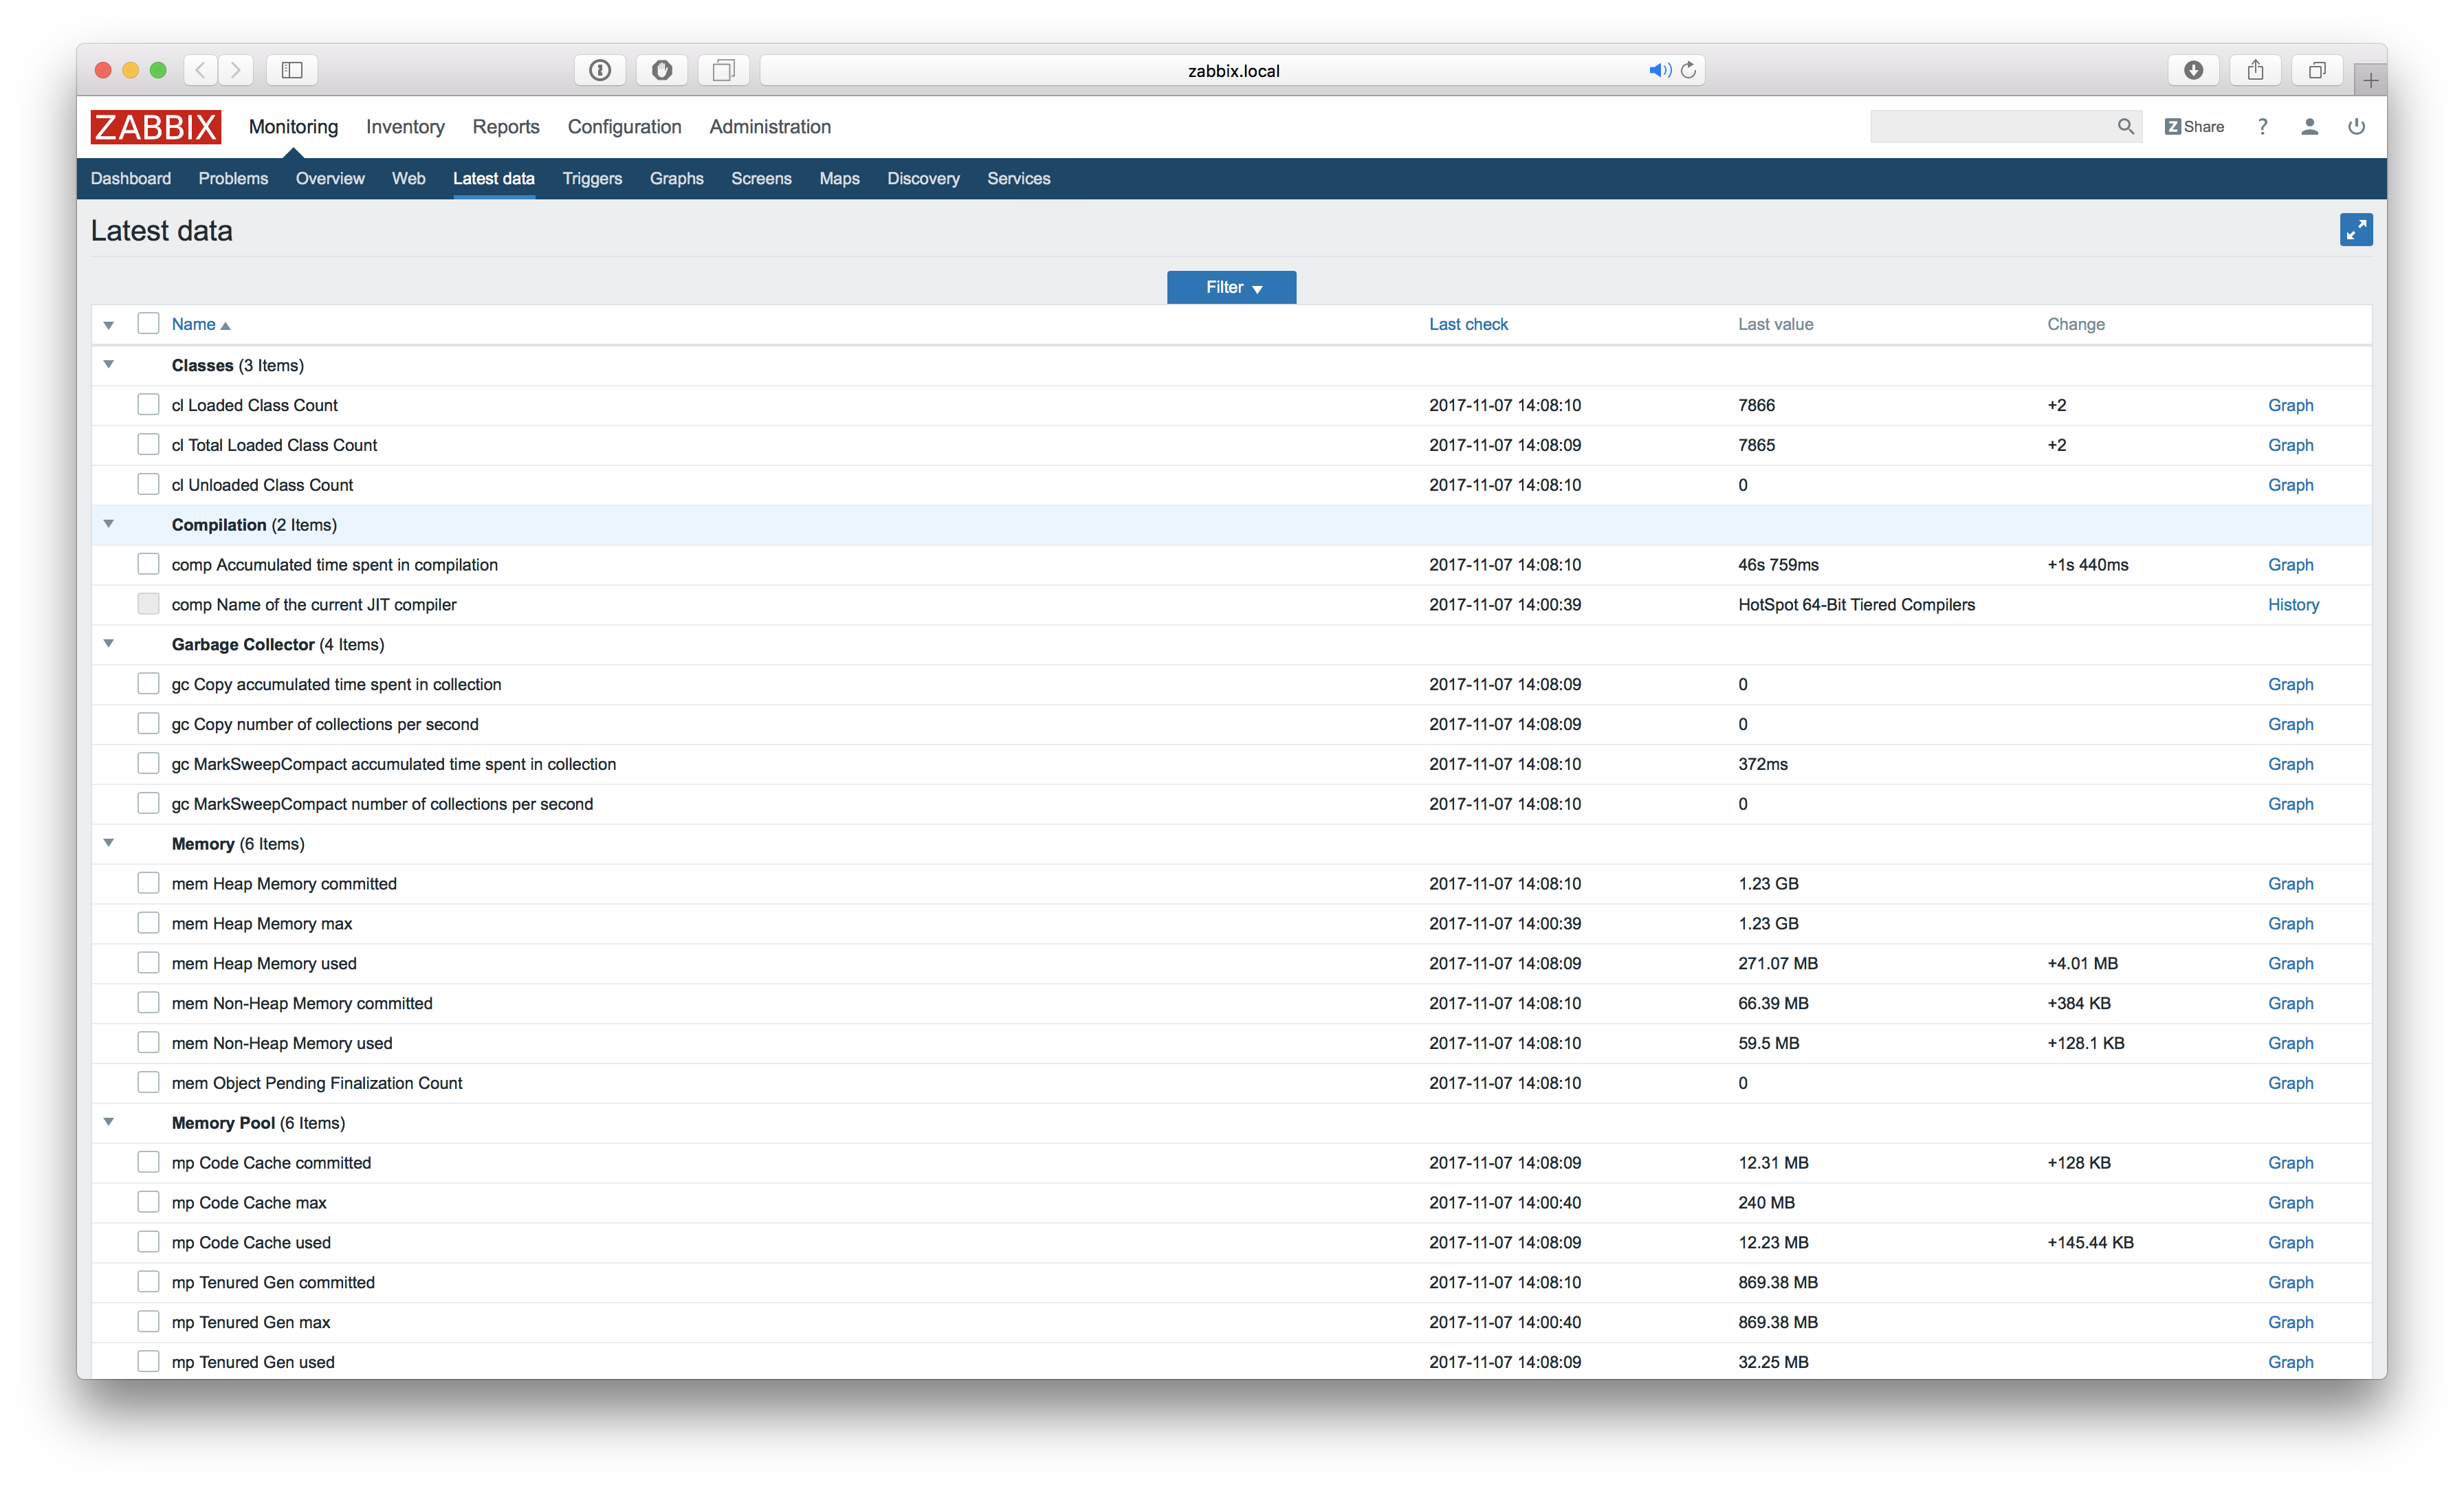
And what about JMX detection?
JMX detection appeared in Zabbix simultaneously with the advent of native support for monitoring Java applications via JMX. The undocumented (at that time) jmx.discovery key is responsible for this function. There was not a word in the documentation about it, because it was still a very raw function: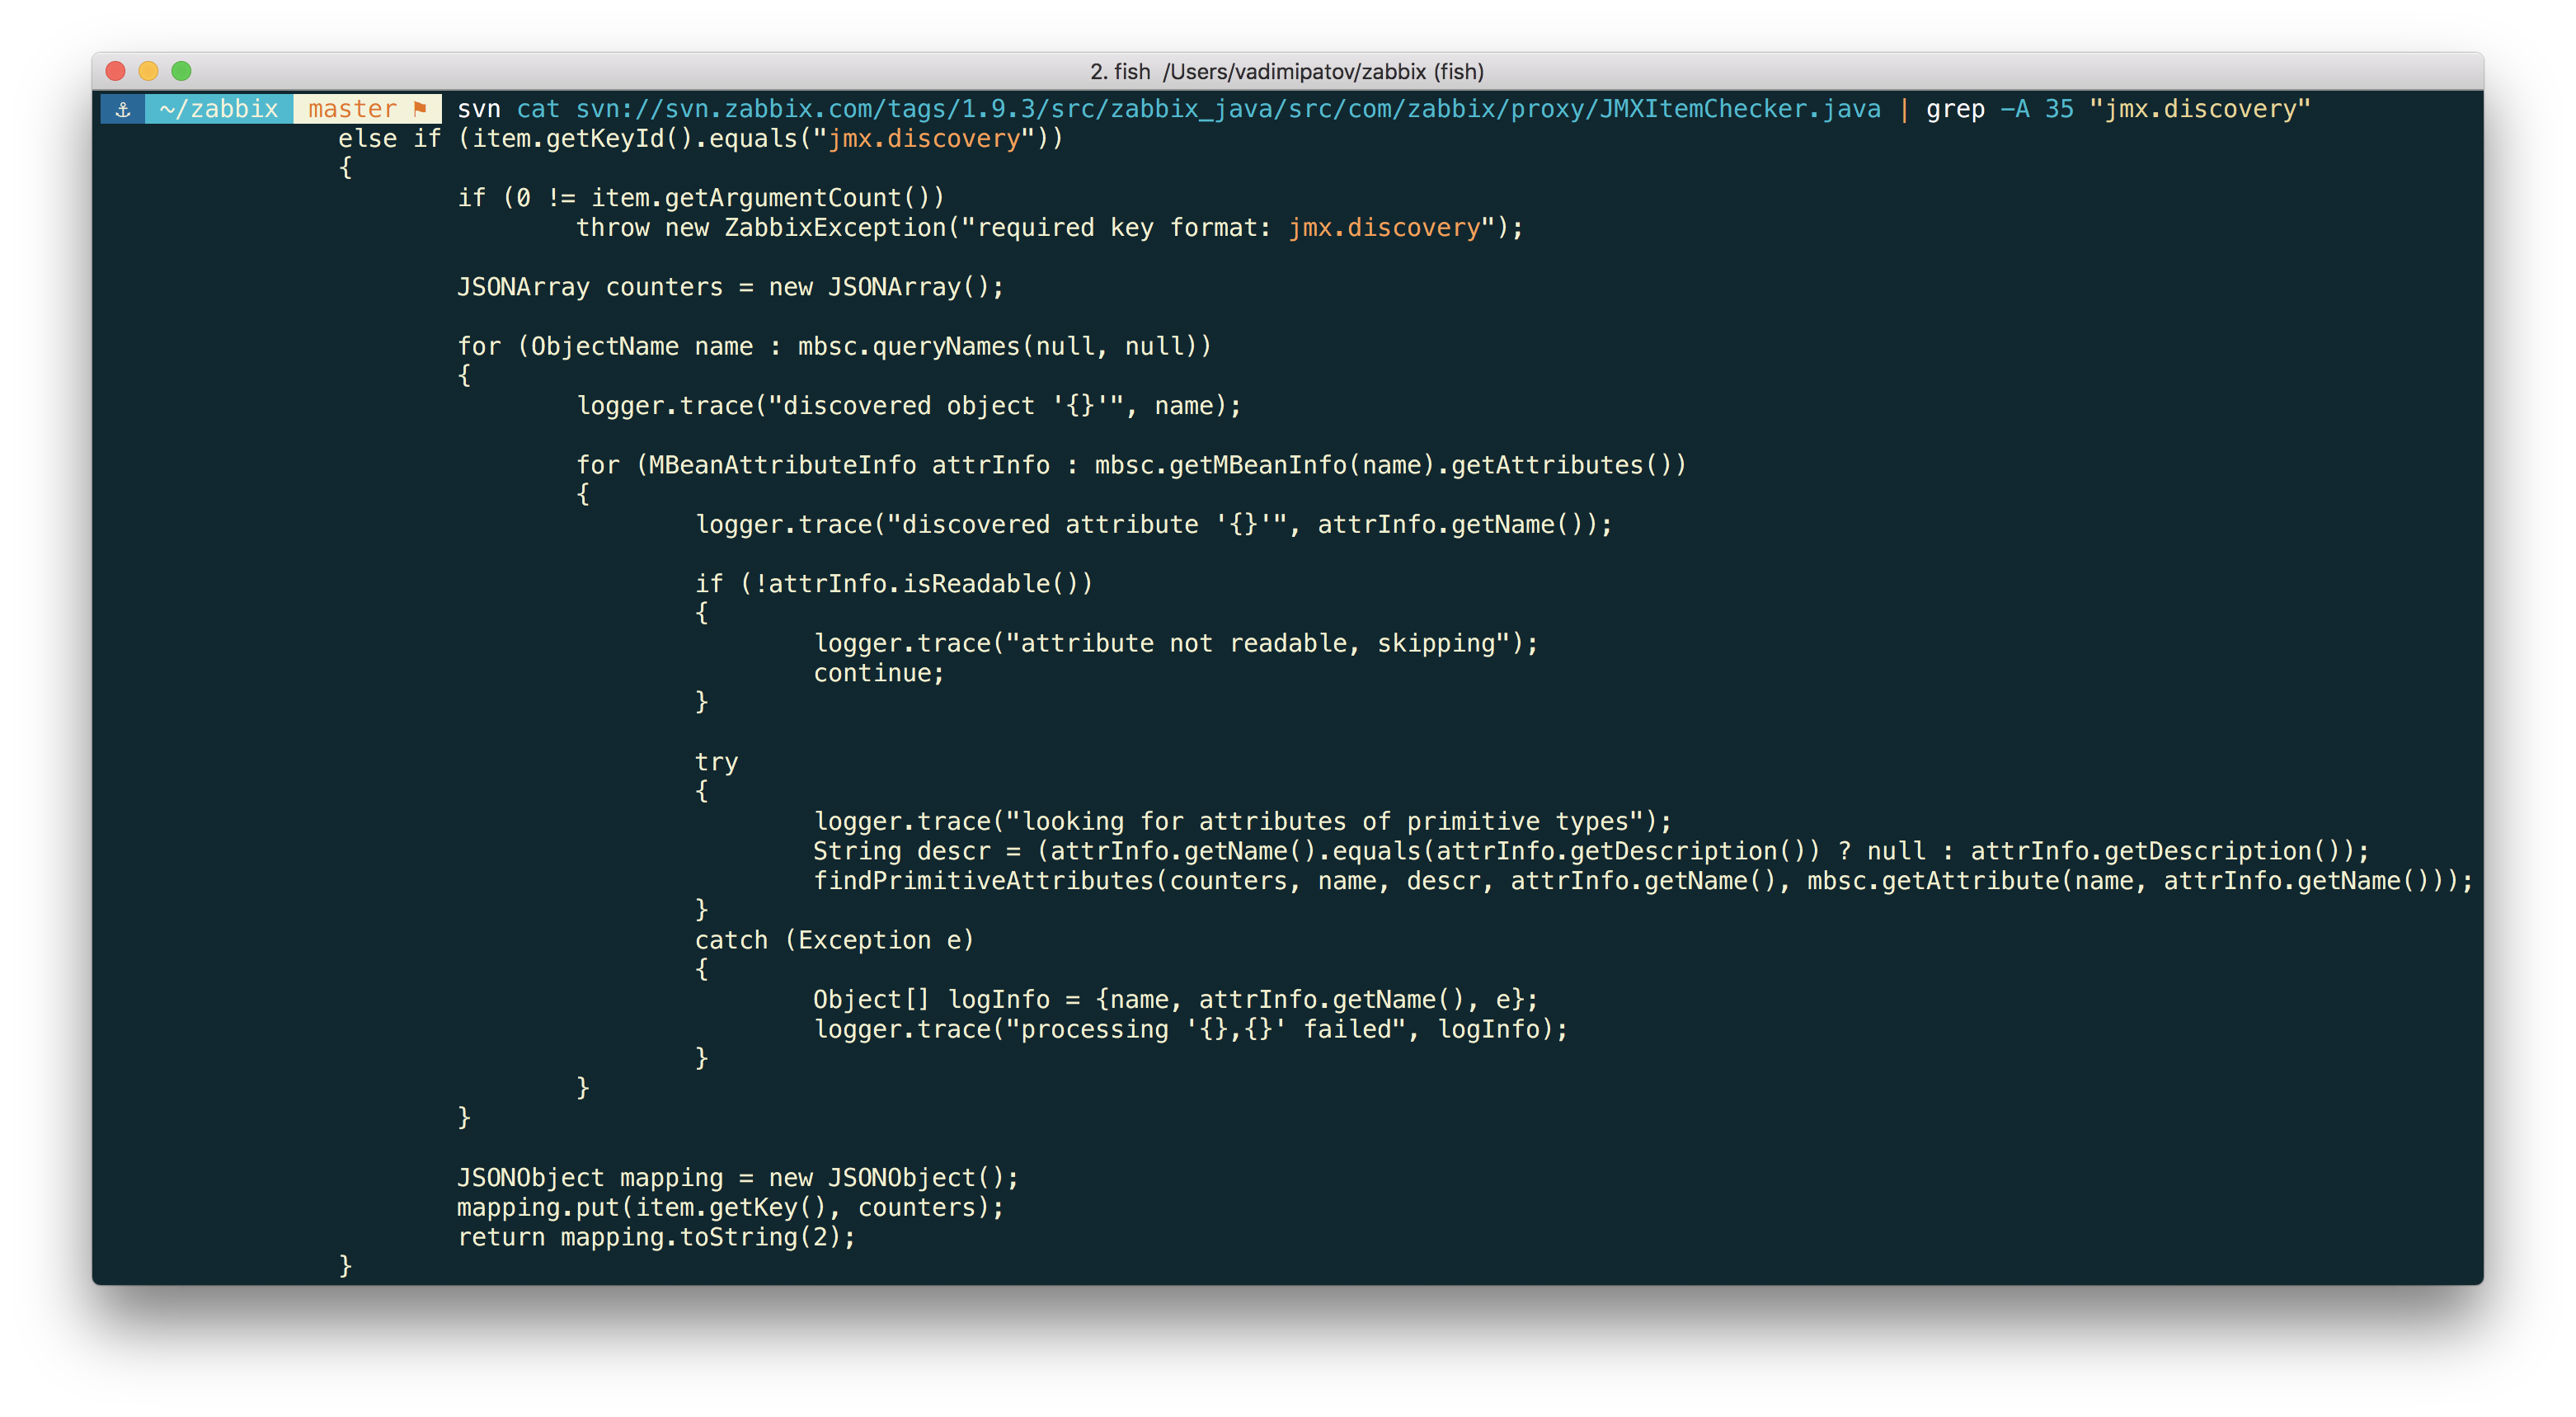
- There is little point in such a discovery, because there is no way to filter. And hardly anyone needs to detect all existing JMX objects.
- This is a very slow decision, because there is one request for each MBean, and there can be quite a lot of them. It is very likely that such a test will simply fall off due to a timeout.
- In this form, you can create only one detection rule within the host, which is very sad, because in practice I would like to create many rules (the data types for different attributes may be trite).
In Zabbix 3.4, filtering has appeared, which immediately solves many problems.
The new check looks like this: jmx.discovery[< >,< >]
And allows you to specify whether the detection of MBeans or their attributes is required, as well as by which template to search for them.
Let's try it in action! We collect, for example, garbage collectors. It is known that their names may differ depending on which parameters the JVM is running with. So, we cannot set static names and keys for data elements - this is a job just for jmx.discovery.
The documentation describes four use cases for us:
| Key | Description |
|---|---|
jmx.discovery | Get all JMX MBean attributes |
jmx.discovery[beans] | Getting all the JMX MBeans |
jmx.discovery[attributes,"*:type=GarbageCollector,name=*"] | Getting all garbage collection attributes |
jmx.discovery[beans,"*:type=GarbageCollector,name=*"] | Getting all the garbage collectors |
We will not use the first two options, since This is not very good in terms of performance. Let's see what the last two give us back.
For this purpose, we can simply create an item with the necessary key and text data type. But this is not very convenient. First of all, the output will be unformatted and unattractive. Secondly, in order to change the request, we will have to change the item key every time and wait for some time to update the data.
This is not our way. Let's better do something like zabbix_get, only instead of the agent we will turn to Java Gateway. To do this, we will slightly modify the script proposed in this note for the new API: add jmx_endpoint to the request and correct the deletion of the header from the answer:
#!/usr/bin/env bash if [ $# != 6 ] then echo "Usage: $0 <JAVA_GATEWAY_HOST> <JAVA_GATEWAY_PORT> <JMX_SERVER> <JMX_PORT> <JMX_ENDPOINT> <KEY>" exit; fi # create connection exec 3<>/dev/tcp/$1/$2 # compose message MSG="{\"request\": \"java gateway jmx\", \"conn\": \"$3\", \"port\": $4, \"jmx_endpoint\": \"$5\", \"keys\": [\"$6\"]}" # write message length as zero-padded 16-digit hexadecimal number printf -v LEN '%016x' "${#MSG}" # prepare message length in little endian representation BYTES="" for i in {0..14..2} do BYTES="\\x${LEN:$i:2}$BYTES" done # prepend protocol header and message length printf "ZBXD\\1$BYTES%s" "$MSG" >&3 # output the result skipping 6 bytes of "ZBXD\\1" header and 8 bytes of message length tail -c+14 <&3 Now we can easily see what the gateway returns to us in response to our requests:
$ ./zabbix_get_java.sh 127.0.0.1 10052 127.0.0.1 9999 'service:jmx:remoting-jmx://127.0.0.1:9999' 'jmx.discovery[beans,\"*:type=GarbageCollector,name=*\"]' | jq '.data[0].value | fromjson | .data' 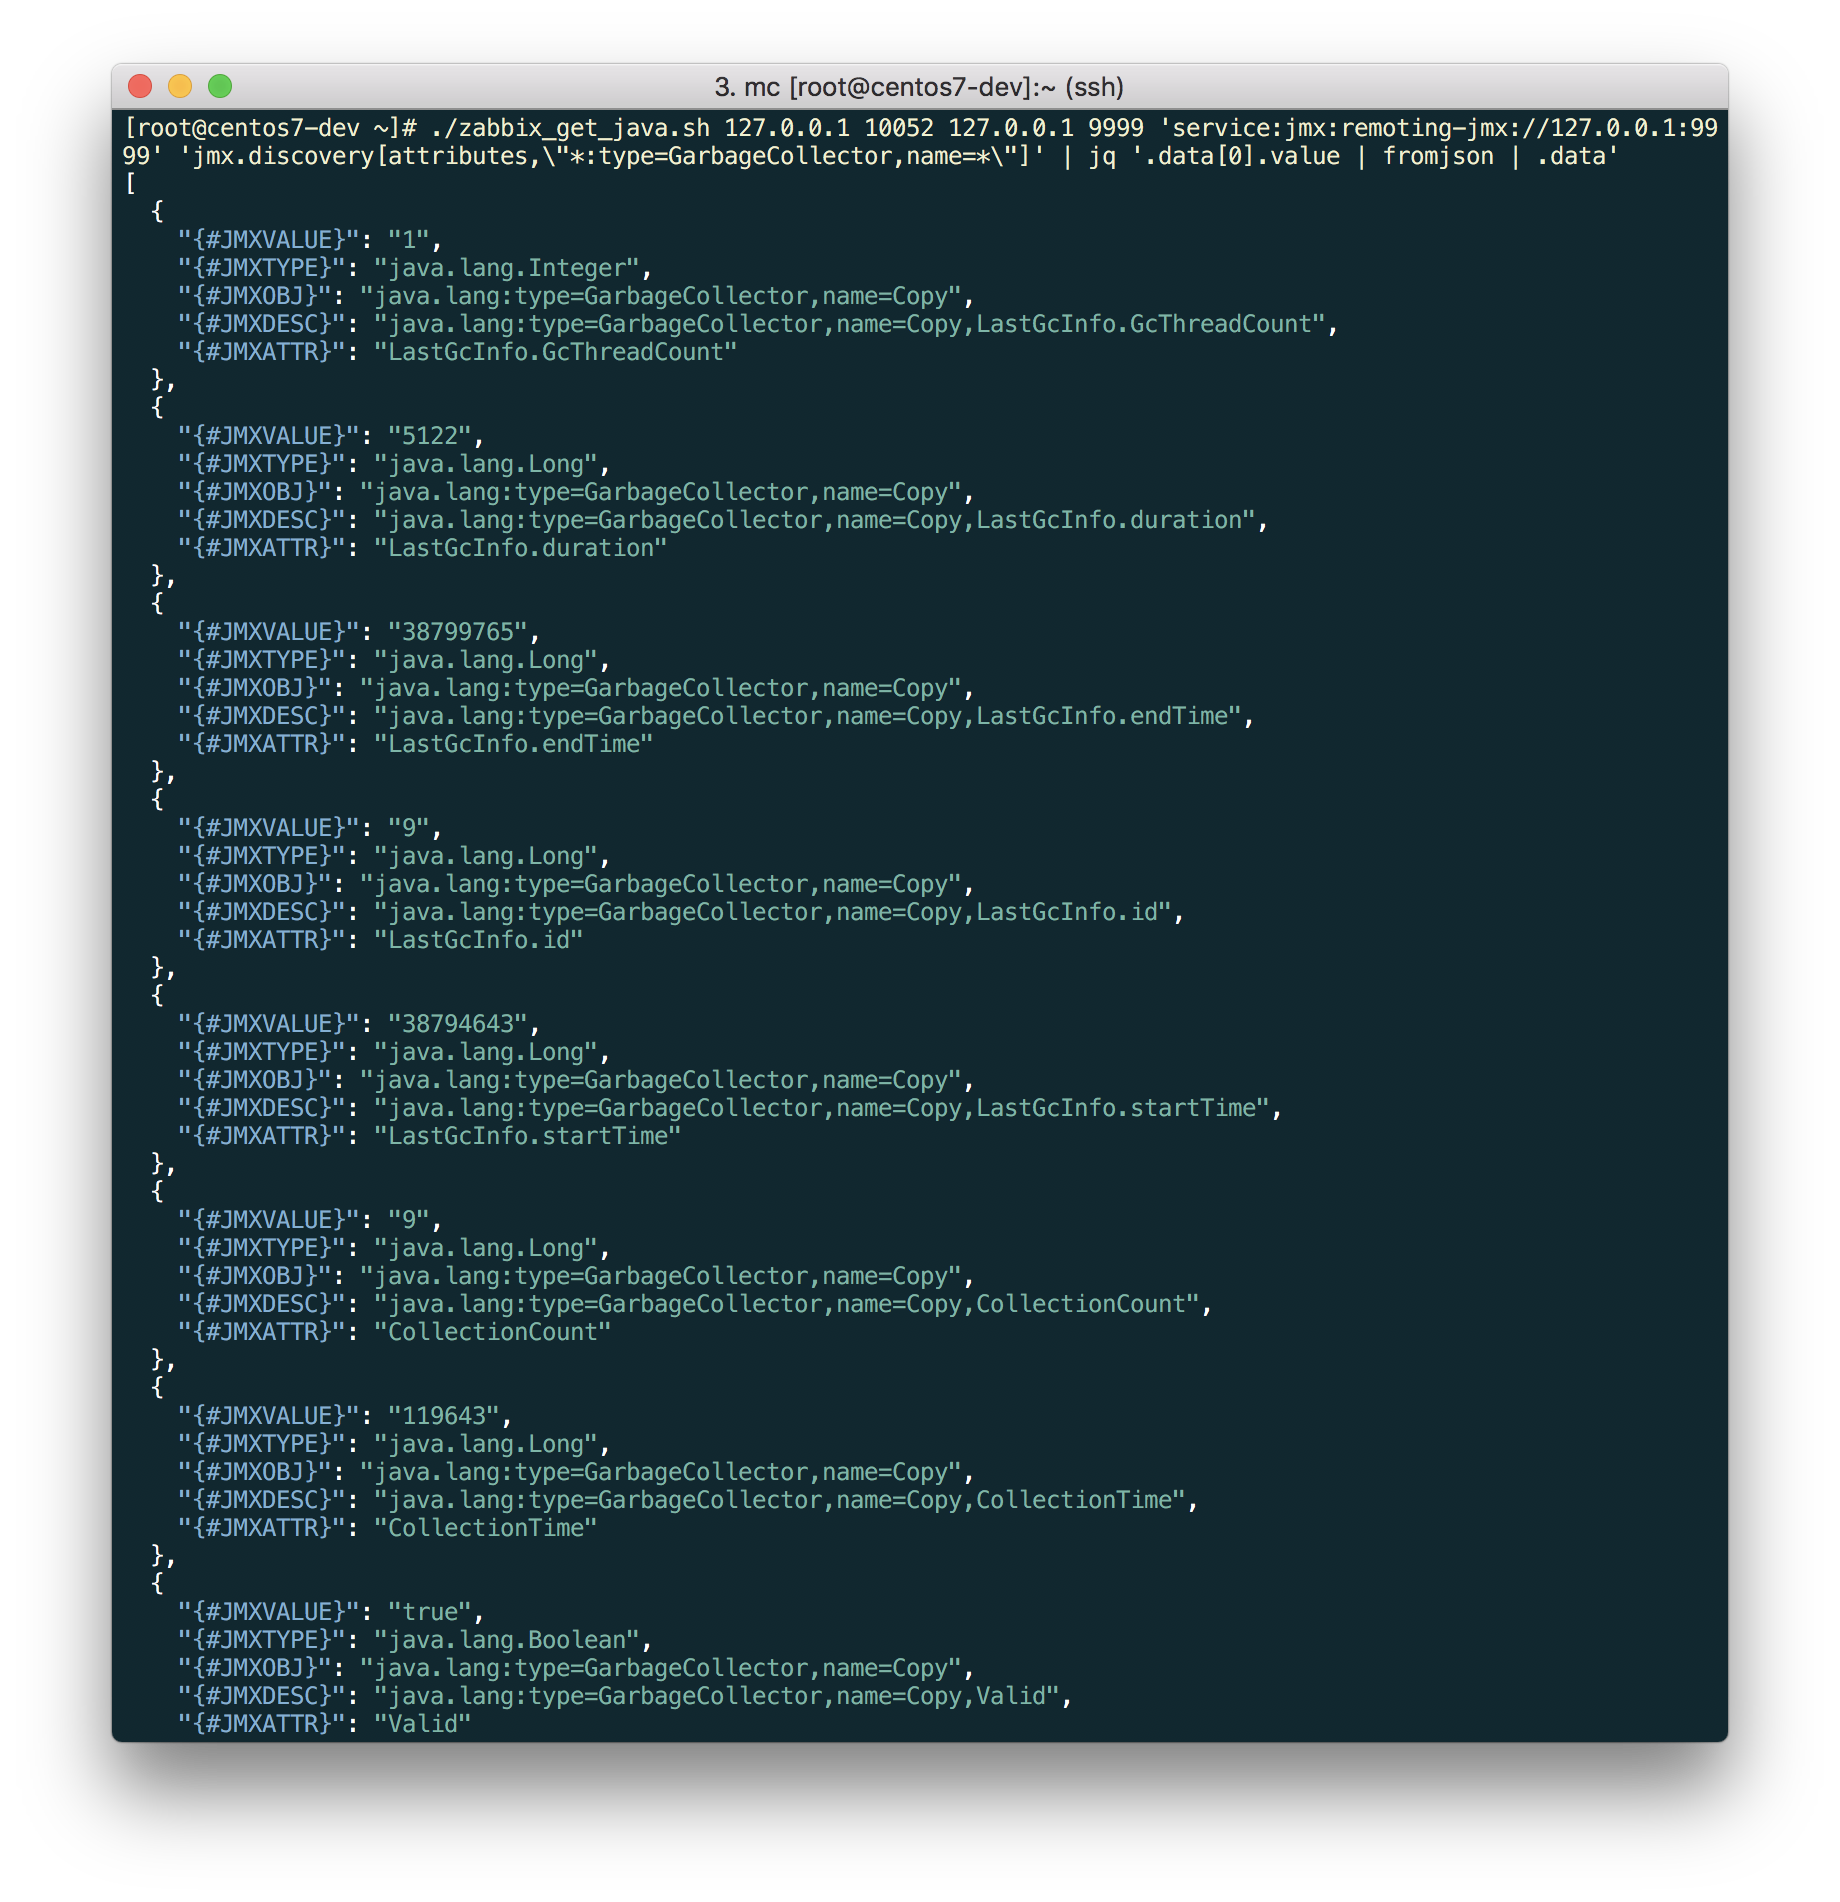
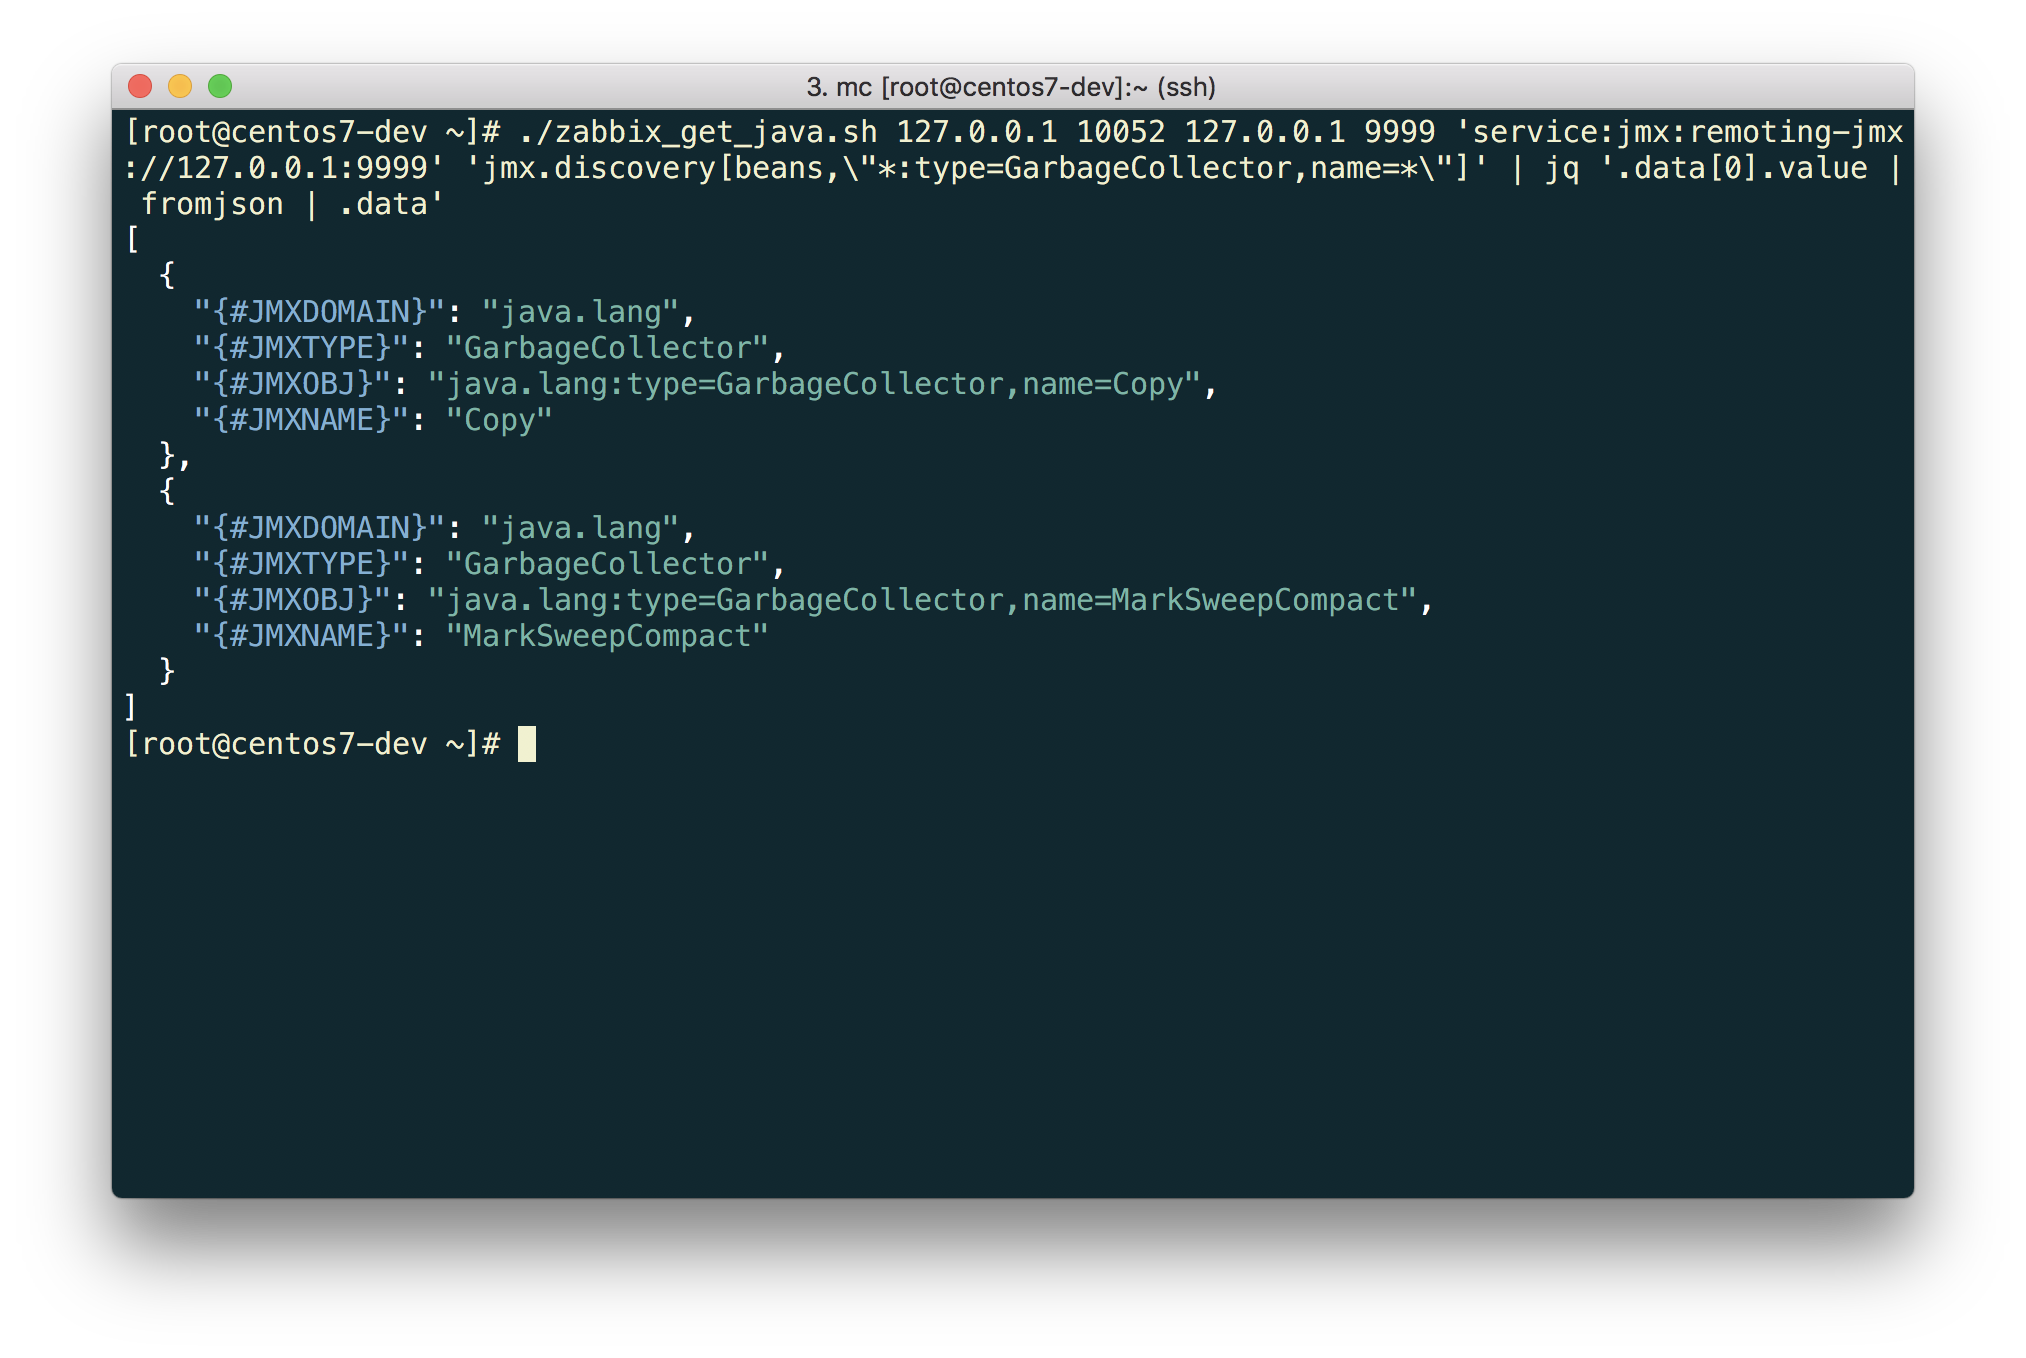
Exactly what is needed!
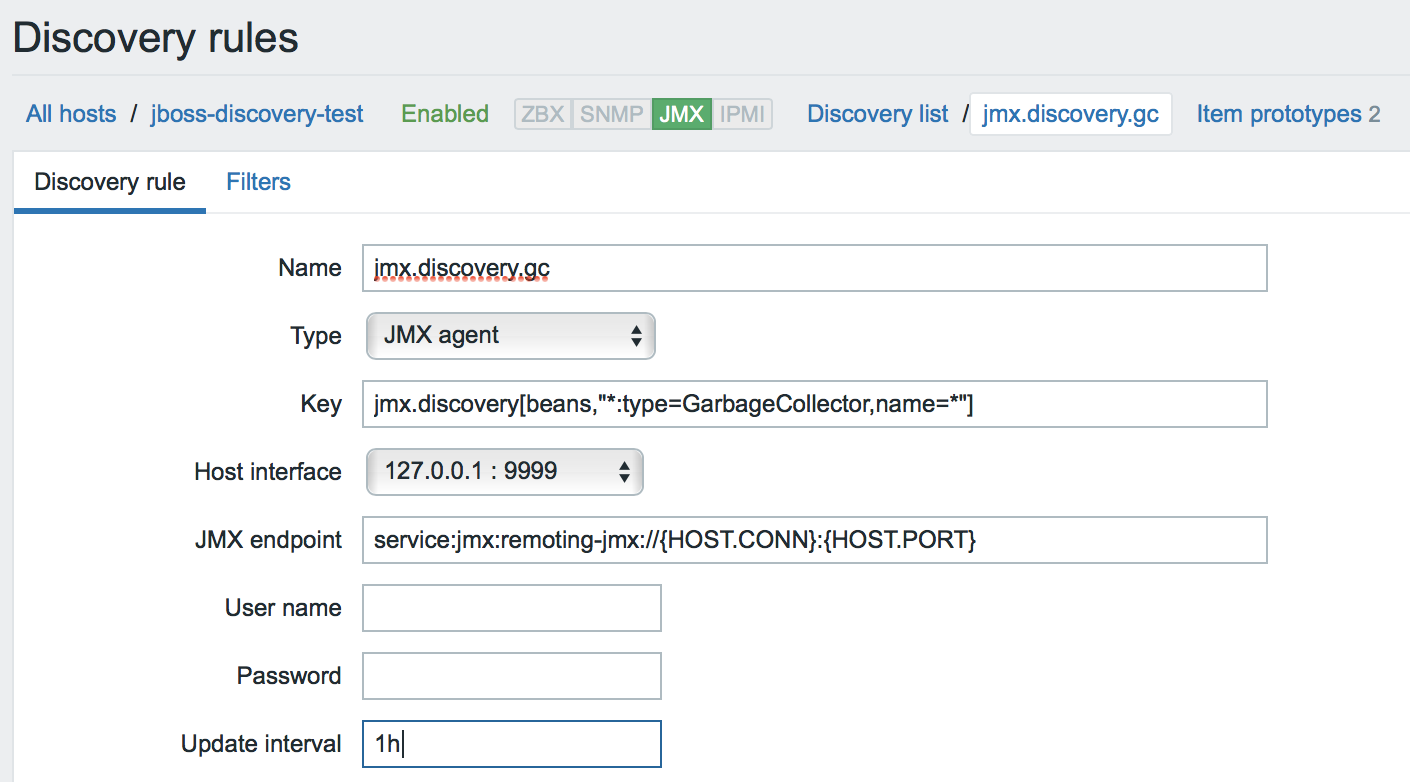
If we needed, let's say, just a couple of metrics, then we could detect all the gc and create a prototype for each metric.
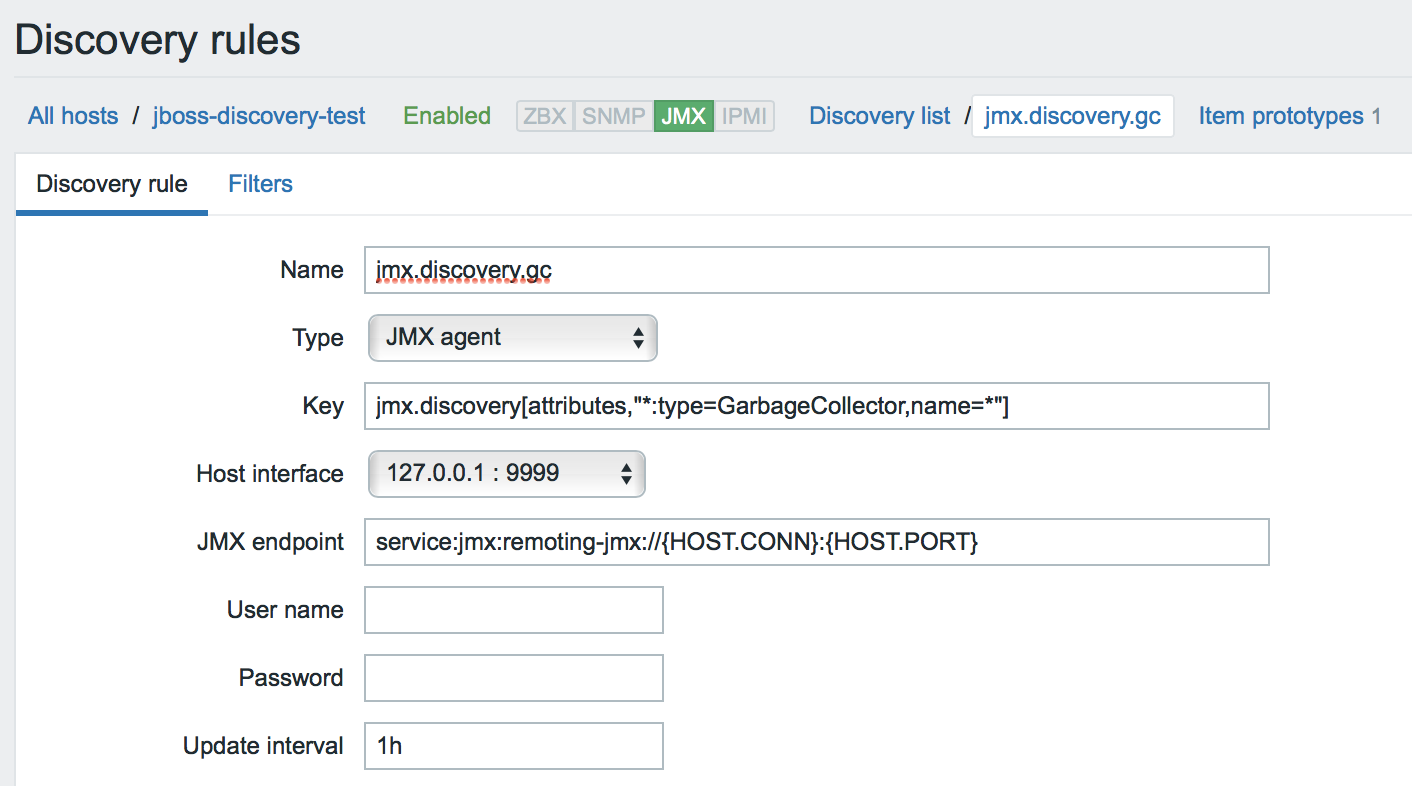
- Create a discovery rule. We are looking for MBeans (by the way, note that the custom JMX endpoint is used everywhere).
- We create prototypes for each metric of interest. In the data element name and its key, we can use any macros that we saw in JSON.
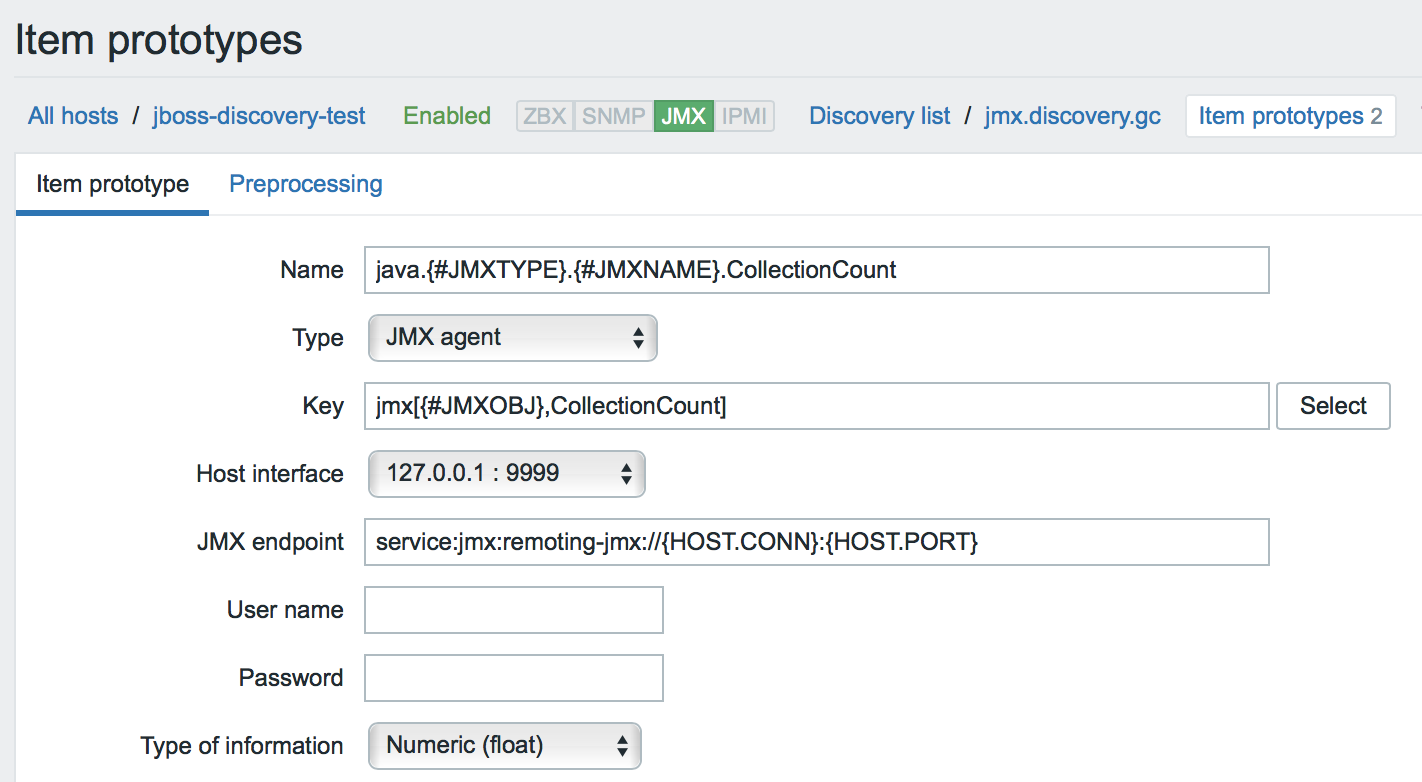
Speaking of macros. When MBeans are detected, macros are generated dynamically based on MBean properties (such as type and name).
Pay attention to this problem when using dynamic macros: https://support.zabbix.com/browse/ZBX-12705
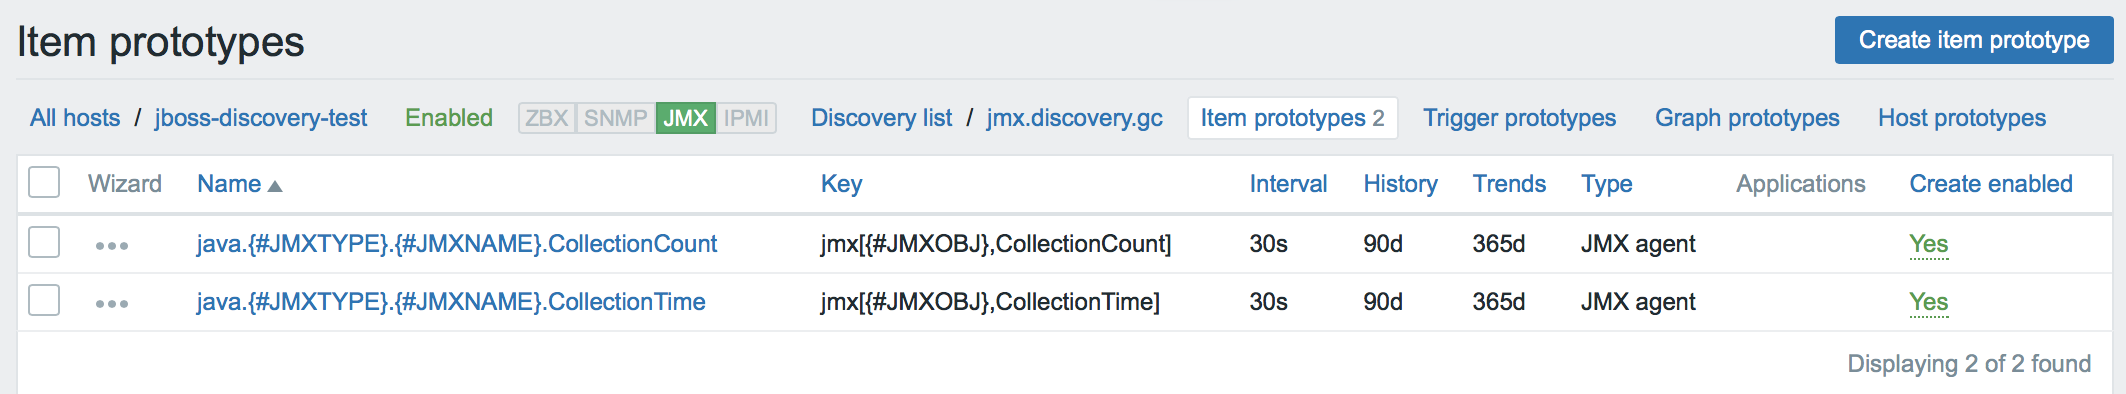
But let's say we want to create all the available numeric metrics for garbage collectors.
- Then we will create an attribute detection rule with a filter by data type.
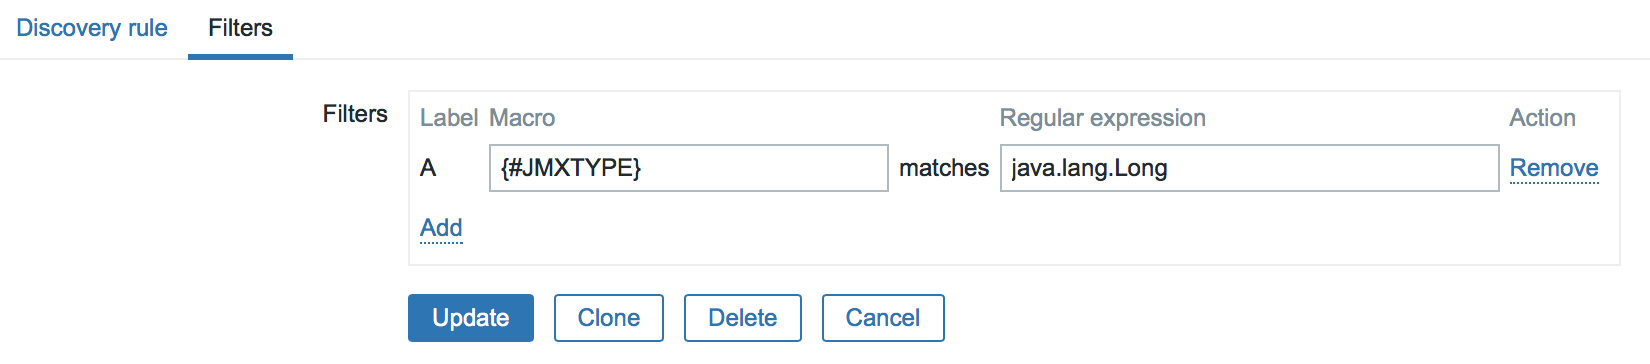
- And only one prototype:
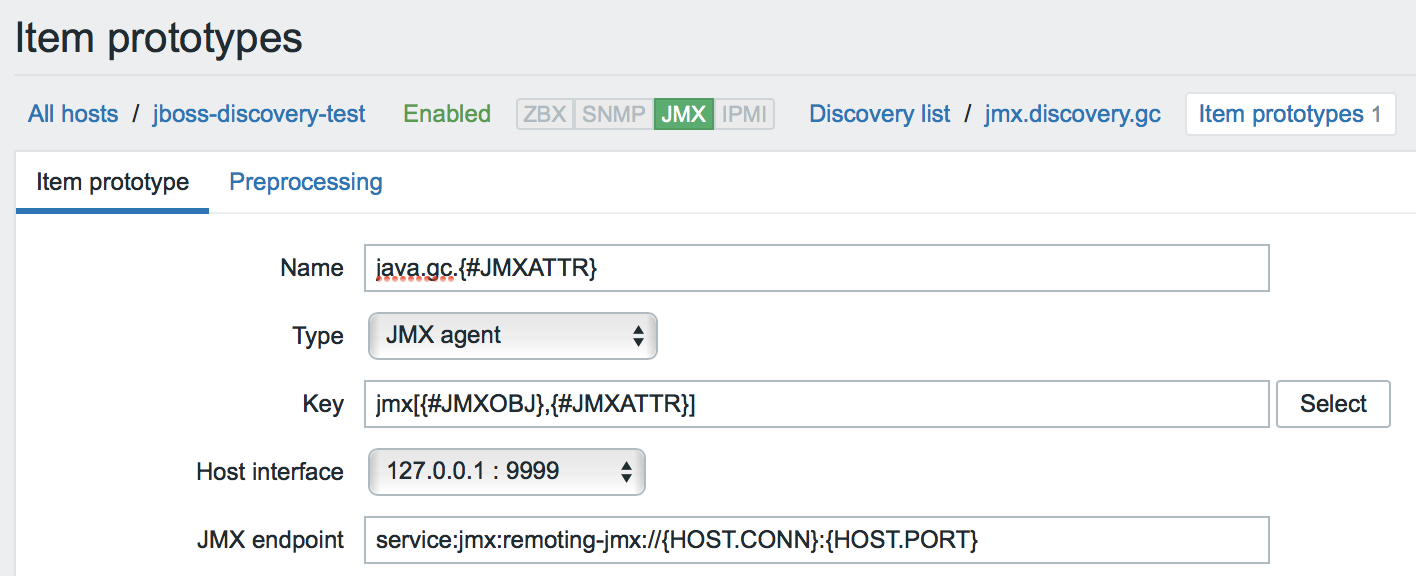
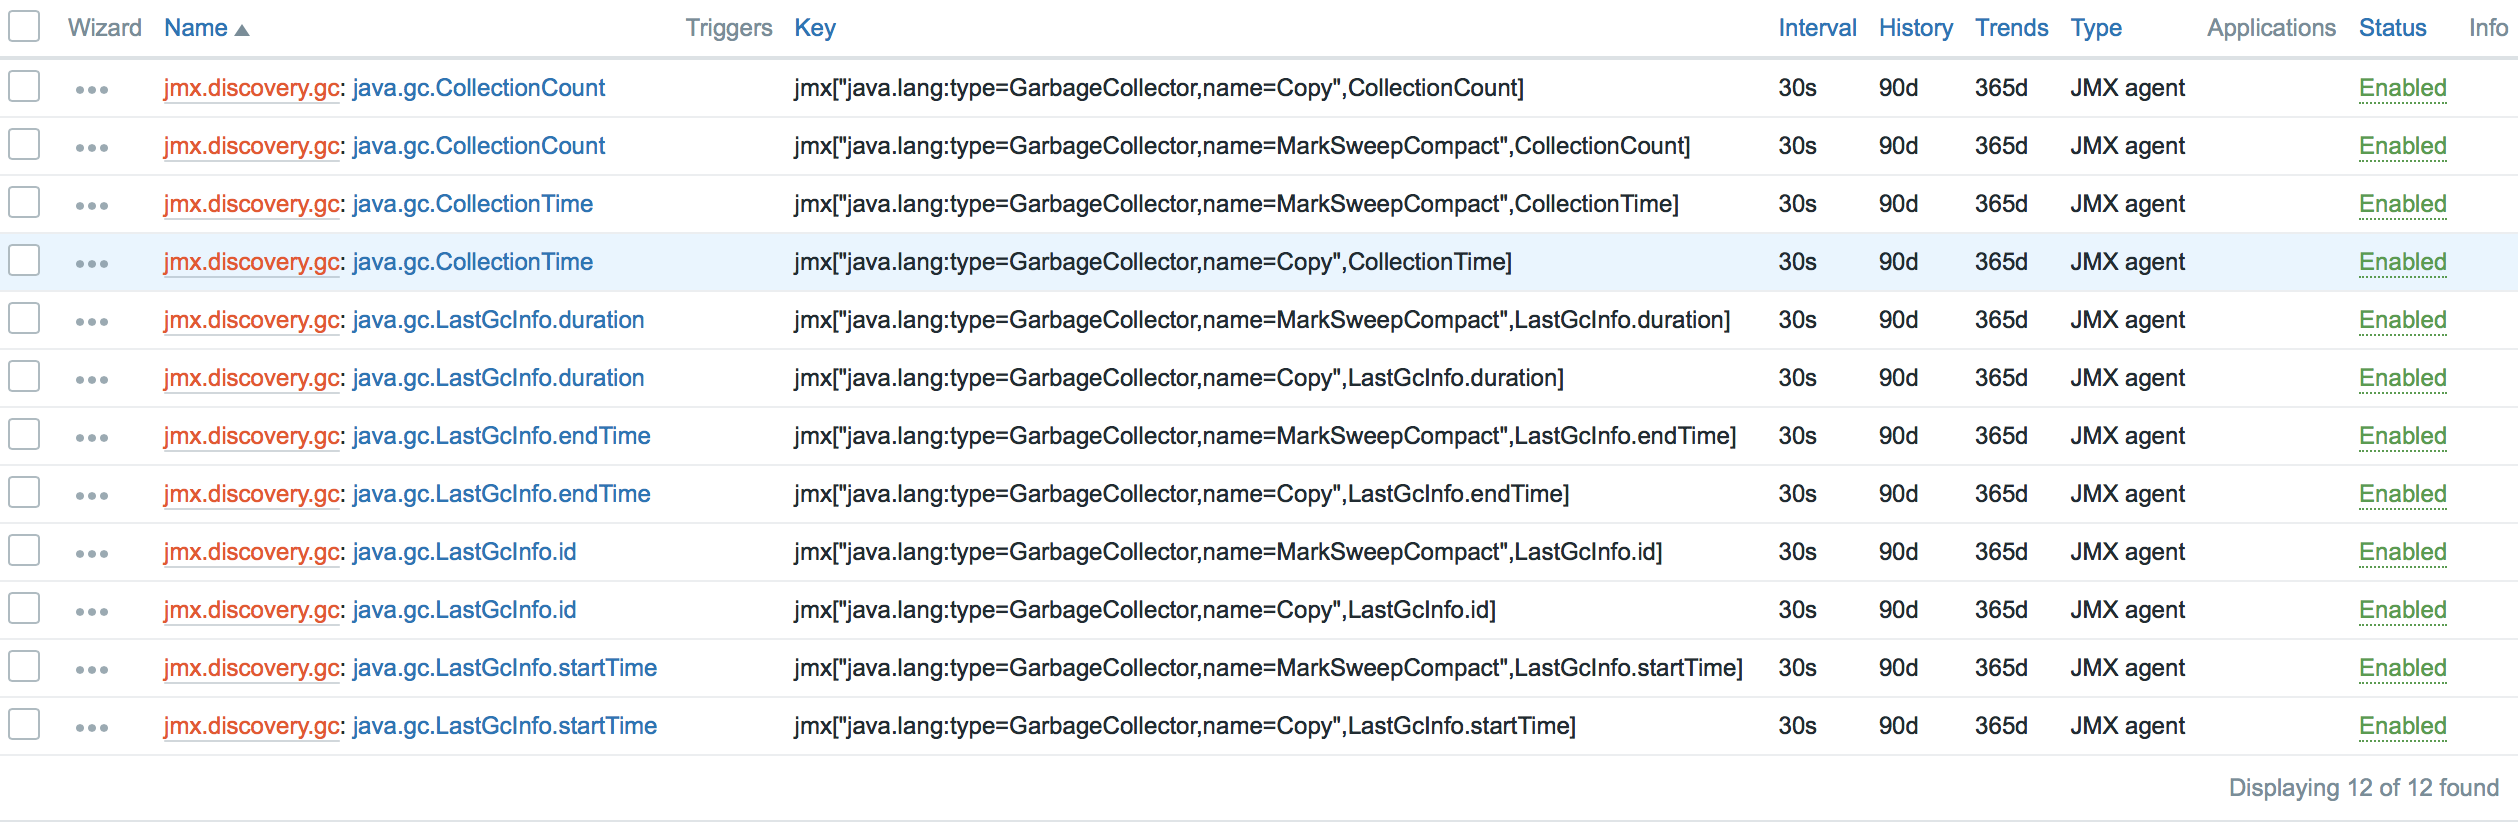
In such a simple way you can monitor any Java application. Dare! :)
I don’t have the opportunity to upgrade to Zabbix 3.4 now, how can I be?
The community has come up with many ways to get around this problem. If you do not have the opportunity to upgrade to this version, then here are the links: one and two .
Total
Thanks to the new implemented features, monitoring Java applications in Zabbix has ceased to be a pain. On the contrary, with each new version it becomes more and more simple and enjoyable :) We will try to please you further!
Stay tuned!
PS The article is also available in English in our blog .
PSS Articles about other innovations of Zabbix 3.4:
References
- http://java-course.ru/articles/jmx/
- http://www.javaspecialist.ru/2011/04/jmx-firewall.html
- https://docs.oracle.com/javase/tutorial/jmx/remote/index.html
- https://dzone.com/articles/remote-jmx-access-wildfly-or
- https://habrahabr.ru/post/225527/
- https://jcp.org/en/jsr/detail?id=160
- https://www.denniskanbier.nl/blog/monitoring/jboss-eap-6-monitoring-using-remoting-jmx-and-zabbix/
- https://www.ibm.com/developerworks/ru/library/j-jtp09196/index.html
- https://www.ixxus.com/blog/blog201102monitor-and-manage-alfresco-jmx/
')
Source: https://habr.com/ru/post/342226/
All Articles