Prometheus
Good to all. We share here a very interesting article, which we stumbled upon in preparation for our course . Translation goes as it is entirely (except for some comments).
Prehistory
In a nutshell - an introduction to the monitoring and appeal of convictions. As many know, I accompany Riemann, an event stream processing tool for monitoring distributed systems. In my book on monitoring , I used Riemann as the main tool for exploring new approaches and monitoring patterns, and described the whitebox monitoring architecture (with selective blackbox monitoring) using the push model.
')
To understand what I am talking about at all, we will explain some concepts. Blackbox monitoring is responsible for checking the external characteristics of services or applications: whether it is possible to connect to the open port of the service, whether the correct data or the response code is returned. An example of a blackbox monitoring is an ICMP request and acknowledgment of a response.
In turn, whitebox monitoring is focused on what is happening inside the service or application. An application with appropriate tools returns the state of itself or its internal components, the result of the execution of transactions or events. This data answers the question “how the application works” and not the question “does the application work”. Whitebox monitoring transfers events, logs or metrics to a special monitoring tool or provides information outside for later collection with a monitoring tool.
Most people involved in modern monitoring, understand that in whitebox monitoring you need to invest heavily. The information obtained from the inside of the application is significantly greater value for business and operation than that obtained on the surface. This does not mean that blackbox monitoring is a waste of resources. External monitoring of services and applications is useful, especially for services that are outside of your control, or when looking from the outside gives a context that is not accessible from the inside, for example, regarding routing or DNS problems.
In the book, I focus on working with the push model, not pull. Also, a lot of attention in the book is paid to the benefits of monitoring based on the push model over the pull model. Many (if not most) monitoring systems are built precisely on the basis of a pull / polling model. In this model, the system polls the service or application that monitors. In turn, in the push model, applications and services themselves send data to the monitoring system.
For a variety of reasons (some of them are not obvious at first glance), I prefer the push model. But the features of both approaches often do not interfere with implementation for a number of reasons (for example, because of the scale). And the probability of success does not depend on disputes about the implementation or tools. I am of the opinion that the tools, first of all, should be right for you, and there is no point in mindlessly following trends or dogmatism.
It was the desire not to be categorical and the lack of understanding of community differences that inspired me to write an introductory tutorial for one of the leading monitoring tools based on a pull model: Prometheus. It is very popular, especially in the world of containers and Kubernetes.
Meet Prometheus
Prometheus was developed by Soundcloud engineers who previously worked at Google. It is written in Go, has an open source and is being developed with the support of the Cloud Native Computing Foundation . The inspiration for the project was Borgmon from Google.
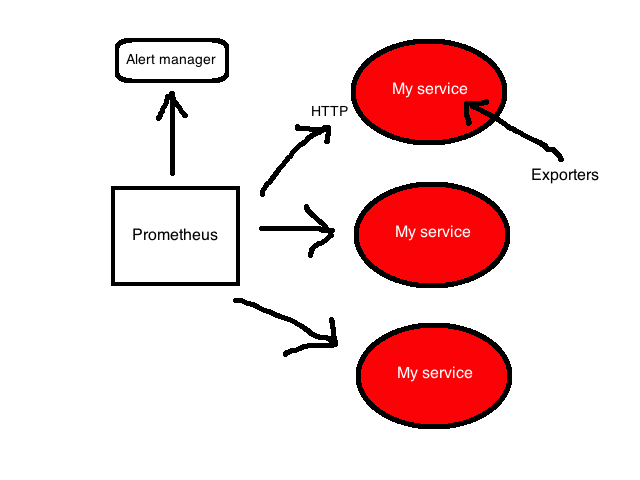
Prometheus is focused on whitebox monitoring. It collects time series data from applications and services. The application provides this data on its own or through plug-ins, called exporters.
The Prometheus platform is based on a server that collects and stores time series data. It has a multi-dimensional time series model that combines metric names and key / value pairs, called metadata labels. Time series data is stored on the server, individual servers are autonomous and do not depend on distributed storage.
The platform also contains client libraries and a number of exporters for specific functions and components. For example, StatsD exporter, which converts time series StatsD data to Prometheus format. In addition, there are push gateways for receiving small amounts of incoming data and an alert manager who can handle notifications created by triggers or when thresholds of data collected by Prometheus are exceeded.
More detailed architecture can be found in the documentation Prometheus.
Installation
Prometheus server is a binary file with the same name prometheus. Take the latest version and unpack it.
The official site also contains various additional components: an alert manager for sending notifications and exporters for various services.
Customization
The binary prometheus file that we just unpacked is configured via the YAML file. Let's see what it is:
This configuration file defines three YAML blocks:
Global
The first global block contains global settings for controlling server behavior.
scrape_interval sets the polling interval for the application or service, in our case 15 seconds. This is the resolution of the data scale, i.e. the period of time that is covered by each data point.
evaluation_interval tells Prometheus how often to process data according to the rules. There are two main types of rules: rules of writing and rules of alert. Write rules allow you to pre-compute frequently used and resource-intensive expressions and save the result as new time series data. Alert rules allow you to define alert conditions. Prometheus will (re-) check these conditions every 15 seconds.
External_labels contains a list of key / value pairs for tags that will be added to any metric that exists on the server, for example, when generating a warning.
Rule files
The second block, rule_files, contains a list of files with the rules of recording or alert.
Survey Configuration
The last scrape_configs block shows all the targets that Prometheus will poll. Prometheus calls targets instances, and groups of instans calls jobs. By default, there is only one task - prometheus. Inside it is a static_config with a list of instances (by default only one is the Prometheus server). He polls the localhost port 9090 to get the state metrics of the server itself. It is assumed that the metrics are in / metrics, so the localhost: 9090 / metrics address is locally polled. The path can be changed using the metric_path option.
The lonely task is pretty boring, so let's add one more to poll the local Docker daemon. Use the instructions in the Docker documentation and configure the daemon to give the metrics from the address localhost: 9323 / metrics. And after that, add another task called docker.
The job has a name and an instance that refers to the address to get the Docker daemon metrics. The default path is again / metrics.
The full configuration file can be found by reference .
Server startup
Run the server and see what happens.
Run the binary file and specify the configuration file in the command line flag -config.file. The Prometheus server is now running, polls the instances in the prometheus and docker tasks and returns the results.
Dashboard
Prometheus has a built-in interface where you can see the results. To do this, open in the browser http: // localhost: 9090 / graph .
If you click on - insert metric at cursor -, you can select one of the metrics being collected. Let's look at HTTP requests. To do this, select the http_requests_total metric and click Execute.
A list of elements and values will appear, for example:
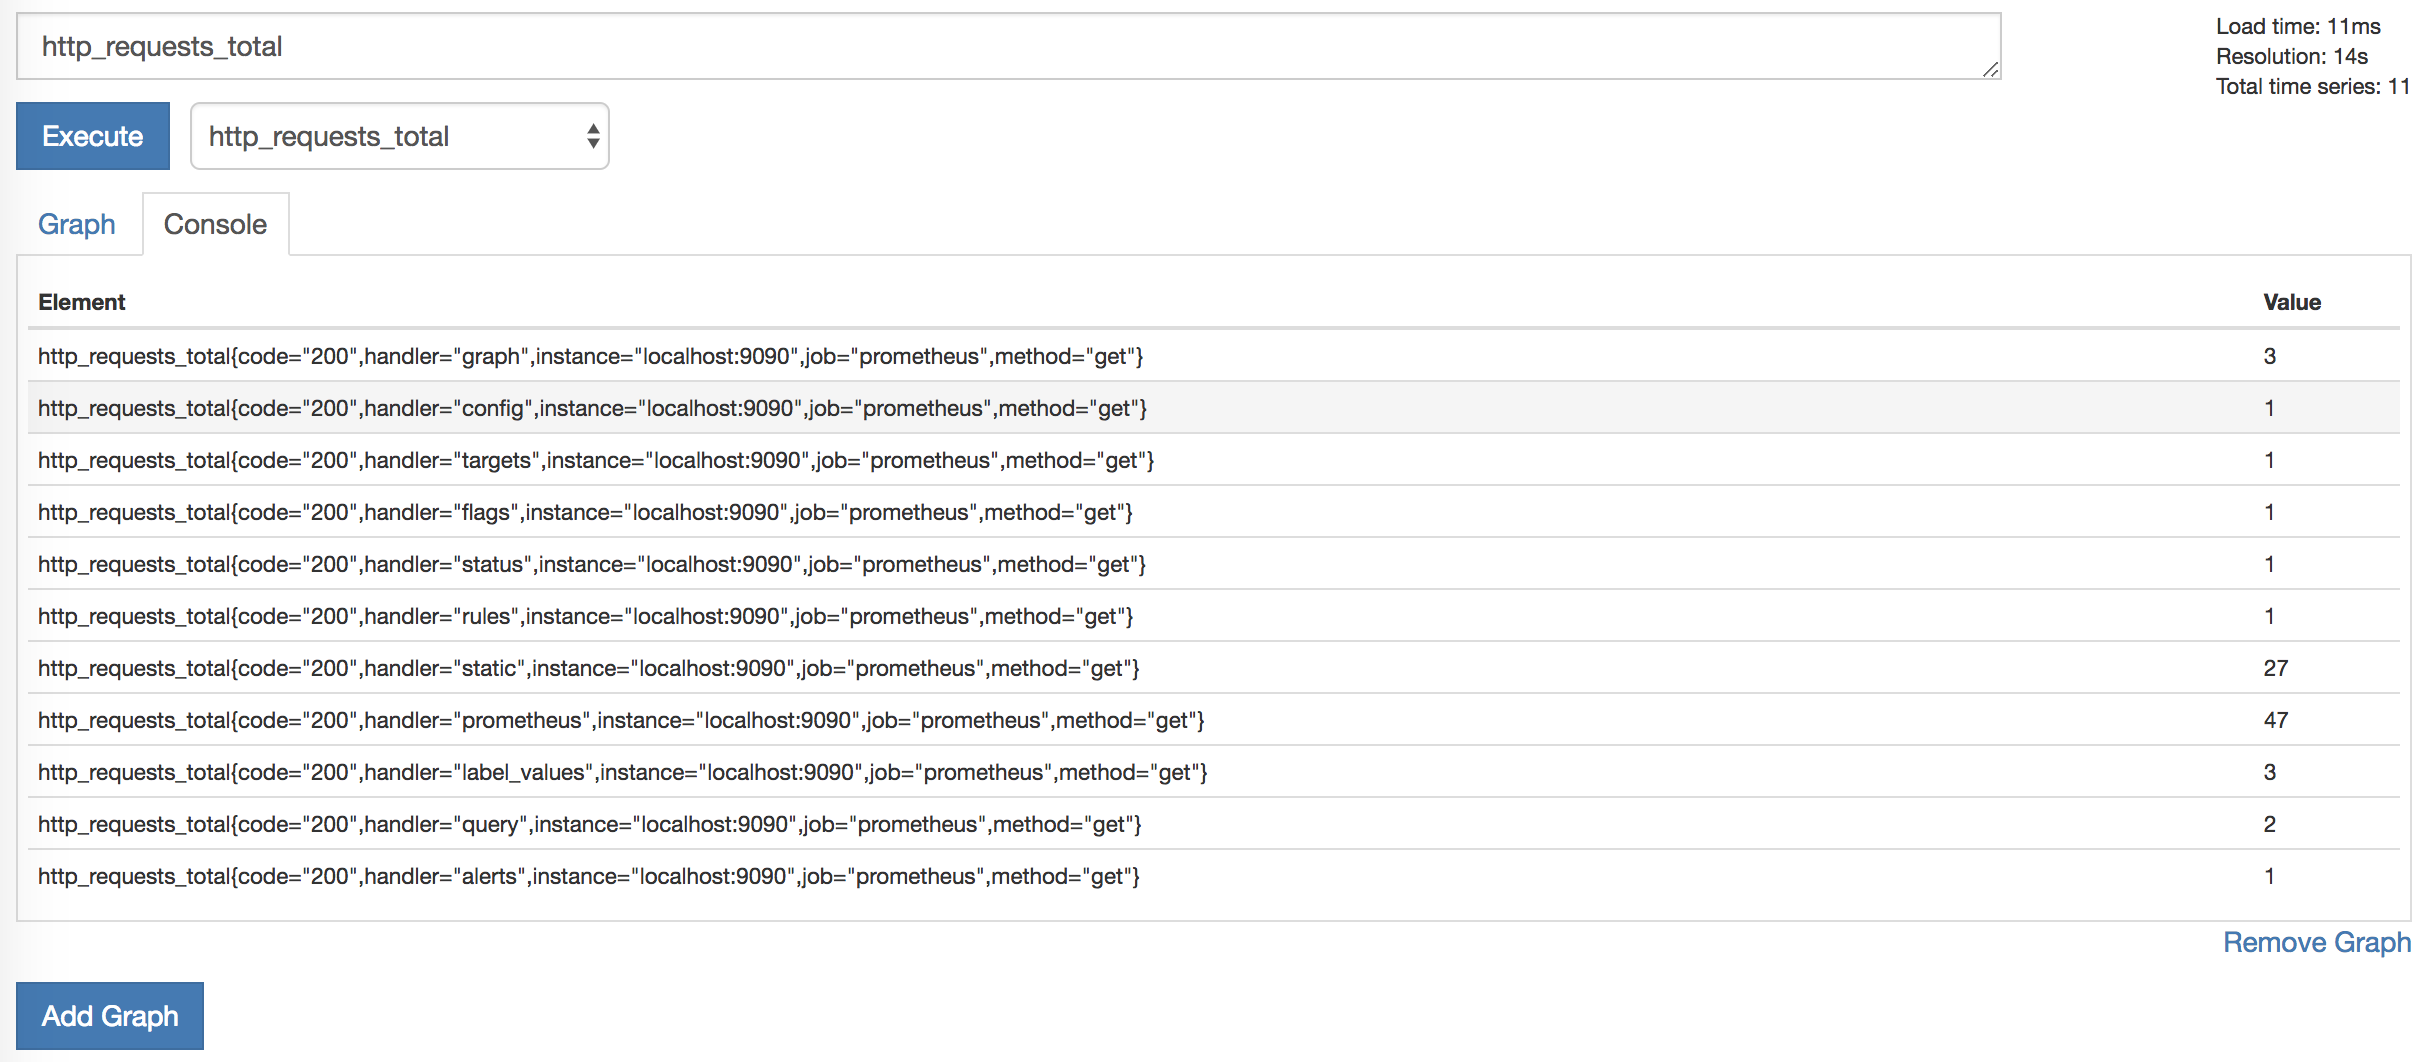
These elements are metrics that are separated by additional dimensions (they are provided by metric labels). For example, the http_requests_total metric has a handler label that contains information about the process generating the request. The list of metrics can be reduced by selecting specific metrics containing one of these labels.
The flexibility of the expression language built into the Prometheus server simplifies the search and aggregation of metrics.

We used the handler tag to select metrics only for the prometheus handler.
Additionally, we aggregate HTTP request metrics. Suppose you need to see the number of HTTP requests in five minutes, divided by tasks. To do this, we clarify the request:
Now execute the query by pressing Execute:

Additionally, you can view the graph of results by selecting the Graph tab:

On it we see the total number of HTTP requests for the last five minutes, grouped by task.
We can save these queries as record rules, ensuring that they are automatically executed and a new metric is created from this rule.
To do this, add the file to the rule_files block:
And write the following rule in the file first.rules:
This will create a new job metric: http_requests_total: sum for each job.
Now you can make a graph from the metric and add it to the dashboard.
Alertting
Warnings, like aggregation, are based on rules. To add a warning rule, you need to add another file to the rule_files block.
Create a new rule in the second.rule file, which will notify about instances falling. To do this, use one of the standard metrics for collection: up is a state metric, its value is 1 if the survey is successful, and 0 if the survey failed.
Add an alert rule to the rules file. It should look like this:
The alert rule is a bit like a conditional request. We give it the name InstanceDown and a set of rules. Alert InstanceDown is triggered when the up metric is 0 (i.e., the collection of metrics has failed) for five minutes. We added a label to the alert: severity = moderate (i.e., severity = moderate) and annotations. Annotations allow you to add more information to the alert, such as an event description. Annotations contain {{}} - brackets for templating in Go, in which variables are written. So we can customize the alert using templates . In our case, the $ labels variable contains a metric label, for example, $ labels.instance returns the instance name, $ labels.job, the name of the job, and so on.
Now, five minutes after stopping the Docker daemon, Prometheus will launch our alert and send a message to the Alertmanager dispatcher (which you must first install and launch separately, or use some other tool, for example, the Alerta tool ). Current notifications can be seen on the dashboard in the Alerts tab.
Conclusion
Prometheus is a great platform that is easy to install and configure. The configuration is described in YAML, which simplifies the use of the Infrastructure as Code (IaC) approach. Monitoring simple environments becomes painless thanks to a standalone server. Unfortunately, it was not possible to find many examples for more complex environments, so it is worth spending time on experiments and different approaches to find the most optimal way.
The data model is very flexible, particularly striking is the ease with which labels can be assigned to metrics and searched for them. I met most of the client libraries and several exporters — nothing too complex. Creating tools and generating metrics should not cause much difficulty.
The built-in interface is clean and elegant, and when combined with the query language, it looks like a suitable tool for debugging or scheduling resources. Record rules are suitable for aggregation of metrics.
I learned a little about storage, security, server discovery, and other available integrations — the possibilities look comprehensive. A quick search on GitHub showed an impressive array of tools, integrations and examples, which should be enough for a start.
The main platform has sufficient documentation, but for some related projects it is rather chaotic and incomplete. Although even with limited knowledge of Prometheus, in just an hour I managed to create a working configuration.
Distributing one binary file without initialization or packaging scripts cannot be called a solution ready to be used out of the box, but, nevertheless, it is a working solution for many projects. There are also various preparatory scripts among configuration management systems that you can use. However, most examining tools like Prometheus will most likely handle the installation themselves. Container support and Kubernetes is attractive to people using these tools. And researchers (micro) services and dynamic or cloud stacks will be interested in the autonomy and portability of the server.
If you have a project where you need to implement monitoring, I recommend Prometheus. It is also worth the time spent if your activity is related to containers and tools like Docker and Kubernetes. Due to its flexibility, it is suitable for such tools and architectures much better than other existing platforms.
PS The inspiration for this post was the article Monitoring in the time of Cloud Native, written by Cindy Sridharan. Thank you, Cindy!
THE END
We hope that it will be useful.
Prehistory
In a nutshell - an introduction to the monitoring and appeal of convictions. As many know, I accompany Riemann, an event stream processing tool for monitoring distributed systems. In my book on monitoring , I used Riemann as the main tool for exploring new approaches and monitoring patterns, and described the whitebox monitoring architecture (with selective blackbox monitoring) using the push model.
')
To understand what I am talking about at all, we will explain some concepts. Blackbox monitoring is responsible for checking the external characteristics of services or applications: whether it is possible to connect to the open port of the service, whether the correct data or the response code is returned. An example of a blackbox monitoring is an ICMP request and acknowledgment of a response.
In turn, whitebox monitoring is focused on what is happening inside the service or application. An application with appropriate tools returns the state of itself or its internal components, the result of the execution of transactions or events. This data answers the question “how the application works” and not the question “does the application work”. Whitebox monitoring transfers events, logs or metrics to a special monitoring tool or provides information outside for later collection with a monitoring tool.
Most people involved in modern monitoring, understand that in whitebox monitoring you need to invest heavily. The information obtained from the inside of the application is significantly greater value for business and operation than that obtained on the surface. This does not mean that blackbox monitoring is a waste of resources. External monitoring of services and applications is useful, especially for services that are outside of your control, or when looking from the outside gives a context that is not accessible from the inside, for example, regarding routing or DNS problems.
In the book, I focus on working with the push model, not pull. Also, a lot of attention in the book is paid to the benefits of monitoring based on the push model over the pull model. Many (if not most) monitoring systems are built precisely on the basis of a pull / polling model. In this model, the system polls the service or application that monitors. In turn, in the push model, applications and services themselves send data to the monitoring system.
For a variety of reasons (some of them are not obvious at first glance), I prefer the push model. But the features of both approaches often do not interfere with implementation for a number of reasons (for example, because of the scale). And the probability of success does not depend on disputes about the implementation or tools. I am of the opinion that the tools, first of all, should be right for you, and there is no point in mindlessly following trends or dogmatism.
It was the desire not to be categorical and the lack of understanding of community differences that inspired me to write an introductory tutorial for one of the leading monitoring tools based on a pull model: Prometheus. It is very popular, especially in the world of containers and Kubernetes.
Meet Prometheus
Prometheus was developed by Soundcloud engineers who previously worked at Google. It is written in Go, has an open source and is being developed with the support of the Cloud Native Computing Foundation . The inspiration for the project was Borgmon from Google.
Prometheus is focused on whitebox monitoring. It collects time series data from applications and services. The application provides this data on its own or through plug-ins, called exporters.
The Prometheus platform is based on a server that collects and stores time series data. It has a multi-dimensional time series model that combines metric names and key / value pairs, called metadata labels. Time series data is stored on the server, individual servers are autonomous and do not depend on distributed storage.
The platform also contains client libraries and a number of exporters for specific functions and components. For example, StatsD exporter, which converts time series StatsD data to Prometheus format. In addition, there are push gateways for receiving small amounts of incoming data and an alert manager who can handle notifications created by triggers or when thresholds of data collected by Prometheus are exceeded.
More detailed architecture can be found in the documentation Prometheus.
Installation
Prometheus server is a binary file with the same name prometheus. Take the latest version and unpack it.
$ wget https://github.com/prometheus/prometheus/releases/download/v1.8.0/prometheus-1.8.0.darwin-amd64.tar.gz $ tar -xzf prometheus-*.tar.gz $ cd prometheus-1.8.0.darwin-amd64/ The official site also contains various additional components: an alert manager for sending notifications and exporters for various services.
Customization
The binary prometheus file that we just unpacked is configured via the YAML file. Let's see what it is:
global: scrape_interval: 15s evaluation_interval: 15s external_labels: monitor: 'codelab-monitor' rule_files: # - "first.rules" # - "second.rules" scrape_configs: - job_name: 'prometheus' static_configs: - targets: ['localhost:9090'] This configuration file defines three YAML blocks:
Global
The first global block contains global settings for controlling server behavior.
scrape_interval sets the polling interval for the application or service, in our case 15 seconds. This is the resolution of the data scale, i.e. the period of time that is covered by each data point.
evaluation_interval tells Prometheus how often to process data according to the rules. There are two main types of rules: rules of writing and rules of alert. Write rules allow you to pre-compute frequently used and resource-intensive expressions and save the result as new time series data. Alert rules allow you to define alert conditions. Prometheus will (re-) check these conditions every 15 seconds.
External_labels contains a list of key / value pairs for tags that will be added to any metric that exists on the server, for example, when generating a warning.
Rule files
The second block, rule_files, contains a list of files with the rules of recording or alert.
Survey Configuration
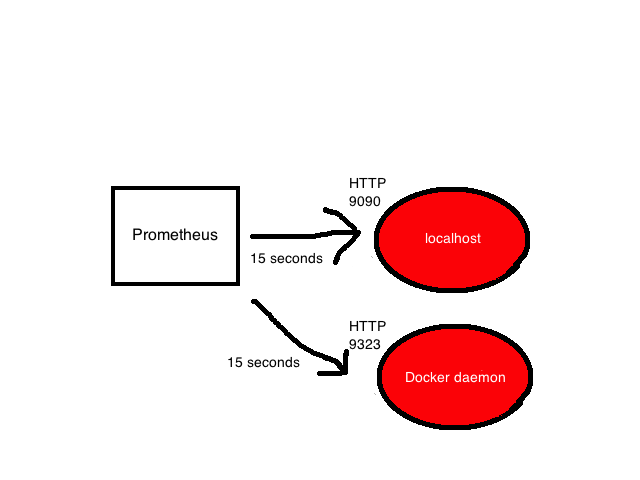
The last scrape_configs block shows all the targets that Prometheus will poll. Prometheus calls targets instances, and groups of instans calls jobs. By default, there is only one task - prometheus. Inside it is a static_config with a list of instances (by default only one is the Prometheus server). He polls the localhost port 9090 to get the state metrics of the server itself. It is assumed that the metrics are in / metrics, so the localhost: 9090 / metrics address is locally polled. The path can be changed using the metric_path option.
The lonely task is pretty boring, so let's add one more to poll the local Docker daemon. Use the instructions in the Docker documentation and configure the daemon to give the metrics from the address localhost: 9323 / metrics. And after that, add another task called docker.
- job_name: 'docker' static_configs: - targets: ['localhost:9323'] The job has a name and an instance that refers to the address to get the Docker daemon metrics. The default path is again / metrics.
The full configuration file can be found by reference .
Server startup
Run the server and see what happens.
$ ./prometheus -config.file "prometheus.yml" Run the binary file and specify the configuration file in the command line flag -config.file. The Prometheus server is now running, polls the instances in the prometheus and docker tasks and returns the results.
Dashboard
Prometheus has a built-in interface where you can see the results. To do this, open in the browser http: // localhost: 9090 / graph .
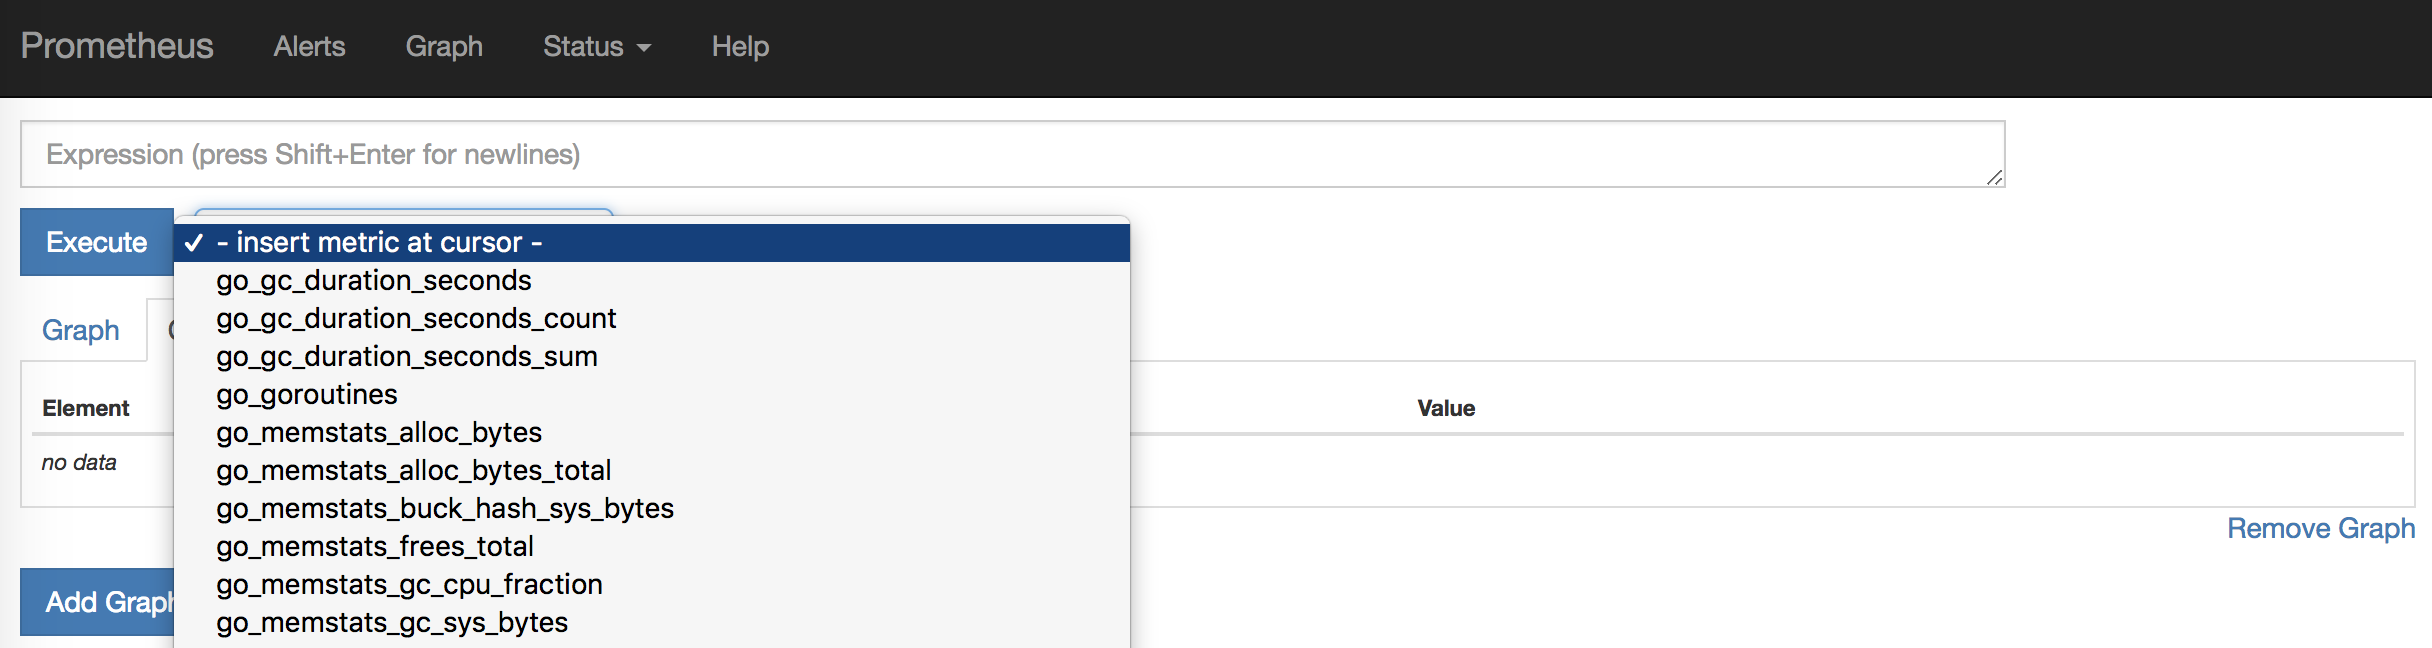
If you click on - insert metric at cursor -, you can select one of the metrics being collected. Let's look at HTTP requests. To do this, select the http_requests_total metric and click Execute.
A list of elements and values will appear, for example:
http_requests_total{code="200",handler="prometheus",instance="localhost:9090",job="prometheus",method="get"} These elements are metrics that are separated by additional dimensions (they are provided by metric labels). For example, the http_requests_total metric has a handler label that contains information about the process generating the request. The list of metrics can be reduced by selecting specific metrics containing one of these labels.
The flexibility of the expression language built into the Prometheus server simplifies the search and aggregation of metrics.
We used the handler tag to select metrics only for the prometheus handler.
Additionally, we aggregate HTTP request metrics. Suppose you need to see the number of HTTP requests in five minutes, divided by tasks. To do this, we clarify the request:
sum(rate(http_requests_total[5m])) by (job) Now execute the query by pressing Execute:
Additionally, you can view the graph of results by selecting the Graph tab:
On it we see the total number of HTTP requests for the last five minutes, grouped by task.
We can save these queries as record rules, ensuring that they are automatically executed and a new metric is created from this rule.
To do this, add the file to the rule_files block:
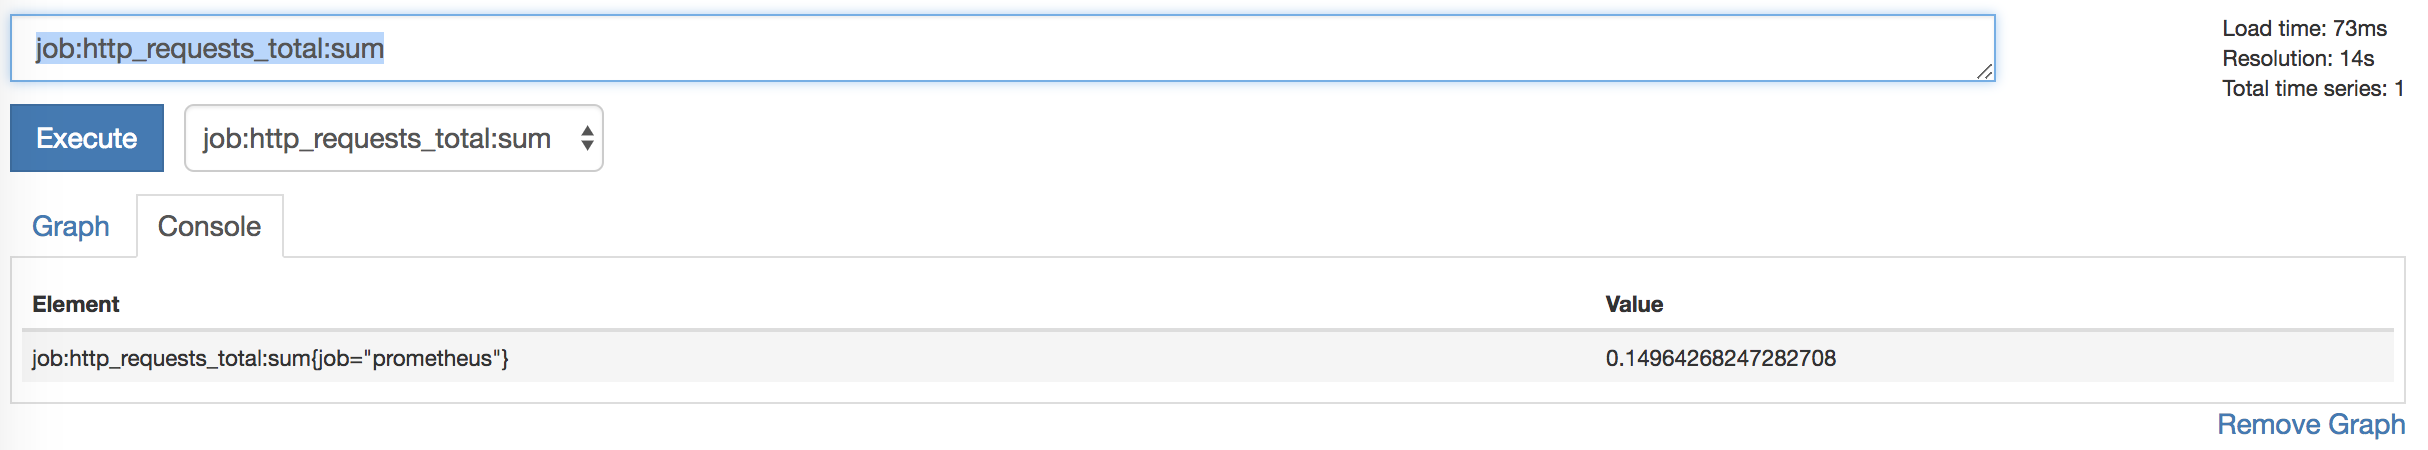
rule_files: - "first.rules" # - "second.rules" And write the following rule in the file first.rules:
job:http_requests_total:sum = sum(rate(http_requests_total[5m])) by (job) This will create a new job metric: http_requests_total: sum for each job.
Now you can make a graph from the metric and add it to the dashboard.
Alertting
Warnings, like aggregation, are based on rules. To add a warning rule, you need to add another file to the rule_files block.
rule_files: - "first.rules" - "second.rules" Create a new rule in the second.rule file, which will notify about instances falling. To do this, use one of the standard metrics for collection: up is a state metric, its value is 1 if the survey is successful, and 0 if the survey failed.
Add an alert rule to the rules file. It should look like this:
ALERT InstanceDown IF up == 0 FOR 5m LABELS { severity = "moderate" } ANNOTATIONS { summary = "Instance {{ $labels.instance }} down", description = "{{ $labels.instance }} of job {{ $labels.job }} has been down for more than 5 minutes.", } The alert rule is a bit like a conditional request. We give it the name InstanceDown and a set of rules. Alert InstanceDown is triggered when the up metric is 0 (i.e., the collection of metrics has failed) for five minutes. We added a label to the alert: severity = moderate (i.e., severity = moderate) and annotations. Annotations allow you to add more information to the alert, such as an event description. Annotations contain {{}} - brackets for templating in Go, in which variables are written. So we can customize the alert using templates . In our case, the $ labels variable contains a metric label, for example, $ labels.instance returns the instance name, $ labels.job, the name of the job, and so on.
Now, five minutes after stopping the Docker daemon, Prometheus will launch our alert and send a message to the Alertmanager dispatcher (which you must first install and launch separately, or use some other tool, for example, the Alerta tool ). Current notifications can be seen on the dashboard in the Alerts tab.
Conclusion
Prometheus is a great platform that is easy to install and configure. The configuration is described in YAML, which simplifies the use of the Infrastructure as Code (IaC) approach. Monitoring simple environments becomes painless thanks to a standalone server. Unfortunately, it was not possible to find many examples for more complex environments, so it is worth spending time on experiments and different approaches to find the most optimal way.
The data model is very flexible, particularly striking is the ease with which labels can be assigned to metrics and searched for them. I met most of the client libraries and several exporters — nothing too complex. Creating tools and generating metrics should not cause much difficulty.
The built-in interface is clean and elegant, and when combined with the query language, it looks like a suitable tool for debugging or scheduling resources. Record rules are suitable for aggregation of metrics.
I learned a little about storage, security, server discovery, and other available integrations — the possibilities look comprehensive. A quick search on GitHub showed an impressive array of tools, integrations and examples, which should be enough for a start.
The main platform has sufficient documentation, but for some related projects it is rather chaotic and incomplete. Although even with limited knowledge of Prometheus, in just an hour I managed to create a working configuration.
Distributing one binary file without initialization or packaging scripts cannot be called a solution ready to be used out of the box, but, nevertheless, it is a working solution for many projects. There are also various preparatory scripts among configuration management systems that you can use. However, most examining tools like Prometheus will most likely handle the installation themselves. Container support and Kubernetes is attractive to people using these tools. And researchers (micro) services and dynamic or cloud stacks will be interested in the autonomy and portability of the server.
If you have a project where you need to implement monitoring, I recommend Prometheus. It is also worth the time spent if your activity is related to containers and tools like Docker and Kubernetes. Due to its flexibility, it is suitable for such tools and architectures much better than other existing platforms.
PS The inspiration for this post was the article Monitoring in the time of Cloud Native, written by Cindy Sridharan. Thank you, Cindy!
THE END
We hope that it will be useful.
Source: https://habr.com/ru/post/341862/
All Articles