Prediction of connections in social networks: use transition points
Current research in the field of predictive network modeling uses various metrics that are indicators of the formation of connections between agents — however, they ignore the distribution of the emergence of new connections in the network.
In this article, I will discuss how to apply change points to the Link Prediction Problem solution, using the example of the Flickr network .

So in statistics is called the point at which there is a change in the distribution of a certain value. When it comes to a social network, one of the processes in which you can define transition points is the process of the emergence of new connections in time in a dynamic network. In order to determine these points, you can use one of the following metrics: graph density , average betweenness centrality, or average closeness centrality .
Let's briefly explain the essence of these three metrics. Let's start with the simplest - density graph . If at some point in time there is a sharp change in the dynamics of the density of the graph, then this is probably due to a change in the distribution of the number of new bonds as a function of time.
If we talk about metrics of centrality, then betweenness centrality is a measure of how often the shortest paths pass through a given vertex, and closeness centrality acts as a measure of how quickly you can get from a given vertex of the graph to all others.
')
The article by McCulloh, Matthew Webb, and John Graham, “Change detection in social networks,” conducted a study of the international terrorist network Al-Qaeda (links between members of the group) over a period of several years. The figure below shows the characteristics of the network at various discrete points in time.
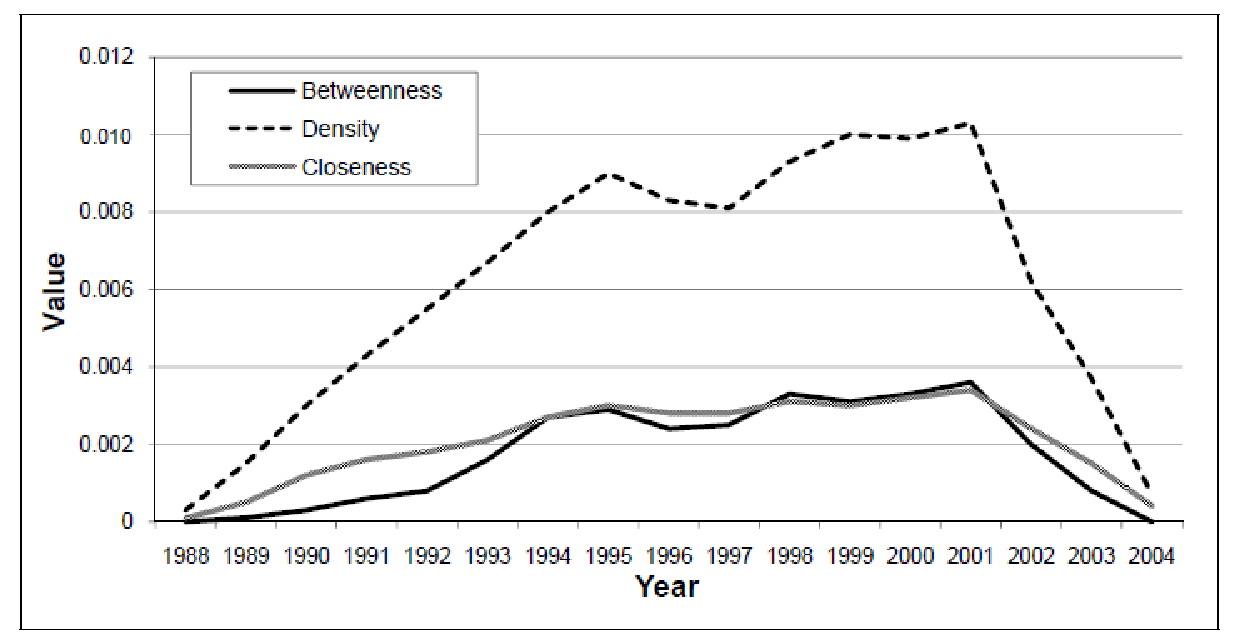
Obviously, the expected change in distribution after 2001 is observed. This is confirmed empirically, since after the September 11, 2001 terrorist attack, Al-Qaeda was taken under tight control by the world’s special services and the organization’s activities became more difficult (however, the growth in the number of connections between network participants slowed down significantly). We obtain that the above metrics are theoretically suitable for identifying transition points in social networks.
Let's try to predict the dynamics of links on the Flickr network. As metrics, we choose the Jacquard coefficient (neighborhood method), the sum of local clustering coefficients (metric based on the properties of the vertices), the values of the three main measures of node centrality (for each pair of vertices, the degree degree centrality, the sum of closeness centrality and the sum between between centrality) and the value of the shortest the distances between the vertices, taken with a minus sign.
Suppose the dependence of the probability of connecting a pair of vertices at the next time point not only from the value of the metrics at the previous time point, but also at times with some time lag. This choice is explained by the fact that if there is an increase in the indicator of a particular classifier over time, it means that at each next step the probability of two vertices to be connected increases.
Separately, we note the inclusion of indicators responsible for the identification of transition points in the network. The choice is made in favor of absolute values of density, average betweenness centrality and average closeness centrality, since using Random Forest , for example, within a single tree, the threshold value of one of the listed (or several) predictors will automatically determine the moment of distribution of the network.
As the target variable, we select the Link indicator - the presence or absence of a connection between a pair of selected vertices (1 - for the vertices connected by an edge, 0 - otherwise). The solution of the two-class classification problem by the Random Forest method gave the following results on a test sample:

In our case, not just the problem of binary classification into equal classes of importance is solved, but the division into “negative” and “positive” classes occurs - so we can use the AUC metric to determine the quality of the model. With the indicator AUC = 0.88, we can conclude that the quality of the constructed model is high.
For the purpose of a meaningful interpretation of the predictors, we construct a graph of the dynamics of the Gini index decrease with respect to independent variables:
In general, the significance of the indicators of transition points indicates that during training in the leaves of the decision tree, the sample is divided into graphs of different time intervals, due to which further model building in each of the branches occurs with different threshold values for the same predictors. Thus, the introduction of the transition point metric contributes to a more accurate prediction of classes.
In this article, I will discuss how to apply change points to the Link Prediction Problem solution, using the example of the Flickr network .
Transition Points: Theory and Practice
So in statistics is called the point at which there is a change in the distribution of a certain value. When it comes to a social network, one of the processes in which you can define transition points is the process of the emergence of new connections in time in a dynamic network. In order to determine these points, you can use one of the following metrics: graph density , average betweenness centrality, or average closeness centrality .
Let's briefly explain the essence of these three metrics. Let's start with the simplest - density graph . If at some point in time there is a sharp change in the dynamics of the density of the graph, then this is probably due to a change in the distribution of the number of new bonds as a function of time.
If we talk about metrics of centrality, then betweenness centrality is a measure of how often the shortest paths pass through a given vertex, and closeness centrality acts as a measure of how quickly you can get from a given vertex of the graph to all others.
')
The article by McCulloh, Matthew Webb, and John Graham, “Change detection in social networks,” conducted a study of the international terrorist network Al-Qaeda (links between members of the group) over a period of several years. The figure below shows the characteristics of the network at various discrete points in time.
Obviously, the expected change in distribution after 2001 is observed. This is confirmed empirically, since after the September 11, 2001 terrorist attack, Al-Qaeda was taken under tight control by the world’s special services and the organization’s activities became more difficult (however, the growth in the number of connections between network participants slowed down significantly). We obtain that the above metrics are theoretically suitable for identifying transition points in social networks.
Experiment with the Flickr network
Let's try to predict the dynamics of links on the Flickr network. As metrics, we choose the Jacquard coefficient (neighborhood method), the sum of local clustering coefficients (metric based on the properties of the vertices), the values of the three main measures of node centrality (for each pair of vertices, the degree degree centrality, the sum of closeness centrality and the sum between between centrality) and the value of the shortest the distances between the vertices, taken with a minus sign.
Suppose the dependence of the probability of connecting a pair of vertices at the next time point not only from the value of the metrics at the previous time point, but also at times with some time lag. This choice is explained by the fact that if there is an increase in the indicator of a particular classifier over time, it means that at each next step the probability of two vertices to be connected increases.
Separately, we note the inclusion of indicators responsible for the identification of transition points in the network. The choice is made in favor of absolute values of density, average betweenness centrality and average closeness centrality, since using Random Forest , for example, within a single tree, the threshold value of one of the listed (or several) predictors will automatically determine the moment of distribution of the network.
As the target variable, we select the Link indicator - the presence or absence of a connection between a pair of selected vertices (1 - for the vertices connected by an edge, 0 - otherwise). The solution of the two-class classification problem by the Random Forest method gave the following results on a test sample:
In our case, not just the problem of binary classification into equal classes of importance is solved, but the division into “negative” and “positive” classes occurs - so we can use the AUC metric to determine the quality of the model. With the indicator AUC = 0.88, we can conclude that the quality of the constructed model is high.
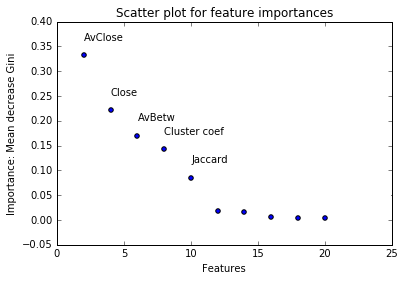
For the purpose of a meaningful interpretation of the predictors, we construct a graph of the dynamics of the Gini index decrease with respect to independent variables:
findings
- AvClose and Close turned out to be the two most significant indicators (measures of how quickly you can get from a given vertex to all the others) => these variables are able to predict exactly future, not real connections
- in the top three, by significance, there are two indicators, which were calculated not on the basis of individual peculiarities of the vertices, but on the basis of indicators on the whole graph
- the importance of medium closeness and between centrality betweenness suggests that the hypothesis of the transition points is confirmed
In general, the significance of the indicators of transition points indicates that during training in the leaves of the decision tree, the sample is divided into graphs of different time intervals, due to which further model building in each of the branches occurs with different threshold values for the same predictors. Thus, the introduction of the transition point metric contributes to a more accurate prediction of classes.
Source: https://habr.com/ru/post/341718/
All Articles