Cyber oracle: search for anomalies in monitoring data using a neural network
The amount of data that our monitoring receives has grown so much that only the human mind is not enough for processing them. Therefore, we have trained artificial intelligence to help us look for anomalies in the data obtained. And now we have a Cyber-Oracle.

1. Problem statement and motivation
Hello, my name is Ivan Khozyainov, I work at ITSumma. The company is engaged in the support and administration of a large number of sites, the main task is to quickly respond to incidents and prevent them. To do this, we have a staff of duty administrators and a monitoring system that collects important indicators from servers and stores this data into a common database.
The monitoring system sends an alert when the limit value of one of the important parameters is reached. What parameters should be considered important and which values will be the limit for them by the system administrators on duty when setting up monitoring. But there is obviously a strange behavior that passes by the monitoring system, because the limit values have not been reached.

Fig.1 Monitoring system
To notice such anomalies, it is necessary to constantly look through a huge amount of data, the physical capabilities of a person for this are simply not enough. Therefore, always vigorous computer hardware and mathematics come to the rescue. I want to tell you about the problem of searching for anomalies in the accumulated array of data about the life of servers.
2. Background
The task of finding anomalies is quite common and it is intuitive: we are looking for something unusual among the data. The topic excites consciousness, so it is logical that there are commercial products that do this, for example http://anomaly.io and http://grokstream.com .
But back to the task itself. We assume that the data is represented by a set of measurements and each measurement is represented by a set of parameters, for example, the current Load Average readings for the CPU, HDD Free Space, etc. From the point of view of mathematics, this can be represented as a vector function:
Where t is time, and n is the number of measured parameters.
There are many articles on mathematical formalization and approaches to its solution. The review article [1] provides a classification for the types of anomalies:
- point - this is when a specific dimension is knocked out of the big picture: the so-called overshoot or outlier
- collective - when the totality of measurements is abnormal with respect to the entire data set, even when each measurement is not out of the general picture: for example, a cardiogram, where a collective anomaly is highlighted with red due to arrhythmia (Fig. 2)

Fig. 2. Anomaly on the cardiogram - contextual - in this case, the anomaly is determined according to the context: for example, low winter temperatures are normal, but in summer this will be an anomaly (Fig. 3). Although, depending on where, it depends on the context.

Fig. 3. Seasonality can set the context: t2 is an anomaly, and t1 is not
Finding a point anomaly often comes down to finding the expectation and standard deviation, and then everything that breaks out beyond a certain threshold after the standard deviation is considered an anomaly. But things get interesting with contextual and collective anomalies.
Seasonality ( English Seasonality) and trends are most often used as a context for time series. For filtering seasonality, the Holt-Winter exponential smoothing [2] [3] can be used. But for now, we will not touch upon this context, as well as trends. Also, as a context, additional data can act like logs on the server [4] . For the time being, we will not touch this either, but let us look at the possibility of finding collective anomalies, such as vibrations and peaks. Among the publications you can find tips on the use of neural networks [3] and specific architectures when searching for anomalies in the time series [5] . Let's try to take into account the recommendations as much as possible, although the rake will still be expected.
3. Selection of tools
The first thing we need is the choice of software and mathematical tools. As a mathematical tool, we will use naive formulas for detecting strong oscillations on a graph, such as this:
At the ideological level, this means the sum of all possible variations for a certain period of time.
Since our function is discrete, the formula accordingly will look something like this:
Now you can determine the threshold and it will be a ready-made detector of any bursts. But we will not determine independently, but we will charge this to the neural network.
Python was chosen as the prototyping language for Yandex’s Clickhouse database server with quite convenient use of it from Python . To work with neural networks, the Tensorflow framework from Google was chosen. We will count everything on two Nvidia GTX1080 GPUs, spending precious power not on mining, but on real research tasks.
From the point of view of mathematics, a neural network is a function:
where Y is the answer to the question, and X is the input. The function is rather complicated, but it can be trained, for example, by the method of back propagation of an error .
4. Data preparation
Recently, a good article was published on Habré on the topic of neural networks, where a separate preprocessing item was highlighted. I would like to add that in addition to normalizing the data, at this stage you can also attend to the completion of data (for example, interpolation) so that there are no gaps. In an ideal world, measurements should come from the servers and be written to the database every 15 seconds, but in the real world, some metrics for various reasons may not reach or reach at the wrong time, so you need to somehow fill this missing information with various assumptions. For example, we want to know the change in the Load Average parameter for the CPU, and in the database it will look conditional like this:
| Time | 0:13 | 0:14 | 0:47 | 1:53 | Two o'clock |
| Load average | 1.73 | 1.8 | 1.6 | 1.5 | 1.48 |
Imagine that every 15 seconds is one unit of time t. Then, if you make a simple enough filling of the array, then everything will look like this:
| t | one | 2 | 3 | four | five |
| x (t) | 1.8 | - | - | 1.5 | 1.48 |
Of course, you can build a linear interpolation, but then the time of preliminary data processing can grow many times (not to mention more complex methods), which is critical for large amounts of data. Even a seemingly simple addition with such assumptions can also slow down the process of data preparation:
| t | one | 2 | 3 | four | five |
| x (t) | 1.8 | 1.7 | 1.6 | 1.5 | 1.48 |
Therefore, in the final version, the dumbest possible method was chosen (it’s also the fastest) - if the value is omitted, then we take the nearest previous one:
| t | one | 2 | 3 | four | five |
| x (t) | 1.8 | 1.8 | 1.8 | 1.5 | 1.48 |
So, we have some function and we can begin to form tensors for learning. From the point of view of the python program, tensors are simply multi-dimensional arrays.
5. What was done first and how not to do
According to one of Clark's laws: "Any sufficiently advanced technology is indistinguishable from magic." And given that the neural network is quite difficult to understand due to its objective structural complexity and is capable of incredible things, you can begin to feel some reverence for this tool and make rash actions.
From the very beginning, I wanted to try to train a neural network on all existing data, dividing something like this: 90% for data that we will consider normal. And 10% of the data is just to check - suddenly there will be something abnormal. Well, and vice versa, choose the most boring server life of 10%, where nothing happens and after learning check on the remaining 90% of the data.
I wanted to believe that if you make enough layers and drive all the data into it, she will select the contexts and everything will be able, if brute force goes through a sufficient number of architectures. But first, let's try how it works on simple functions like sine-cosines with small changes.
The input to the neural network was a set of data on a logarithmic scale or, more simply, this: the current reading, 15 seconds ago, a minute ago, five minutes ago, half an hour, and so on up to a week. It seemed that it would help to identify seasonality. After a little success on a simple sine wave, it's time for prototypes.
To make it easier to write prototypes, a tflearn framework based on tensorflow was used. As it turned out, it’s more difficult to distribute tasks between GPUs and this can be done only through environment variables ( https://github.com/tflearn/tflearn/issues/32 ), unlike tensorflow, where you can count part of tasks on one GPU, part - on another within the same program.
So, for each server - its own neural network for training. After a chaotic search of architectures from the framework, it became clear that a terabyte hard drive on a machine with neurons is not enough.
The neural network for each server took more than 100 MB and was trained for an average of 40 minutes, not counting the preliminary training, which also took time. The data set for training after all the pre-processing took about 5-6 GB.
Of course, it was nice to look at the console and see how something is happening there. There was a belief in the magic power of this black box: suddenly it will be possible for bruteforce to pick up the magical parameters of the network, without delving into what is happening. As you might guess, this approach was unsuccessful.
6. What is working now and which path is most likely the right one
Let's start with simple architectures and multilayer perceptron . We assume that we have a classification task and there are two classes - “anomaly” and “not anomaly”. Accordingly, we need training data that we need to prepare ourselves. This approach is described in [1] and we need to prepare data sets with “labels” . The logarithmic scale was removed and just a 25-minute time interval (100 measurements) + the S value from formula (1) began to be input.
The graph of the function on which the training was carried out is presented in Fig. 4. On the graph, the data is not normalized, but the training was done on normalized. By the way, free memory on one of the servers is presented here - this is something that changes quite often.
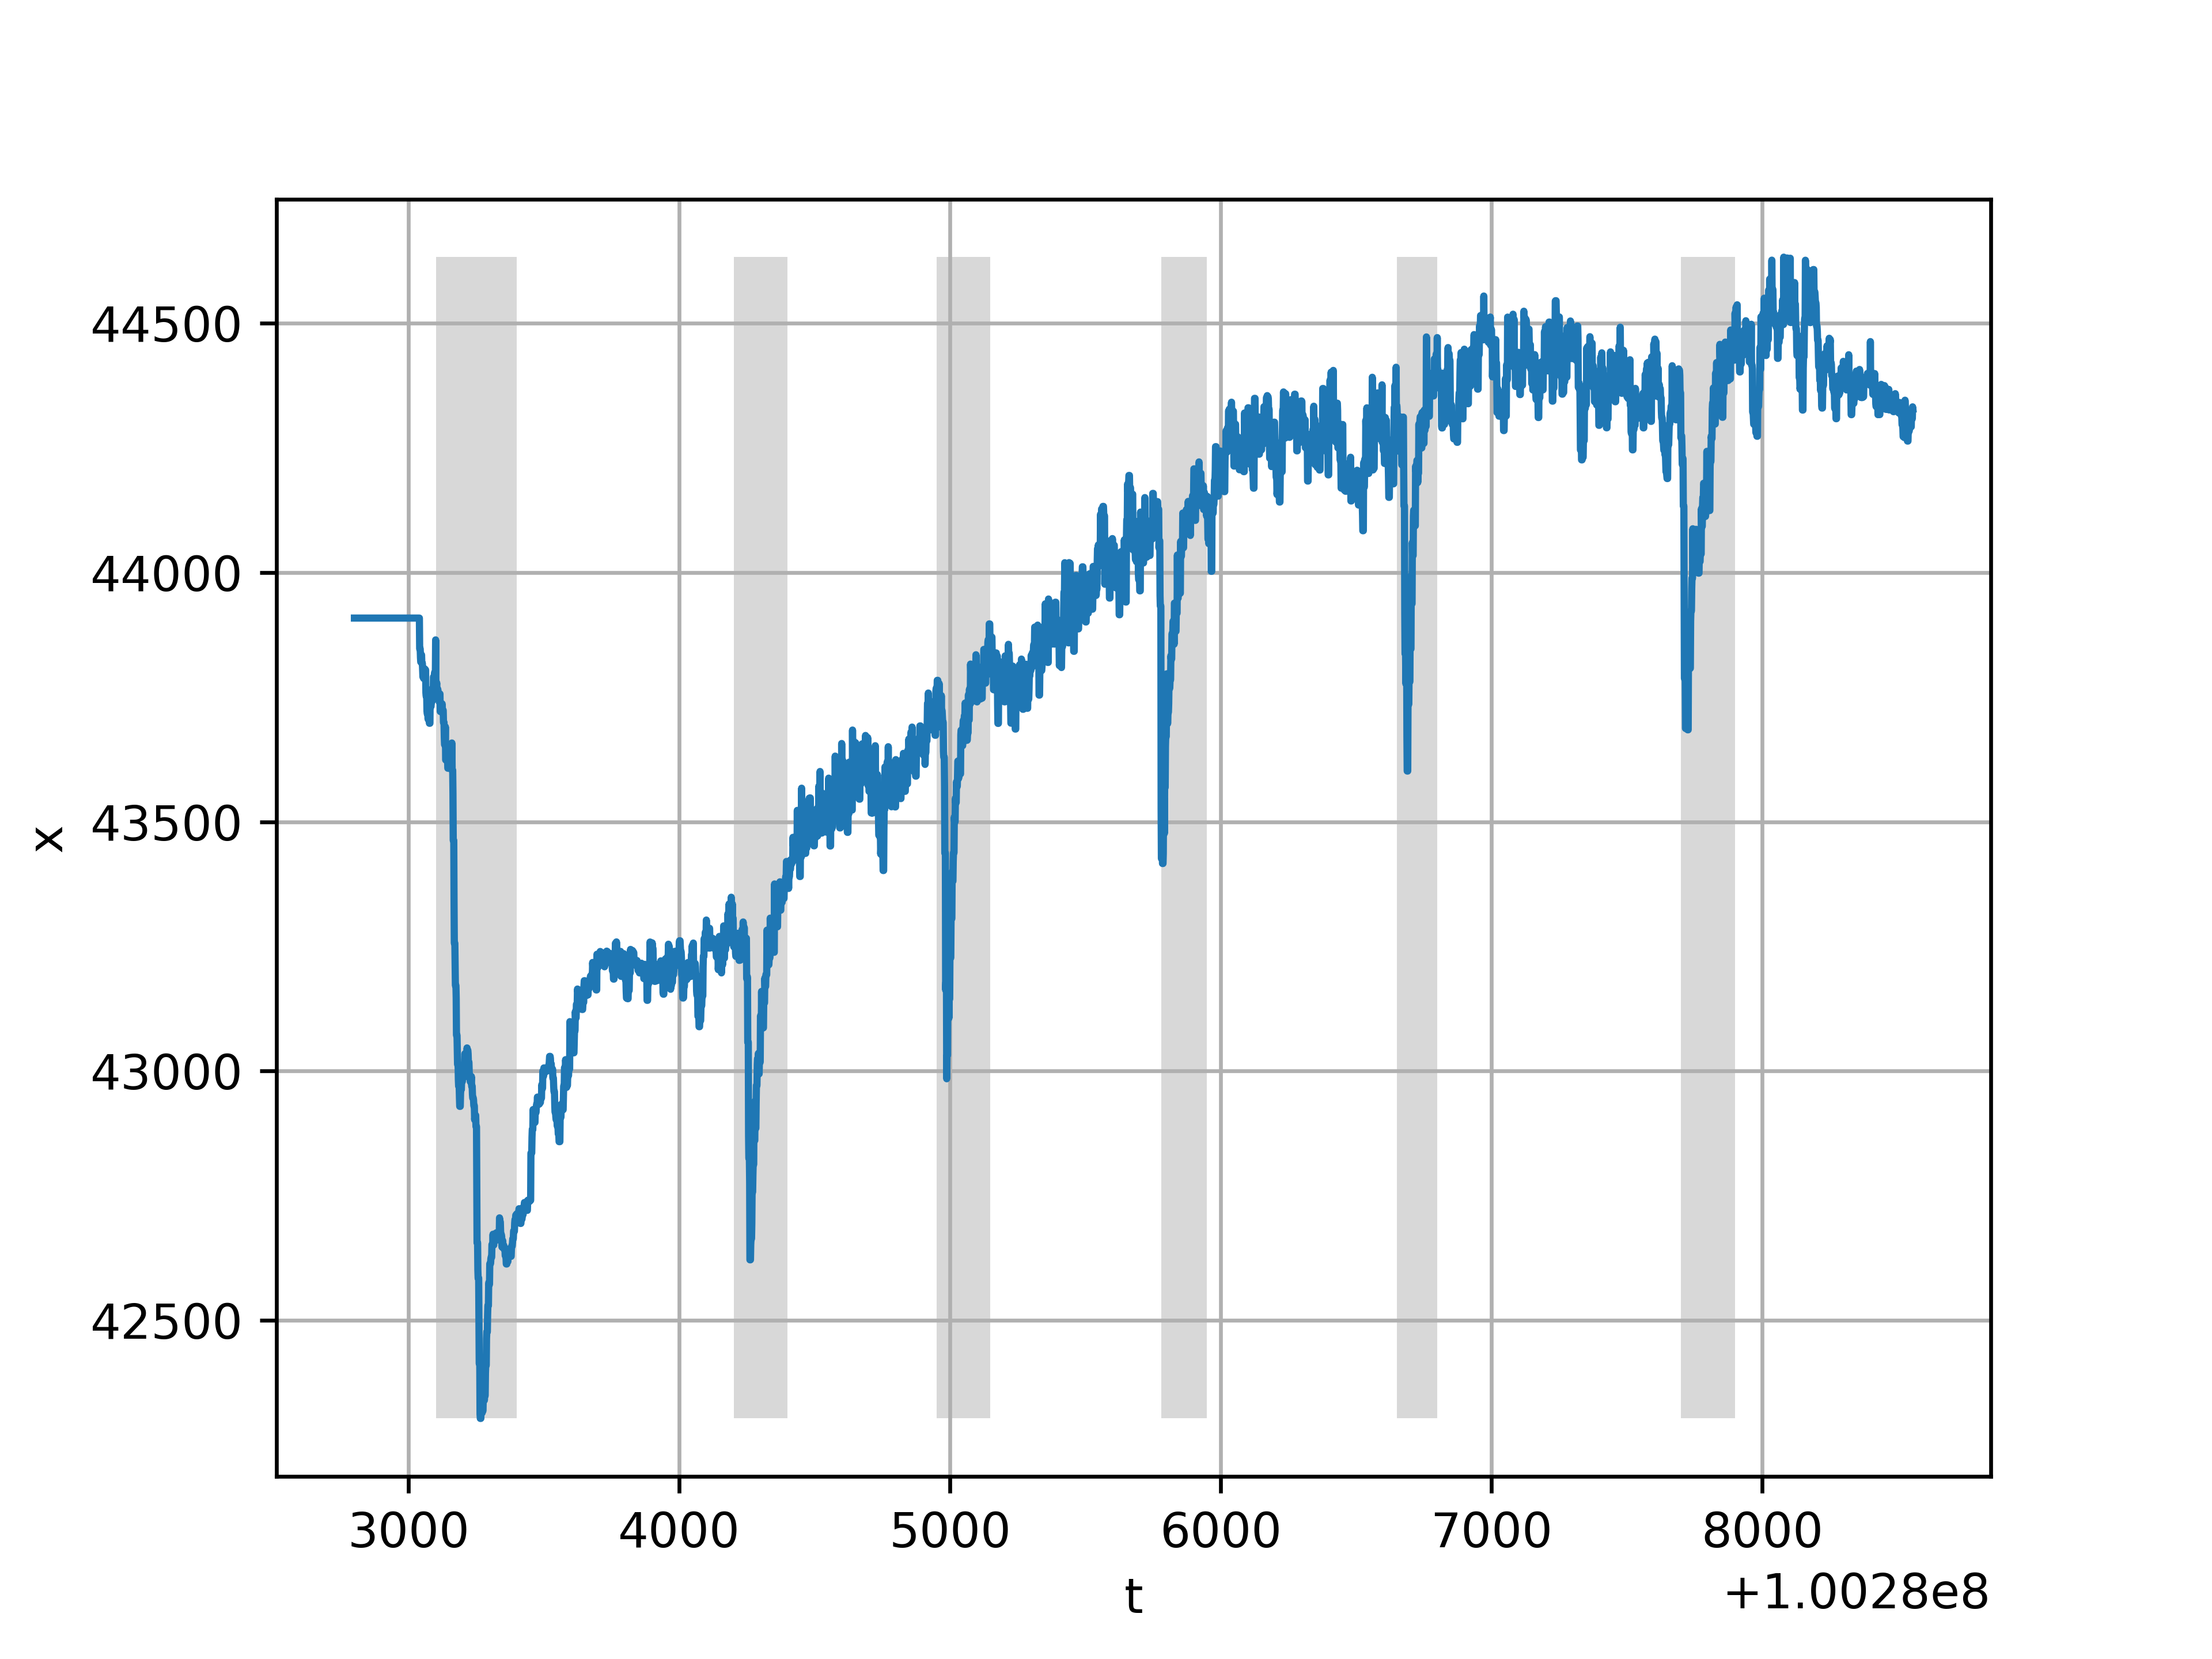
Fig. 4. Teaching with a teacher, gray highlighted anomalies
We have an input layer, there will be 101 neurons, on the first hidden layer - 55 neurons, on the second hidden layer - 1024, on the output - the class “anomaly”, “not anomaly”. The network architecture was chosen, it may be said, by chance, therefore the best option is probably possible.

Figure 5. Learning perceptron with two hidden layers
The network was trained by Adam's stochastic gradient descent with the parameter learning_rate = 0.00005, the remaining parameters are left by default. As a measure, the cross entropy between the output of the neural network and the training set was chosen, the activation function is sigmoid or the logistic function. Since there are two hidden layers, it can already be said deep learning.
Search for anomalies using a trained network on the same server, but for a longer period of time - in two days, it is clear that it is necessary to get rid of seasonality (Fig. 6).

Figure 6. The result of the neural network - the schedule in the middle, the bottom - the input, the top - the interpretation of the non-normalized data
It is interesting to check how a trained neural network on one parameter (free memory) will cope with another (load average) on a completely different server. The result can be seen in the picture. Due to the fact that the data are normalized, it can be seen that the “anomalies” are on a different scale (Fig. 7).
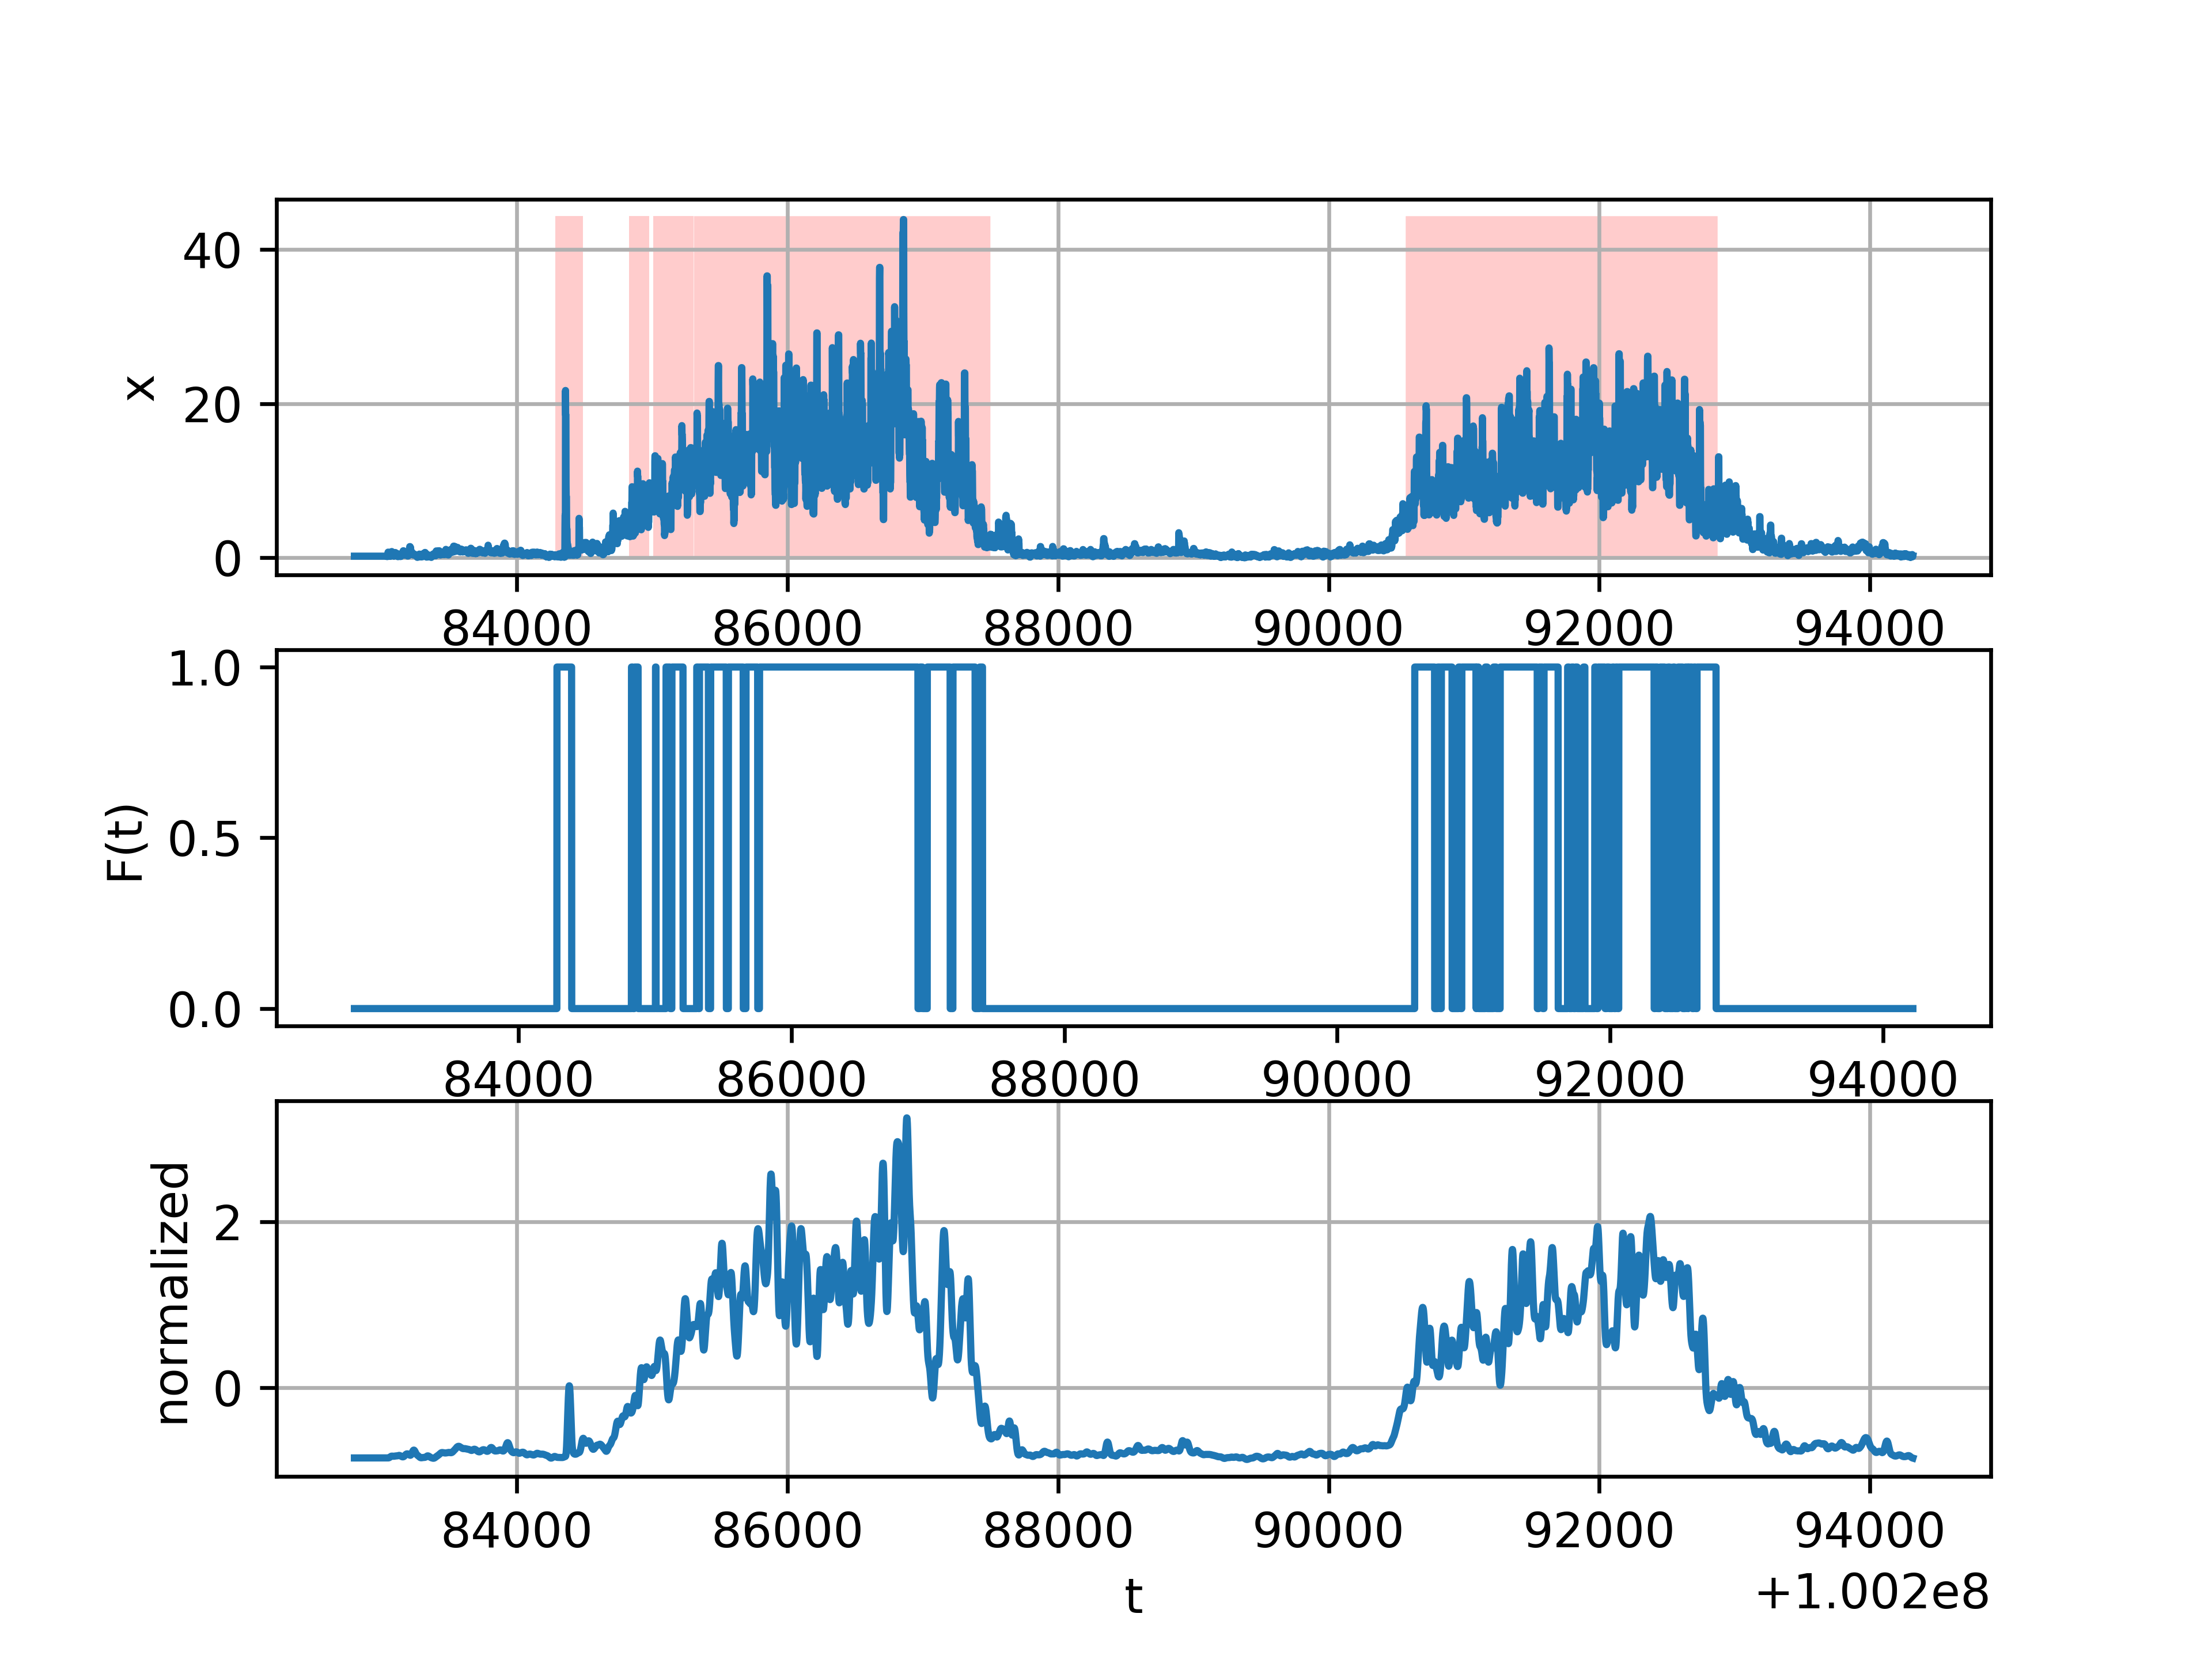
Fig. 7. The result of the neural network on another data set
7. Conclusions
The neural networks manifested themselves in the most efficient way after suitable data preparation. Actually, in [3] it is mentioned that “machine learning is a meta-tool that can be used on top of other tools for working with data”. I hope someone this experience will be useful. Thanks for reading, I will be glad to comment.
Literature
[1] http://cucis.ece.northwestern.edu/projects/DMS/publications/AnomalyDetection.pdf - Varun Chandola, Arindam Banerjee, and Vipin Kumar. 2009. Anomaly detection: A survey. ACM Comput. Surv. 41, 3, Article 15 (July 2009), 58 pages.
[2] http://www.imvu.com/technology/anomalous-behavior.pdf Evan Miller. 2007. Business Critical Metrics (DRAFT)
[3] http://www.oreilly.com/webops-perf/free/files/anomaly-detection-monitoring.pdf
Preetam Jinka & Baron Schwartz. 2015. Anomaly detection for monitoring: A statistical approach to time series anomaly detection. O'Reilly.
[4] https: //wwLw.microsoft.com/en-us/research/publication/context-aware-time-series-anomaly-detection-for-complex-systems/ Gupta M., Sharma AB, Chen H., Jiang G. 2013 Context-Aware Time Series Anomaly Detection for Complex Systems. Proceedings of the SDM Workshop.
[5] https://www.elen.ucl.ac.be/Proceedings/esann/esannpdf/es2015-56.pdf Pankaj Malhotra, Lovekesh Vig, Gautam Shroff, Puneet Agarwal. Long Short Term Memory Networks for Anomaly Detection in Time Series. ESANN 2015 Proceedings.
Links
https://clickhouse.yandex/ - a database convenient for storing and working with large volumes of similar data
https://github.com/Infinidat/infi.clickhouse_orm - python library to work with clickhouse
http://tensorflow.org/ - Google's open source library for working with neural networks
http://tflearn.org is a convenient framework for working with tensorflow
http://anomaly.io , http://grokstream.com - products that deal with the detection of anomalies
')
Source: https://habr.com/ru/post/341598/
All Articles