How do we make a map for those who make a map

Products 2GIS use 30 million citizens. To get a huge data set to the end user, we use a variety of internal products, which are very rarely told.
Once on Habré there was already an article about our domestic product - vector geometry editor . The wonders of naming led us to three points - Fiji. Before them, the project was called “New card” → “New card” → “New new card”. Three years ago, we started implementing Fiji and talked about UI prototyping, today we’ll dive into the technical details and tell you how to create a fast and reliable GIS editor.
Cartographers and their requests
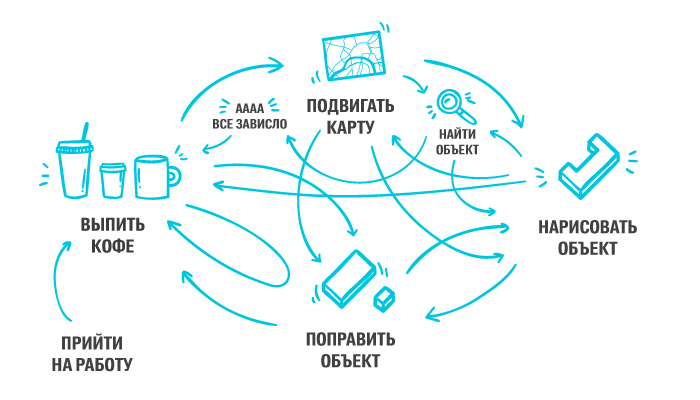
Fiji is the product in which our cartographers create a map. Want to know what an ordinary cartographer day looks like? We, the developers, see it like this:
')
Most of the time, the cartographer interacts directly with the map, which he himself creates. Responsive and fast map that allows you to see the changes online - this task is set before us by 500 cartographers working in 2GIS offices from Novosibirsk and Moscow to Prague and Santiago. Of course, we have an SLA for all these operations - navigating the map for a maximum of 3 seconds, updating the map data - 5 seconds.
How do we solve this problem?
Obviously, we have a database in which all geo-objects are stored. The first thing that comes to mind is simply to pull from it all the objects that the cartographer wants to see. This approach was used in the previous generation of our cartographic system, when the database was separate for each city 2GIS, and the number of cartographers did not exceed a couple of dozen.
One of the main requirements for the new system was the ability to create a map of the whole world, and not its individual parts within the boundaries of large cities. The previous approach was excluded, since the baseline geo-intersection is a very expensive operation. For example, in order to get all the buildings in Moscow, it would take about two minutes, and if you consider that the cartographer usually sees not one layer, but 10-20, he would have to drink quite a lot of coffee while waiting for the download :)
Another disadvantage of this approach is the large amounts of data that the client pulls from the server. For example, buildings in Moscow weigh more than 20 megabytes. The database is located in our data center in Novosibirsk, and the client may be in Chile. Between Novosibirsk and Chile ping 300 ms. With such indicators, the card immediately ceases to be responsive.
Raster tiles
The next option we considered was the use of raster tiles. Nothing new, a very popular approach for loading a specific extent of a map. The whole world beats on several levels of zoom (zoom level), each of which is divided into equal squares. As a result, we get a pyramid of tiles covering the world.
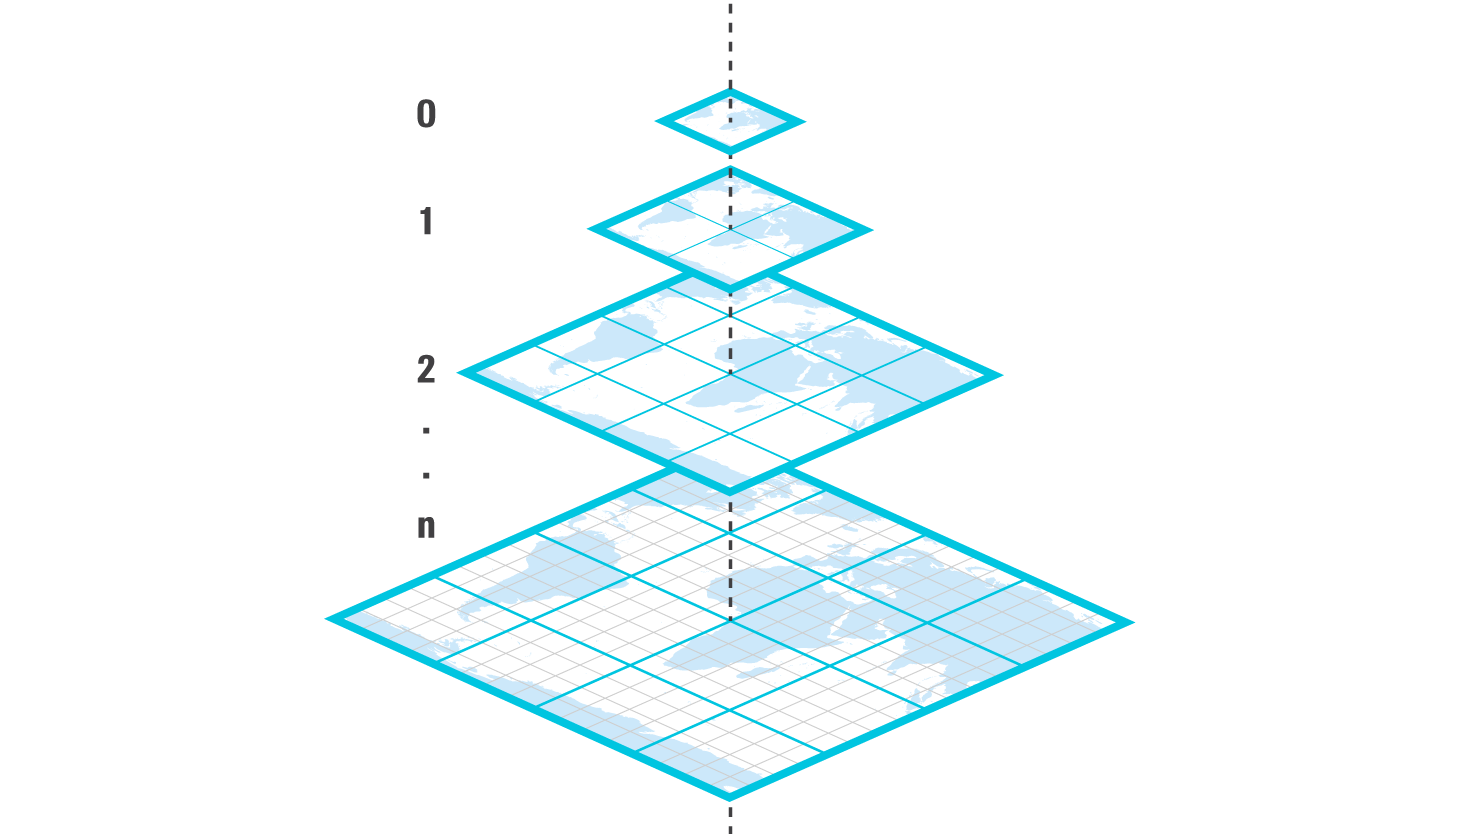
Pyramid of tiles
So we move away from permanent geo-intersections with each client request. In addition, raster images are much lighter than raw binary geometries. Tiles can be prepared once, decomposed into distributed servers and updated periodically.
The variant has the right to exist, but it did not suit us, because at any moment each cartographer can change:
- The set of displayed layers or their order. This means that you would have to have separate tiles for buildings, rivers, roads and on the client to fence the logic of laying tiles on each other in the right order.
- Styling any layer. That is, to decide that the neighborhoods should not be brown, but green with a red stroke. Then we would have to regenerate all the tiles of the quarters. Styling settings are individual.
- Styling for individual objects by any condition. For example, make all houses above five floors red. With rasters it will not work.
Plus, when creating objects, cartographers use such a tool as a “draw”, which allows to automatically combine the borders of objects drawn by a number of objects. To do this, the client needs real geometry of the displayed objects, and we would have only a picture.
The origin of vector tiles
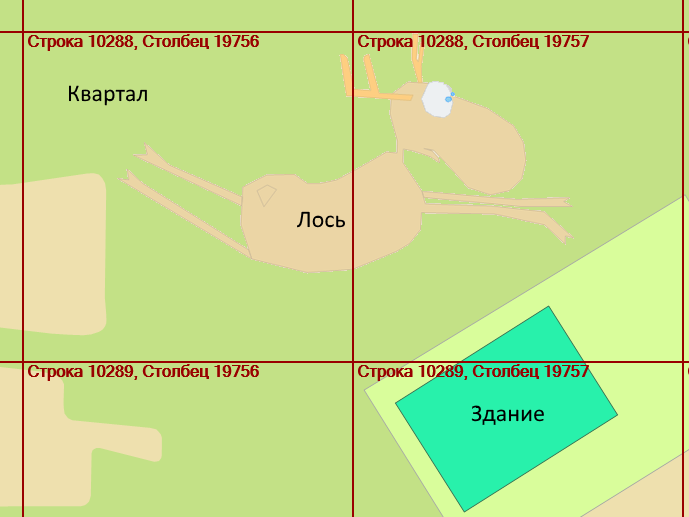
We thought that since the whole world uses tiles, and we basically need vector data, then why not combine these two entities into one, making the tiles vector. We also beat all of our geodata into tiles, but store in them not images, but geometries and identifiers of objects that fell into the corresponding tile. Moreover, it is not possible to store all the geometry, but only the necessary part, cut off along the border of the tile.
The advantages are obvious and cover all the disadvantages listed in the previous approaches. The idea is cool, but for its realization we had to go a long way and run into a number of problems.
Immediately I would like to note that even though some consider our Earth to be flat, but this is still not so :) Despite this, in the world of cartographers it is much more convenient to see the flat projection and work with flat coordinates.
We use EPSG as a projection : 3395 - WGS84 / World Mercator . It is on this projection that we create a tile grid with several levels. At the first level we have one square cell in which the whole world is located, that is, it covers an area of approximately 40,000 by 40,000 km.
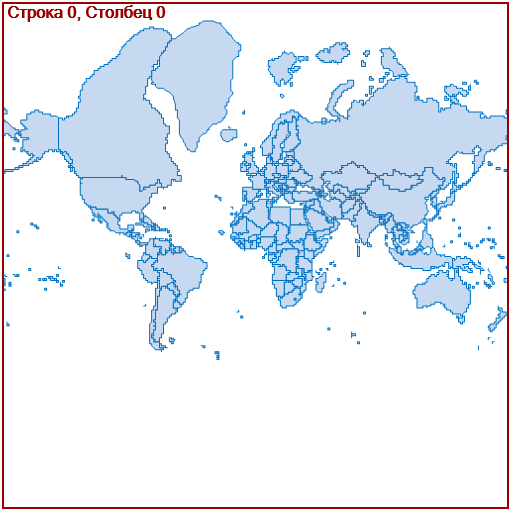
Tile grid of the first level
At the second level, divide our cell by four. At the next level, we divide each of the obtained cells by four more, and so on.

Second level tile grid
We have a total of 16 levels. Thus, at the last level, we obtain cells covering an area of approximately 1,200 by 1,200 meters. Further crushing of any tangible gains in the size of tiles will not give, but will lead to a significant increase in the number of tiles.
We use unique tiles for roads, buildings, rivers, neighborhoods. Due to this, only the types of tiles that are currently displayed are transmitted to the client.
Each tile has its own unique address of the form: Object_type / scale_level / line / column /
The address allows you to very quickly generate requests for the necessary tiles for displaying the apparently extent and scale, translating them into a zumlevel, a row and a column of a tile grid. As mentioned above, this is much simpler than intersections of arbitrary geometries.
Another plus of vector data is that we can show them on any scale that the user wants, at least one to one. You can't do this with rasters, there is a rigidly fixed set of scales corresponding to the levels chosen for the tiled pyramid.
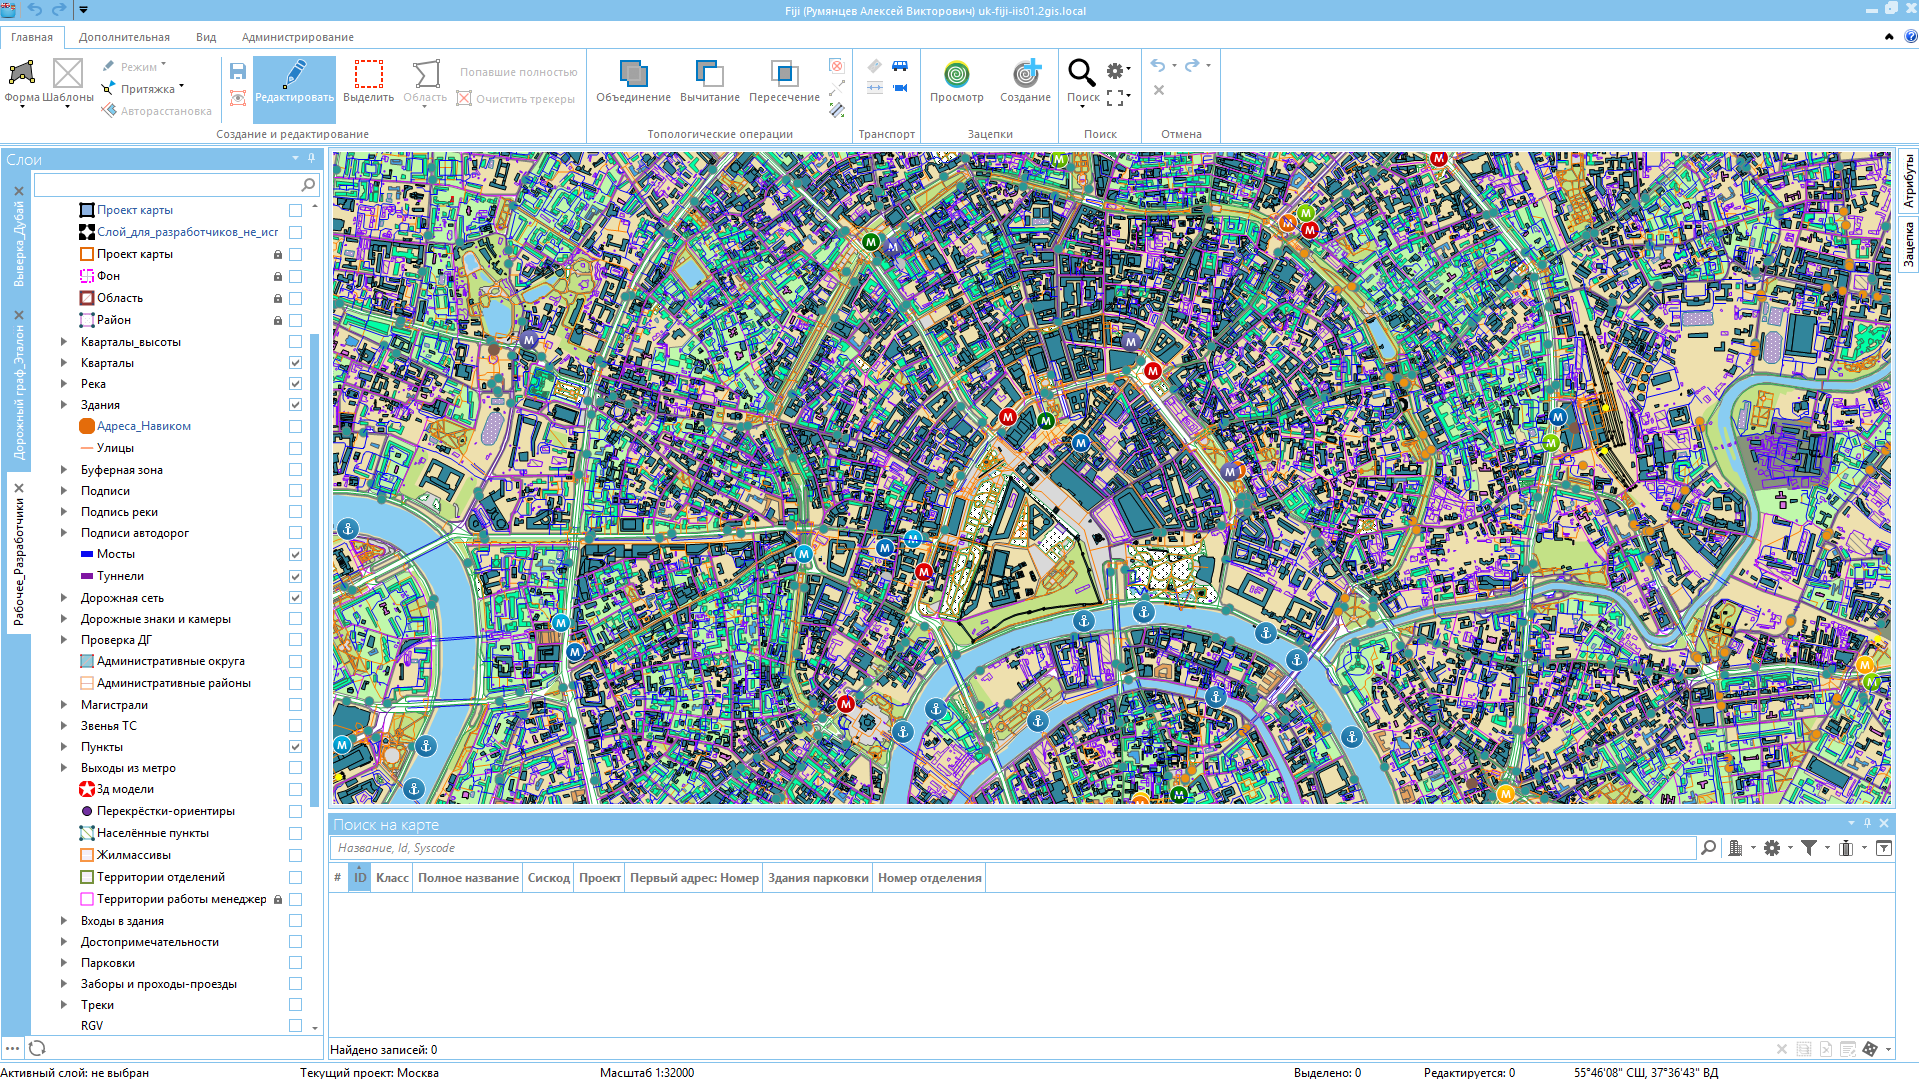
How is working with tiles in Fiji?
Schematically, the picture of working with tiles looks like this:
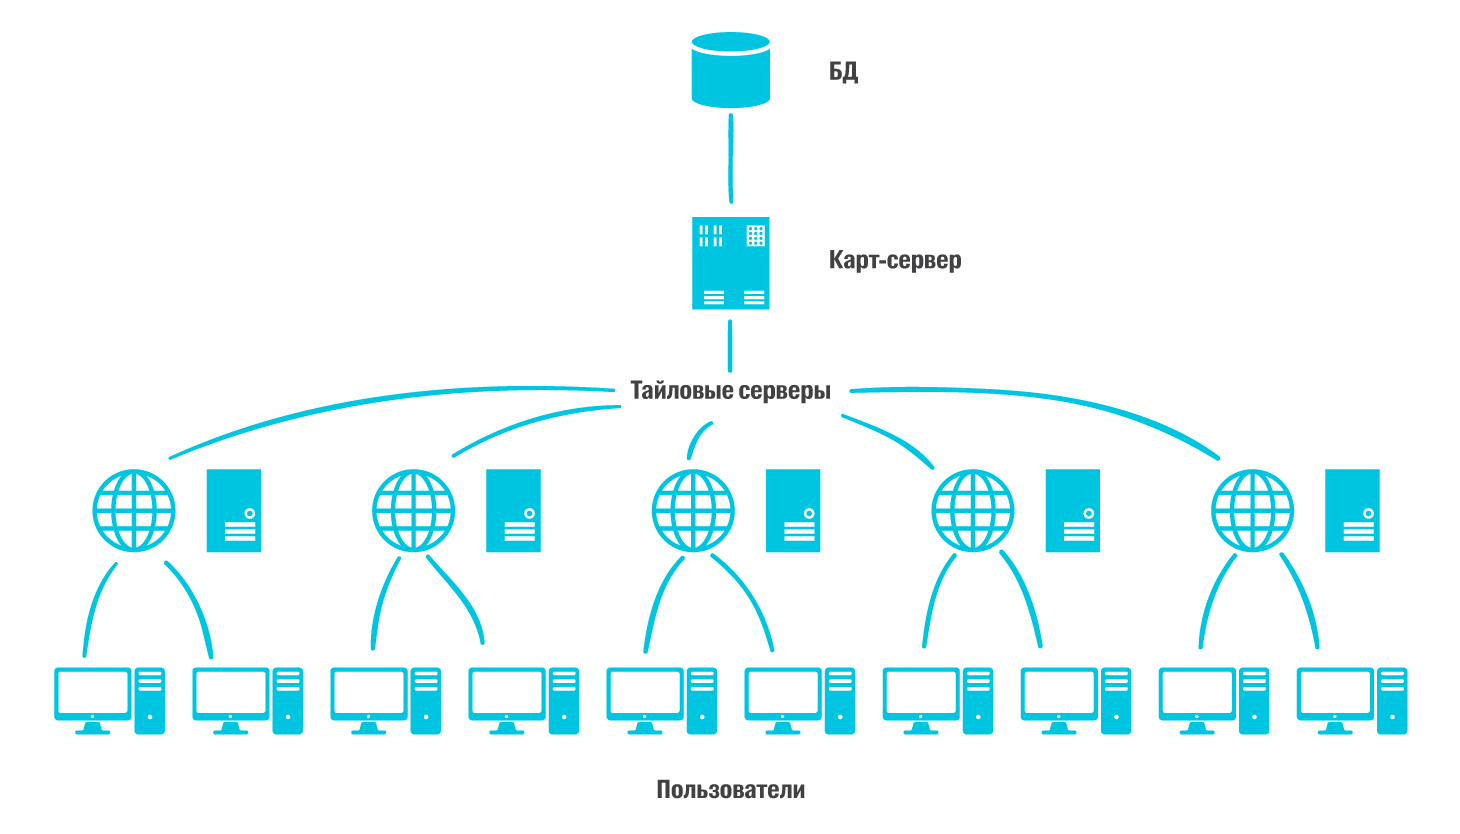
Central DB - all of our objects created by cartographers are stored here. We use MSSQL 2016. At the moment there are about 75 million geo-objects in it and it weighs 450 gigabytes.
The card server is the “brain” of the system through which all business operations pass - creating, updating, deleting objects.
Tile servers are lightweight Java applications that can be deployed on almost any machine. The logic in them is extremely simple - on request from the client to give the necessary tile, if it already exists. If not, then create a new one, give it to the client and save it for the future. In addition, it is necessary to periodically update the existing tiles for information about changed objects received from the card server.
We use PostgreSQL as a tile storage, a separate database for each server.
We have Tile servers next to large groups of users - the European part of Russia, Novosibirsk, Vladivostok. Due to the fact that these servers are independent of each other, we can at any time exclude from distribution or add a new server.
Clients are desktop applications, each of which automatically selects the best tile server for it. Selection criteria: response rate and network bandwidth.
Tiles in the client are used only for display and geocoding. Tile geometries are not suitable for editing, as they can be greatly simplified or cut off by tile borders. Therefore, for editing, we simply get the entire object from the database by identifier.
To display the tiles, we use our own render. For a long time we sat on someone else’s paid service, tried various free options, but none of them met our needs. As a result, they wrote their own, which supports rendering via DirectX and GDI +.
Tile optimization
The less the tile weighs, the faster it reaches the client. We used several optimizations to reduce the weight of the tiles:
- The projection of WGS84 operates with meters, but we are limited to an accuracy of one centimeter, so we can work with coordinates as with integer values. Since the geometry of an object inside a tile consists of fairly closely spaced points, it is more advantageous to store the coordinates of these points not in an absolute form, but as an offset from the previous point. In each tile, the first point of the first object is stored in absolute coordinates, and all the rest as an offset from the previous point. This allows you to reduce the size of the tile by 8 times!
- It makes no sense to display many types of objects on a small scale, for example, it makes no sense to show all buildings when we see a country on the screen. For each type of object, we have defined the lower limit of visibility for tiles, so as not to request them from the client and, accordingly, not to create them on the server.
- At all visible levels, except the last (sixteenth), simple generalization is used. Imagine that the maximum scale of a tile is an image of 256 by 256 pixels. Of all the points of the object that fall into the same pixel, we leave one. The result will greatly violate the original geometry - a square house can turn into a point. It is unlikely that the cartographer will be pleased with the result without seeing an honest non-generalized geometry when approaching one to one.
- We use the bit flag when the geometry of the object completely covers the tile. This is true for large objects that cover a multitude of tiles - areas, towns, and, of course, countries.
They coped with the task and quickly delivered the geometry to the client.
Does it always work?
In an ideal world, always. In reality, the geometry is not always enough for the full display of the object. For example, a cartographer would like to see all sections of the road blocked on May 9, or just street names.
To solve this situation, you can store all attribute information in the tile along with the geometry. Most often this is highly redundant: buildings alone can have up to twenty attributes.
You can only store what you need for signatures, but the problem is that the set of necessary attributes changes unpredictably.
In addition to the geometric ones, we decided to make attribute tiles, for each attribute - its own set of tiles. The client himself determines which attribute tiles are necessary for him, and requests them together with geometric ones.
What's next?
We have solved many non-trivial problems, but not all. Now all the forces are focused on the following problems:
- The time for updating tiles for cities and regions leaves much to be desired. Now we simply delete the old tiles and create new ones on request from the mapmaker. At these moments, the card slows down.
- Tile server databases are different. This is due to the fact that cartographer groups work with different parts of the map - Chileans do not edit the Far East. However, if they are transferred from the nearest tile server to the Vladivostok one, on which there are no tiles they need, the card will again begin to slow down due to the generation of missing tiles.
- Differences in the databases do not allow us in case of problems just to copy the backup of the neighboring server.
To speed up Fiji, we are developing a separate server application for creating and updating tiles. It will be located next to the map server or group of tile servers and will help distribute tiles to the required tile servers.
So, if you want to make your GIS editor, here are some tips:
- Use raster tiles where only a static image is needed and data rarely changes. For example, building plans.
- Wherever you may need dynamic data display and real geometry - use a vector.
- No matter how powerful your SQL server is, you should not put all your work with geodata on it. If there is little data, then at the beginning everything may be fine. Do not be misled - the load and the growth of data will never stop.
- Do not forget about the optimization of the amount of data transmitted over the network. Try to find places where you can painlessly show not the original geometry, but its simplification.
- Do not forget to relax - travel, walk, use maps, so as not to get lost :)
Source: https://habr.com/ru/post/341508/
All Articles