11 rules of data visualization
Olga Bazaleva, the creator of Data Vis and the author of the blog , wrote an article specifically for Netology about the most important principles of visualization. The article participates in a blog contest .
Want to stand out from the competition? To make your articles, reports, presentations or posts in social networks professional, interesting and accessible to a wide audience? Use data visualization!
I have worked for more than seven years in major media companies and advertising agencies, I have Bill, Rambler, RBC, I have created a website with visual market reviews and my own blog about data visualization. Therefore, I understand very well what will be discussed below.
')

Today, visualization is especially important, because people are lost in the abundance of surrounding information and too much time is spent on its perception. Therefore, boring incomprehensible texts are often overlooked. The reader will not waste time in order to understand them.
Visually presented information in comparison with plain text and tables:
There are many ways to visualize. This article focuses on the most common and accessible ones - graphs and charts. Illiterate use of even the simplest graphs can spoil the impression of your work and of you as an expert. To avoid this, follow the basic rules of data visualization.
Use the correct visualization type and format.
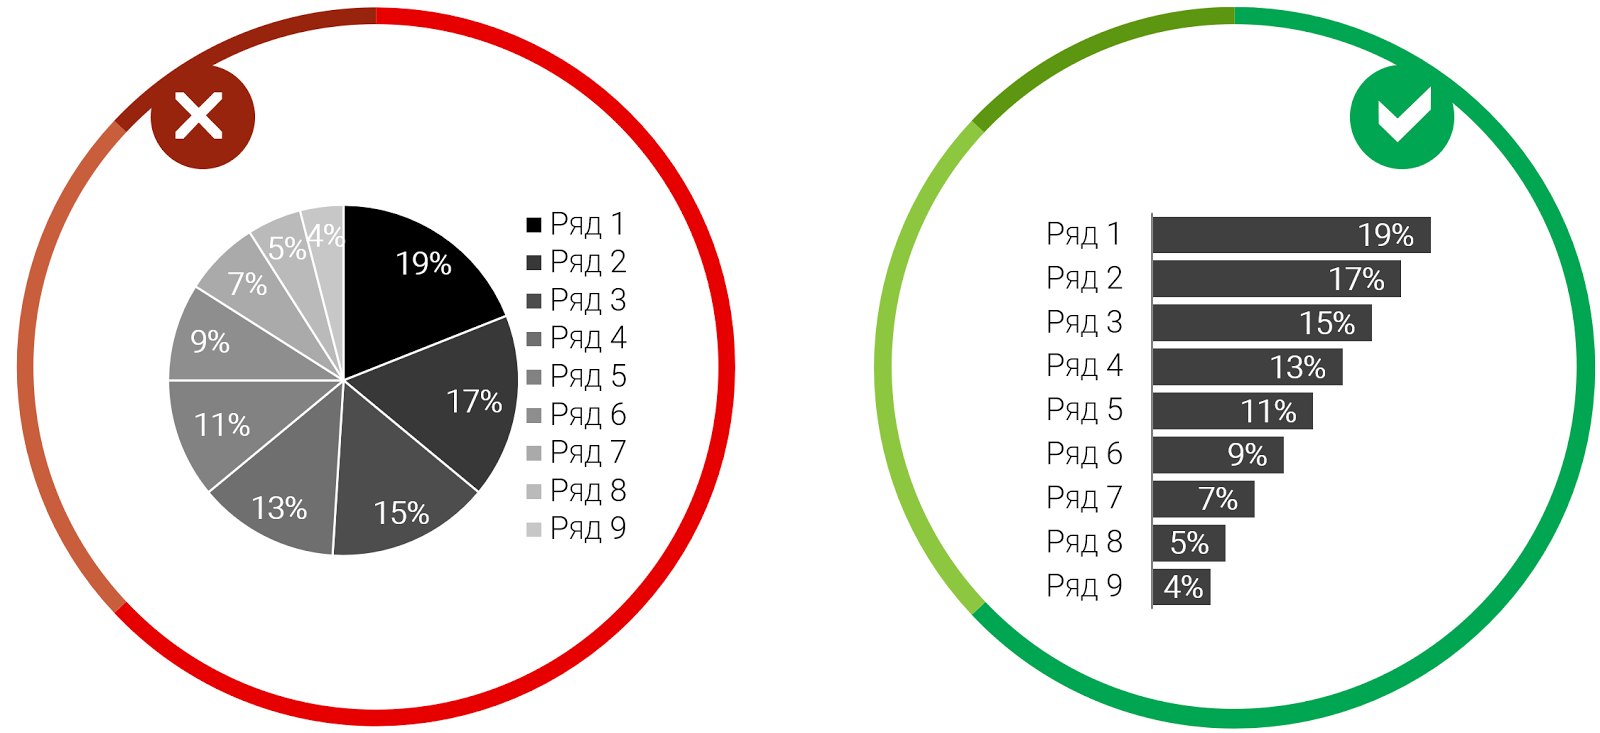
The main goal of visualization is to simplify and speed up the perception of information. The selected format and type of graphics should contribute to this, and not interfere.
For example, if a pie chart has more than three to five values, the graph becomes unreadable. In this case, it is better to choose a regular bar chart.
Another example of unsuccessful use of a pie chart when the sum of categories is not equal to 100%. This is a gross mistake, as the data is simply distorted.
It is equally important to ensure that generally accepted standards are not violated. The time axis (year, month, quarter) should always be horizontal from left to right, it is intuitive. If they are arranged vertically from top to bottom, it will be very difficult to understand.
Remember that poorly chosen type and format of the visualization immediately reduces the credibility of the information presented.
Lay out the data is logical.
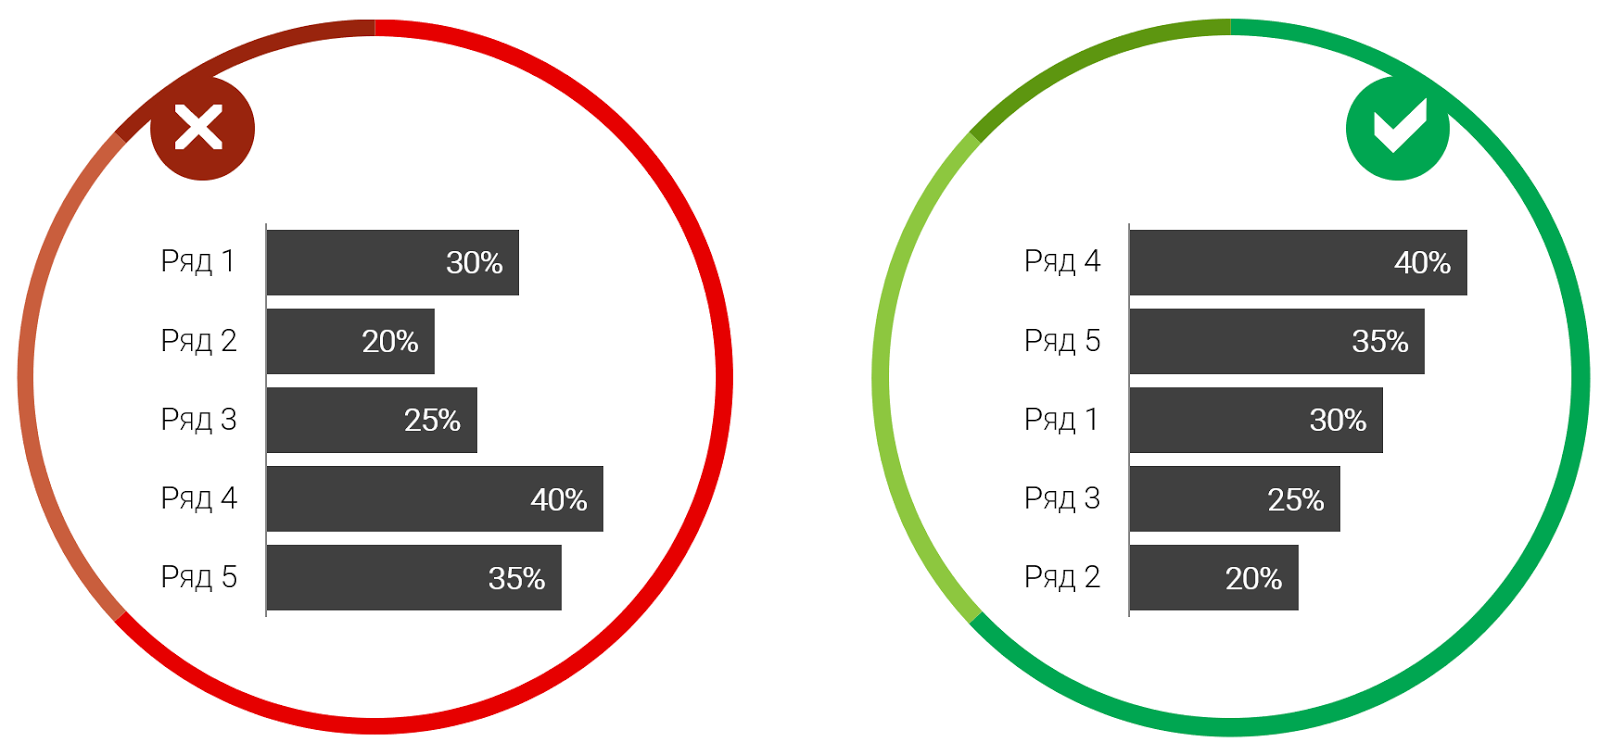
Be sure to place the data in a logical order. Most often, this is consistent from large to small.
If you show in the diagram the results of the survey, where there is a division into positive and negative answers, then it is more logical to build them in this order: “Yes, rather yes, No, rather no, I find it difficult to answer”.
Data can be built and from smaller to larger, if it corresponds to the purpose of your message. The goal is always primary. Before you begin to build the schedule, clearly state what idea you want to convey to readers, what you want to pay attention to.
The design should not interfere with the understanding or distort the data.

Avoid useless design elements such as gradients, shadows, 3D effects. They only distract the reader’s attention from the essence of your message.
Your schedule does not become beautiful and impressive because it is drawn volumetric. This could surprise twenty years ago, at the dawn of Excel, when very few people knew how to build diagrams. Moreover, 3D graphics can cause optical illusion.
Remember, if the visualization is done beautifully, it does not mean that it is made qualitatively. The principles of good design: clarity, simplicity and minimalism.
Visualize the data so that it can be easily compared.

One of the main goals of visualization is a convenient and visual comparison of two or more indicators.
Therefore, to make your diagrams valuable and useful, show the relationship between the data. If you break the same type of information into many separate graphs, visualization becomes meaningless.
It is the quick understanding of the highest and lowest values, trends and correlations that is the main advantage of visualization in comparison with a regular table or text. Charts should transfer your ideas much faster and more clearly. If not, change the type of chart.
The diagram should contain only the necessary elements.
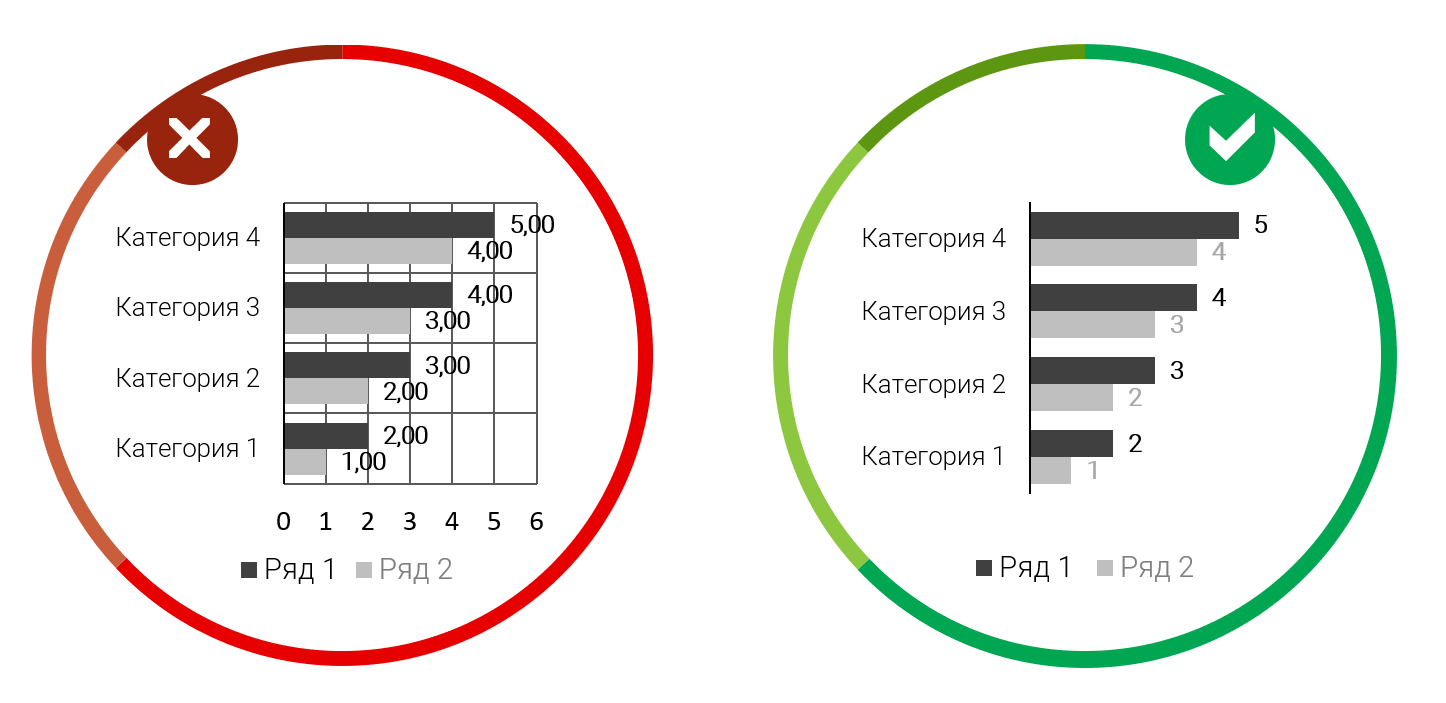
Remove all non-informative elements from your graphs and charts, leave only the necessary ones.
Lumbering with unnecessary information makes perception difficult.
For example, if there are signatures of values, the grid lines and the axis are not needed, since this duplication of information is a graphical “garbage”. The main and auxiliary grid lines, if they are still needed, should be simple and not conspicuous. The emphasis should always be on the basic idea, not on the auxiliary elements. If you follow this advice, the necessary information immediately comes to the fore.
Make sure that there is no visual clutter.
Do not try to fit on one diagram all the information you have in order to make your schedule seem smart and significant. The visual row should not be overloaded with complex and multi-tiered diagrams.
When it is necessary to visualize many different types of data and categories, it is more expedient to divide the diagram into several parts. For example, if there are more than four or five lines on a line chart or more than two categories on a bar chart, you should not fit them on one chart.
Numbers should be with separators and no extra decimal places.

In large numbers, always separate the digits: 10,000,000, not 10,000,000, otherwise the numbers become unreadable.
Also, do not use decimals without conscious need. And make sure that the format was uniform. If you decide to show one decimal place, then do so for all data signatures, and not selectively: somewhere there are two signs, somewhere there are three, and somewhere without a single sign.
The chart must have a title and a complete legend.
Make sure that your diagram always has a full clear name and all the necessary signatures, otherwise there is a risk of misinterpretation.
The period and units must always be clear. Do not expect that the user of your schedule will guess about it from the context. To make sure that the data will be correctly interpreted, take the place of the reader who sees your chart for the first time. Everything should be very clear, the reader should not have any doubts about the interpretation of the data presented.
Remember that your task in creating graphs and charts is to simplify data perception, and not to cause unnecessary questions.
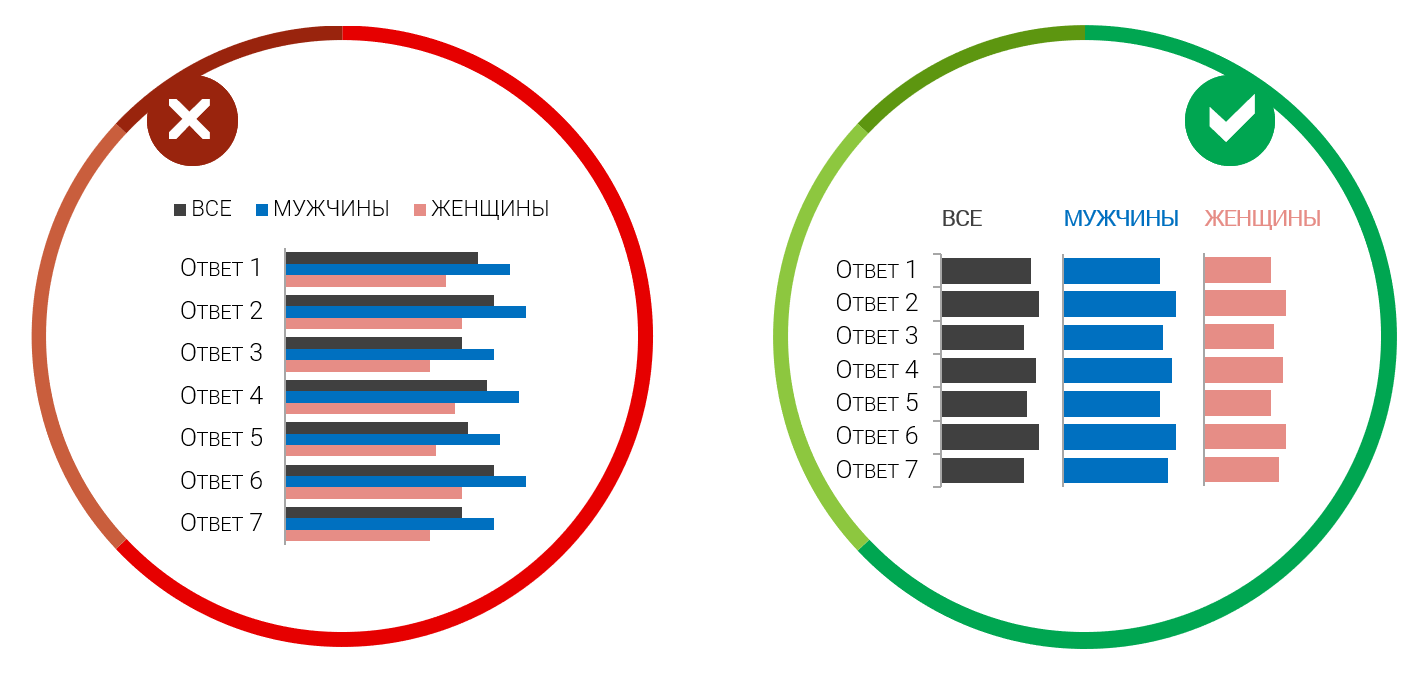
Do not violate the customary use of a particular color.

There are several main categories that we always associate with a specific color:
If you show these categories on the charts in the expected colors, then the user does not even have to look at the legend; without this, it is clear what color it means. Do not neglect this rule, it is very simple and logical, but there are often examples of its ignoring on the Internet.
There is a good way to use color to compare the performance of the current year and the past - to make the past year more pale, and the current one more vivid. At the same time, it is better to show both years in shades of the same color, because we are talking about the same indicator.
Use one kind of chart for the same type of data.

Avoid diversity for the sake of diversity.
It is not always beautiful, but always useless. For data of the same type it is better to choose one type of chart.
For example, when you show consistently answers to research questions or sales dynamics across several stores, do not turn on fantasy, use the same type of graphics. The reader needs time to get used to each new type of chart and figure out what a particular line, circle or column means.
Stick to one color range.
Visual elements (graphs, charts, diagrams) throughout the entire study or report should be performed in the same color scheme.
If you are a research company, then the color palette should be the same in all studies, in order to respect the corporate identity. If you supplement your report with graphs from other studies, they need to be redrawn, otherwise they strongly cut into the big picture and spoil the perception. Firstly, they probably have a different color scheme, and secondly, often the quality of the pictures is not the best and it immediately catches the eye.
It will take only 10–20 minutes to redraw the graph in the style of the company, and the report will look more holistic and of higher quality. Thus, it is you who are intuitively perceived by the information creator and the expert, even if you specify another source of data, which, by the way, is also always necessary to do.
Do not ignore these simple but very important visualization rules. Take care of your readers. No one likes to feel stupid, considering incomprehensible or piled up graphs and diagrams.
And you yourself, at the sight of strange diagrams at conferences or meetings, did not ask yourself the question: “Is it me who is so inconspicuous that you don’t understand anything?” Believe me, you are not alone!
Training programs from Netology:
Want to stand out from the competition? To make your articles, reports, presentations or posts in social networks professional, interesting and accessible to a wide audience? Use data visualization!
I have worked for more than seven years in major media companies and advertising agencies, I have Bill, Rambler, RBC, I have created a website with visual market reviews and my own blog about data visualization. Therefore, I understand very well what will be discussed below.
')
Today, visualization is especially important, because people are lost in the abundance of surrounding information and too much time is spent on its perception. Therefore, boring incomprehensible texts are often overlooked. The reader will not waste time in order to understand them.
Visually presented information in comparison with plain text and tables:
- attracts a lot more audience;
- increases reader engagement;
- faster perceived;
- easier to remember.
There are many ways to visualize. This article focuses on the most common and accessible ones - graphs and charts. Illiterate use of even the simplest graphs can spoil the impression of your work and of you as an expert. To avoid this, follow the basic rules of data visualization.
RULE 1. RIGHT TYPE GRAPHICS
Use the correct visualization type and format.
The main goal of visualization is to simplify and speed up the perception of information. The selected format and type of graphics should contribute to this, and not interfere.
For example, if a pie chart has more than three to five values, the graph becomes unreadable. In this case, it is better to choose a regular bar chart.
Another example of unsuccessful use of a pie chart when the sum of categories is not equal to 100%. This is a gross mistake, as the data is simply distorted.
It is equally important to ensure that generally accepted standards are not violated. The time axis (year, month, quarter) should always be horizontal from left to right, it is intuitive. If they are arranged vertically from top to bottom, it will be very difficult to understand.
Remember that poorly chosen type and format of the visualization immediately reduces the credibility of the information presented.
RULE 2. LOGICAL ORDER
Lay out the data is logical.
Be sure to place the data in a logical order. Most often, this is consistent from large to small.
If you show in the diagram the results of the survey, where there is a division into positive and negative answers, then it is more logical to build them in this order: “Yes, rather yes, No, rather no, I find it difficult to answer”.
Data can be built and from smaller to larger, if it corresponds to the purpose of your message. The goal is always primary. Before you begin to build the schedule, clearly state what idea you want to convey to readers, what you want to pay attention to.
RULE 3. SIMPLE DESIGN
The design should not interfere with the understanding or distort the data.
Avoid useless design elements such as gradients, shadows, 3D effects. They only distract the reader’s attention from the essence of your message.
Your schedule does not become beautiful and impressive because it is drawn volumetric. This could surprise twenty years ago, at the dawn of Excel, when very few people knew how to build diagrams. Moreover, 3D graphics can cause optical illusion.
Remember, if the visualization is done beautifully, it does not mean that it is made qualitatively. The principles of good design: clarity, simplicity and minimalism.
RULE 4. EASY COMPARISON OF DATA
Visualize the data so that it can be easily compared.
One of the main goals of visualization is a convenient and visual comparison of two or more indicators.
Therefore, to make your diagrams valuable and useful, show the relationship between the data. If you break the same type of information into many separate graphs, visualization becomes meaningless.
It is the quick understanding of the highest and lowest values, trends and correlations that is the main advantage of visualization in comparison with a regular table or text. Charts should transfer your ideas much faster and more clearly. If not, change the type of chart.
RULE 5. MINIMUM ELEMENTS
The diagram should contain only the necessary elements.
Remove all non-informative elements from your graphs and charts, leave only the necessary ones.
Lumbering with unnecessary information makes perception difficult.
For example, if there are signatures of values, the grid lines and the axis are not needed, since this duplication of information is a graphical “garbage”. The main and auxiliary grid lines, if they are still needed, should be simple and not conspicuous. The emphasis should always be on the basic idea, not on the auxiliary elements. If you follow this advice, the necessary information immediately comes to the fore.
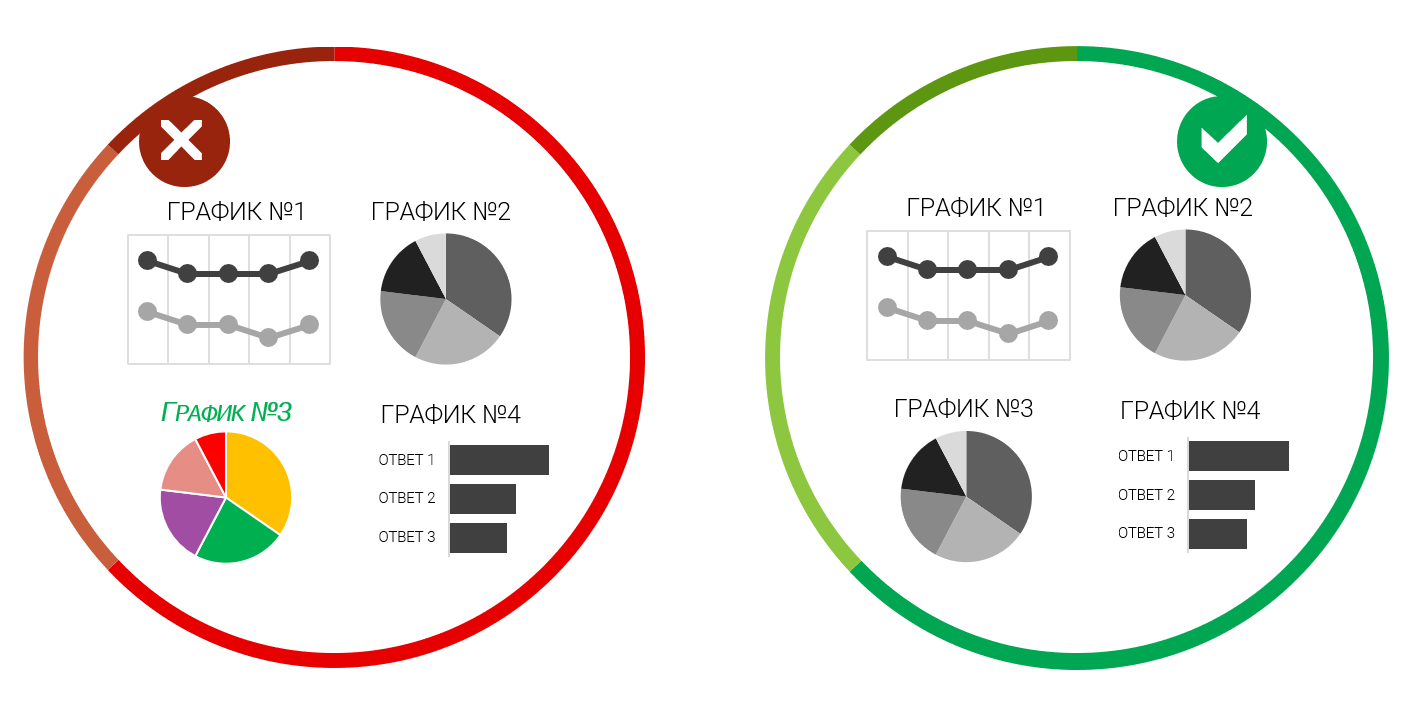
RULE 6. DO NOT OVERDRIVE INFORMATION
Make sure that there is no visual clutter.
Do not try to fit on one diagram all the information you have in order to make your schedule seem smart and significant. The visual row should not be overloaded with complex and multi-tiered diagrams.
When it is necessary to visualize many different types of data and categories, it is more expedient to divide the diagram into several parts. For example, if there are more than four or five lines on a line chart or more than two categories on a bar chart, you should not fit them on one chart.
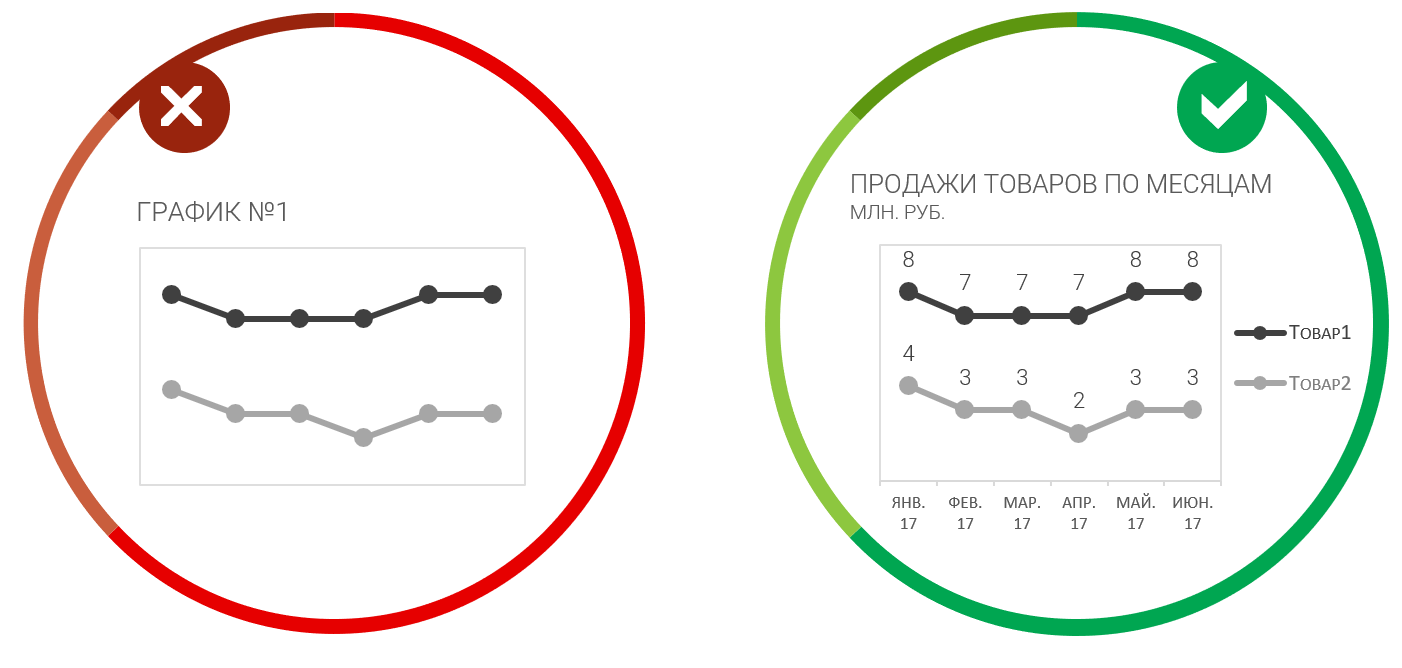
RULE 7. CLEAR FORMAT NUMBERS
Numbers should be with separators and no extra decimal places.
In large numbers, always separate the digits: 10,000,000, not 10,000,000, otherwise the numbers become unreadable.
Also, do not use decimals without conscious need. And make sure that the format was uniform. If you decide to show one decimal place, then do so for all data signatures, and not selectively: somewhere there are two signs, somewhere there are three, and somewhere without a single sign.
RULE 8. TITLE AND SIGNATURES
The chart must have a title and a complete legend.
Make sure that your diagram always has a full clear name and all the necessary signatures, otherwise there is a risk of misinterpretation.
The period and units must always be clear. Do not expect that the user of your schedule will guess about it from the context. To make sure that the data will be correctly interpreted, take the place of the reader who sees your chart for the first time. Everything should be very clear, the reader should not have any doubts about the interpretation of the data presented.
Remember that your task in creating graphs and charts is to simplify data perception, and not to cause unnecessary questions.
RULE 9. COMMON ACCEPTED COLOR SOLUTIONS
Do not violate the customary use of a particular color.
There are several main categories that we always associate with a specific color:
- positive and negative values: green and red;
- yes / no, agree / disagree: green and red;
- men and women: blue and pink;
- other / other / rest / no answer / difficult to answer - gray.
If you show these categories on the charts in the expected colors, then the user does not even have to look at the legend; without this, it is clear what color it means. Do not neglect this rule, it is very simple and logical, but there are often examples of its ignoring on the Internet.
There is a good way to use color to compare the performance of the current year and the past - to make the past year more pale, and the current one more vivid. At the same time, it is better to show both years in shades of the same color, because we are talking about the same indicator.
RULE 10. MINIMUM TYPES OF DIAGRAMS
Use one kind of chart for the same type of data.
Avoid diversity for the sake of diversity.
It is not always beautiful, but always useless. For data of the same type it is better to choose one type of chart.
For example, when you show consistently answers to research questions or sales dynamics across several stores, do not turn on fantasy, use the same type of graphics. The reader needs time to get used to each new type of chart and figure out what a particular line, circle or column means.
RULE 11. SINGLE COLOR PALETTE
Stick to one color range.
Visual elements (graphs, charts, diagrams) throughout the entire study or report should be performed in the same color scheme.
If you are a research company, then the color palette should be the same in all studies, in order to respect the corporate identity. If you supplement your report with graphs from other studies, they need to be redrawn, otherwise they strongly cut into the big picture and spoil the perception. Firstly, they probably have a different color scheme, and secondly, often the quality of the pictures is not the best and it immediately catches the eye.
It will take only 10–20 minutes to redraw the graph in the style of the company, and the report will look more holistic and of higher quality. Thus, it is you who are intuitively perceived by the information creator and the expert, even if you specify another source of data, which, by the way, is also always necessary to do.
Do not ignore these simple but very important visualization rules. Take care of your readers. No one likes to feel stupid, considering incomprehensible or piled up graphs and diagrams.
And you yourself, at the sight of strange diagrams at conferences or meetings, did not ask yourself the question: “Is it me who is so inconspicuous that you don’t understand anything?” Believe me, you are not alone!
From the Editor
Training programs from Netology:
- " Infographics: the art of presenting data ";
- " The course of graphic design: composition, color, typography " (free program).
Source: https://habr.com/ru/post/341364/
All Articles