How to evaluate whether marketing activities will bring profit to the store

The increase in turnover is an urgent task for any retailer. To solve it, they most often resort to marketing tools - the use of loyalty programs, the formation of various promotions and special offers. However, it is not enough just to develop and launch a promotion in the store, it is equally important to evaluate its effectiveness. We tell how to do this at the front-office system.
Our experience shows that carrying out the majority of promotions is directly related to price incentives - that is, lower prices for goods that do not sell very well. No less popular are special offers for products coming at a reduced price from suppliers, expired goods and sets (stocks aimed at increasing the average bill - a discount on a set of goods, N + N, an inseparable pair, a gift for a purchase).
')
At the same time, retailers often prefer to set a promotional period within a month, weekly promotions run a little less, and Happy Hour special offers usually come in third place.
Accordingly, it is for this designated period that the change according to two criteria should be noticeable, the most important for any effective action:
- increase in turnover;
- increase in the number of purchases made by customers of the store.
Promotion Analysis Reports
For high-quality analytics of the effectiveness of marketing promotions, the following values are usually of interest:
- the amount of the average purchase in the store (usually its value is stable, and a deviation in any direction is a serious reason for analyzing the situation);
- comparison of recorded deviations of the amount of purchases with the situation in the past similar periods (comparison of figures for the past week or months. This can be used to determine whether the change occurred is due to a promotion or is related to seasonal fluctuations);
- assessment of the increase in turnover (another criterion that allows you to separate from the seasonal fluctuations).
Sales results, including the information needed to study the effectiveness of promotions, are stored in a database of the front-office system. On this basis, you can generate reports using the internal means of the system, or use this data for analysis in the BI system.
For example, in the cash software "Profi-T" there are standard reports on revenue and the number of purchases for a fixed period (day, week, month, year). Suppose a retailer launched the “Happy Hours” promotion to sell its own cooking shop. Then the report on the number of purchases at certain hours will allow him to compare the data with the period preceding the start of the promotion.
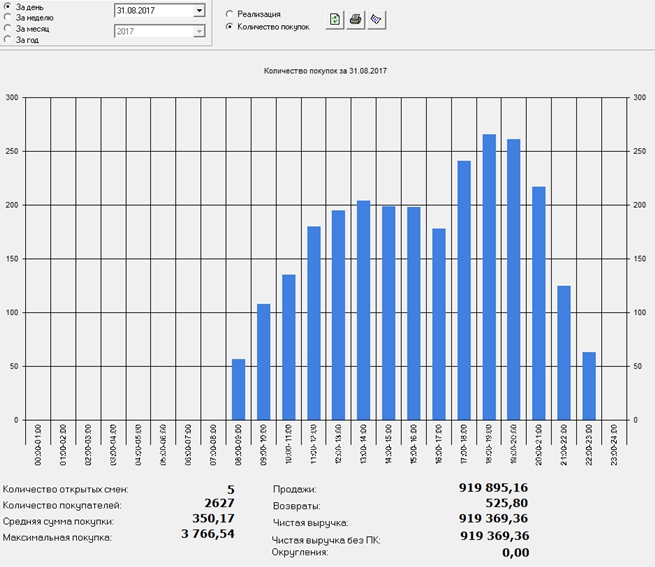
The illustration shows the increase in the number of buyers in the hours of the action - from 17:00 to 21:00.
This report allows the marketer to obtain primary information about the relevance of the action and the response of visitors. If you see a surge in purchases, then everything is going right, and the promotion can continue. Otherwise - make changes to the conditions, for example, by choosing a different time of the meeting or the target audience.
Another example is promotions designed for specific days of the week. Suppose the store decided to set discounts on a certain group of goods on weekdays. In advance, marketers informed buyers about the new opportunity to save. Now they need to understand whether the promotion has had an effect and whether the store’s traffic has increased. Answering these questions will also help get a report.
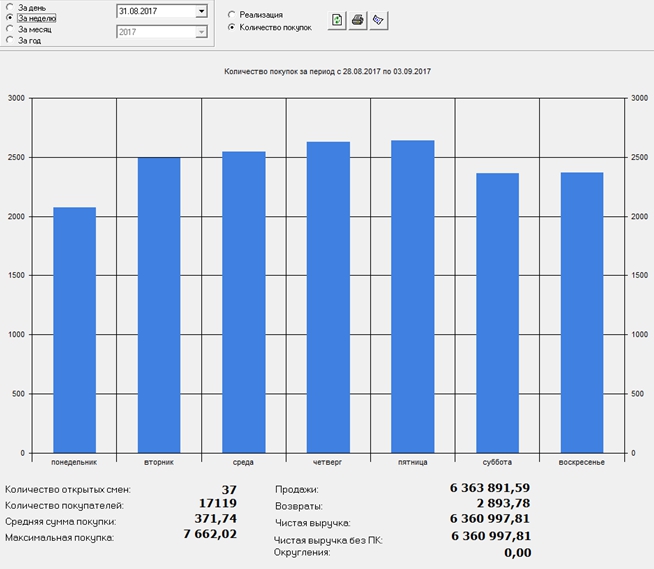
As the illustration shows, since Tuesday the number of customers in the store has increased. Peak days were Thursday and Friday.
If the store uses a loyalty card program - bonus or discount - then its effectiveness will be determined by the following indicators:
- the number of cards issued;
- the number of actively used cards;
- growth rate of the average check on the map.
Most modern point processing accumulate information on the number of newly registered customers, the history of existing purchases, and segment this data according to various criteria (gender, age, frequency of purchases made). For example, Profi-T Points allows marketers to receive reports in .csv format by:
- points;
- customers;
- sales / returns;
- burn points;
- the number of points written off in the store;
- age of clients;
- the number of email addresses in the database.
Based on these metrics, one can draw conclusions about the effectiveness of the loyalty program used and outline measures for its improvement.
To enhance the effect of the loyalty program help personalized promotions. For example, in Profi-T, Promo-Server is responsible for this task. With it, the marketer can both easily create stocks and get initial data on the success of their actions. Thus, the report on goods for the period of the action allows you to determine not only popular events and the amount of discounts provided in each of them, but also the results of changes in sales volumes of selected product groups.
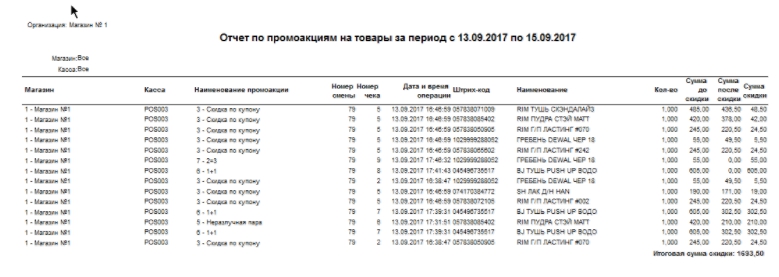
The illustration shows the report on the number of goods sold in the framework of the action, as well as the total amount of purchases before and after the application of discounts.
The reports we have described allow the retailer to make a preliminary assessment of the effectiveness of marketing activities held at his store. And in case of their failure, correct the situation in advance and not waste money.
Source: https://habr.com/ru/post/340914/
All Articles