Telemetry and software

About 6 years ago, I participated in a project for the manufacture of hardware and software for one large North American medical company. Standing near the test stand, in which there were several devices under load, I asked myself the question: “If something goes wrong, how can we speed up the search and correction of the error?”
From the moment this issue arose to this day, a lot has been done, and I would like to share with you how the collection and analysis of telemetry in software and hardware has significantly reduced the time of error detection and correction in the whole spectrum of projects in which I participated.
Introduction
Telemetry comes from the ancient Greek τῆλε "far" + μέτρεω - "measured."
Everything is very simple, any measurements that a staff of various engineers and possibly scientists can invent, the target system sends to the processing center for visual and automatic control and processing.
')
Something like this:

When on the server side it might look like this:
Prehistory
Somehow, watching the work of our QA engineers, I wondered why complex devices like satellites, rockets, machines have telemetry, and we, creating, in fact, the program parts of the operating rooms, robots, complex software solutions, do not even think about it direction?
The amount of code is enormous, and there are ways to understand that something went wrong less than fingers on one hand:
- Put a breakpoint, but for this you need to complete the quest:
1) Be lucky enough and have access to the target system
2) Be lucky and know how to accurately reproduce the bug or wait and wait again
3) Pray that the breakpoint does not destroy the internal state of the system (if there are real-time processes inside) - The client is screaming into the phone that exception in your code is not a bit ridiculous and it’s good that he was caught by his engineers on the test bench, and not when the patient is on the table, and at that time you are thinking what the exception is
- Zen option - log analysis
- Crash dump analysis
In parallel, watching the work of our QA engineers, I looked at one of the screens, which the patient's heartbeat curves, pressure, temperature and heaps of other parameters ran along and I wanted our products to be like this patient - under reliable supervision. So that even if something goes wrong, it was possible to rewind the time and see what circumstances happened.
Bike or ride
As we were taught: bicycles are informative and fascinating, but first look for existing solutions, which I did.
By good tradition, he began with the requirements:
- Client-server architecture (in the absence of a server, the ability to save data locally)
- Open source
- Cross-platform (at least Linux + Win)
- Remote control (on / off counters to save resources)
- High performance (by the standards of C / C ++ programs)
- Reasonable memory requirements, and better ability to control this parameter
- Support at least C / C ++ / Python
- The ability to write scripts or your own code for analyzing telemetry in real-time and / or off-line modes
- Convenience of viewing in real-time and off-line modes (subjective requirement)
I searched for a long time and thoughtfully ... but alas, everything was not just bad, everything was terrible!
At the beginning of 2011, not a single project that I found, even close, even half of the requirements, came under these requirements.
Telemetry for software in the form of ready-made and open solutions was almost absent as a class, the big players did everything for themselves and were not in a hurry to share.
The second surprise was the reaction of colleagues - indifference or at worst rejection, but, fortunately - it did not last long, until the first results.
The only solution I found at that time (2011) was the P7 library located at the time on google code. The functionality was poor, from the platforms there was only X86, it was difficult to look at the server without tears, but there were also advantages:
- high performance
- is free
- open source
- the ability to control (on / off) the counters remotely (which was tempting in terms of saving the CPU)
- And most importantly, the author of the project was interested in our ideas for improvement.
After a series of thoughts, studying, it was decided to try to ride a bike on someone else.
First step
Embedding the library in our code was easy and without problems, but then the question arose: what beautiful graphics we want to see and what readings to record? It just seems that the question is simple, in fact - it is complicated and cunning.
At first, and without experience, we began to write a relatively insignificant amount of telemetry:
- CPU load by cores and threads
- Number of handles, threads, objects, etc.
- Memory consumption
- Different buffers
- Several cyclograms for critical flows
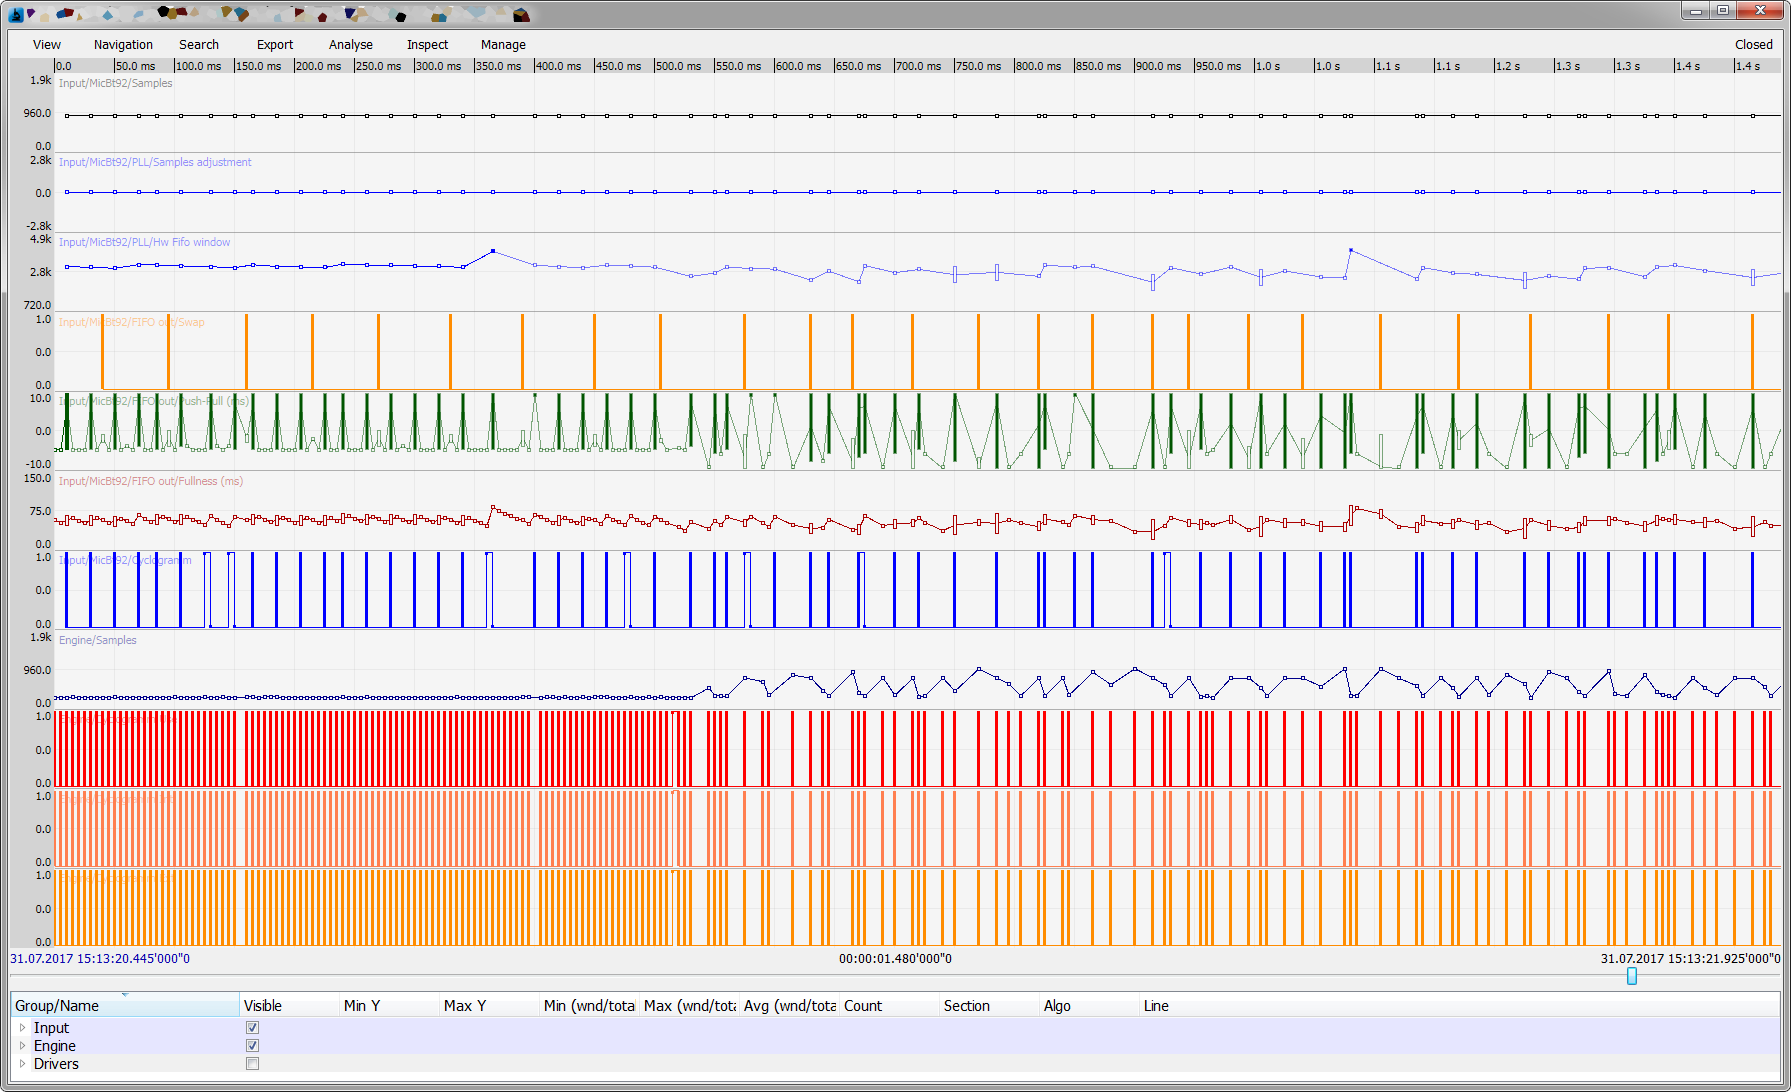
Unfortunately, the screenshots of those years have not survived, and I will give the closest approximation:

The very first baptism of fire gave excellent results: after a couple of days of inconspicuous work and the reproduction of several bugs, we were finally able to understand the nature of many of them:
- Reading from the disk didn’t jam because the disk was busy - another stream was busy (it seems like it was not related to the first one). We have already managed to give a plausible explanation to the customer, then we added telemetry ... and ... it came out inconveniently.
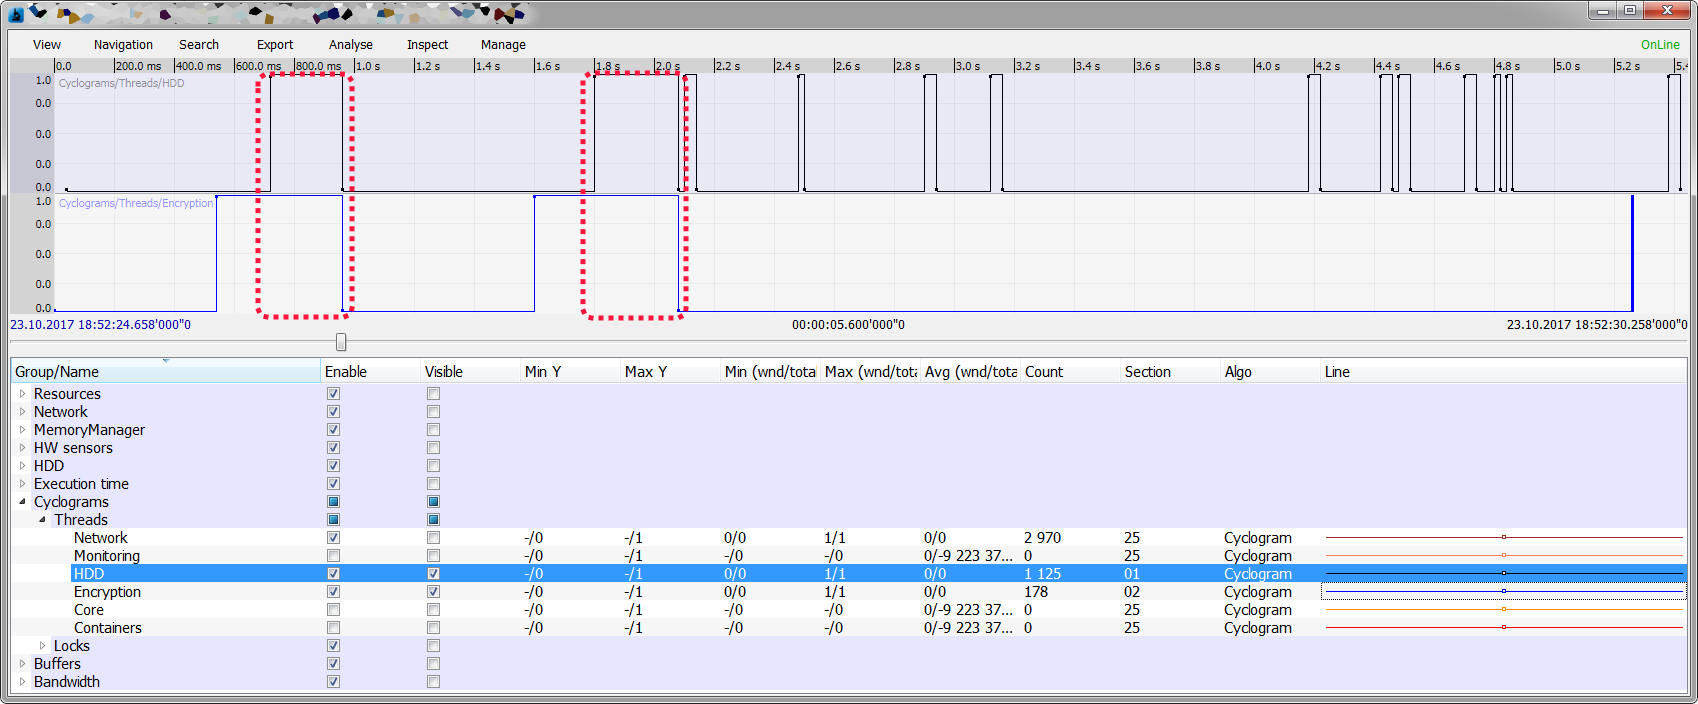
The graph (clickable) shows that the delays in the stream reading from the HDD coincide surprisingly with the delays in another stream; after 10 minutes of peering into the code, a piece was found that caused such a dependency. - We saw periodic jumps in memory, just for a few seconds, followed by release, the release sometimes hung, because the memory manager tried to digest several thousand items returned back.
It turned out that the test code from the machine of one of the engineers got into production and regularly hung up one of the threads, for half a second, for a second. This problem was also clearly visible on the graphs - the rise of CPU, memory, the frenzied work of the memory manager, and suddenly in the middle it hung for several hundred milliseconds (sometimes up to several seconds):
- Data processing from the disk stuck because the buffer was empty, and the buffer was empty because of the first bug, which again was clearly visible on the graph, and the coincident time marks of telemetry and logs spoke about the relationship of these events.
There were some corrected on the first or second day, but after years of prescription, I can no longer remember what it was.
After we enthusiastically with our colleagues poked their fingers at the monitor and asked “¿Qué pasa?”, Found the answer and were happy as children - the utility question was no longer there, we got a new toy and wanted to play further.
Go to run
After the first success, we began to consistently increase the number of required meters:
- Added telemetry in the form of cyclograms on the main streams, it immediately became apparent frequency of work, small and large freezes
- Added telemetry to synchronization primitives (mutexes, semaphores, critical sections).
- Added all possible hardware sensors - “turned out” temperature jumps correlate with a number of problems
- Added load counters for various hardware components - memory bandwidth, registers access, PCI and the world played with new colors
- Measurements of the execution time of the main functions and code blocks, and when after making changes on tests, a regression in performance was detected - interested persons received an automatic angry email, describing which counter after which code change showed regression
- Of course, in addition to these counters, engineers added heaps of others, on time and on a permanent basis.
Next, we divided the counters into 3 groups:
- Generating the largest data flow - our software processed these counters only when there was a connection with the server and when this counter was switched on from the server by the hands of one of the engineers
- Generating the average data flow - our software processed these counters only when there was a connection with the server, if there was no connection with the server - the counter did not waste CPU cycles, but as soon as the connection appeared - the data started to be sent
- Critical - this data should have been saved anyway, if there is no connection with the server, then on the HDD
And the final step was to update the testing process and implement the practice, that the error recorded by QA should accompany not only the formal description, if possible, the playback method and log files, but also telemetry.
Conclusion
As a conclusion, let me present a few facts:
- Now we are collecting an impressive amount of telemetry from the whole spectrum of software from C to C # and Python and up to iron, we collect centrally and not so much, depending on the tasks
- Telemetry analysis is divided into 3 blocks:
- Automatic (server plugins)
- Semi-automatic - in the server it is possible to use your own Lua scripts for additional analysis, the engineer decides for himself and modifies / creates them for his own needs
- Visual (method of attentive peering) sounds ridiculous, but often it is also very effective, especially if you don’t know what to look for, and the problem is
- Error reports from our QA engineers accompany links to telemetry
- We began to solve problems faster
This article is rather superficial and leaves behind many technical issues “how to get the CPU load by my stream”, “how to make a cyclogram of my stream”, “how do you make plugins” and so on and so on. But if the topic is interesting enough, you can make separate articles on all these points.
I would like to hope that this article will allow you to ask the same question as “will telemetry help our product?”, Then I can say that I wrote it for good reason, as this question rarely sounds in the software industry, there is an opinion that this is a lot of space and defense.
Thank you for reading!
PS: I deliberately did not talk about our company and I will not - this article is not about her.
PPS: if you are interested, we use the Jenkins + Baical + P7 bundle ( www.baical.net ), it fits well for our needs, the author of the project has implemented, at our request, not one or two improvements, in addition, we use P7 for logging ( https://habrahabr.ru/post/313686/ )
Source: https://habr.com/ru/post/340882/
All Articles