Time Travel Debugging in the new WinDbg
You may have already heard that Microsoft has released an updated version of its well-known WinDbg debugger, which was good before, but too far behind the current trends in the interface. The new version of WinDbg, fortunately, did not go so far as to get a new-fashioned UWP interface, but the classic ribbon bars in the style of Microsoft Office are very suitable for it. The application is distributed only through the Microsoft Store and work on Win10 with at least Anniversary Update. Microsoft says that this is done for ease of installation and upgrade, but somehow I don’t remember that there was any installation problem with classic WinDbg. Rather, it looks like another way to teach developers and users the habit of using only the most recent version of Windows. Well ok, so be it.
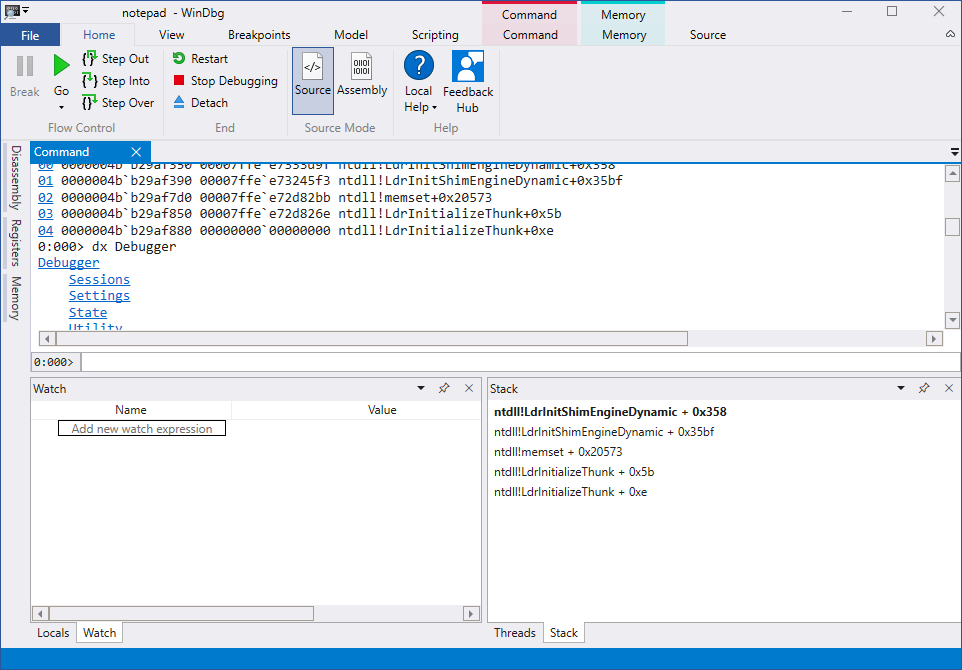
WinDbg looks cute:
')
And all its power in the form of commands, debugging drivers, remote debugging, scripts and other things - remained with him. Moreover, on September 25, an update was released, adding an important feature to the new WinDbg - debugging with the ability to move along the program in the opposite direction (Time Travel Debugging). The opportunity is interesting, because once a programmer is in some invalid state, the programmer often asks the question “How did it happen?”. Previously, it was possible to get an answer to it by either losing commands in the mind in the reverse order, or by restarting debugging over and over again with the addition of logs and new control points. All this took time. Let's see how it works now.
Install WinDbg
We write some small program and compile it. I took the first bubble sorting implementation on the Internet (yes, because I'm lazy).
Now we have a compiled binary, a symbol file for it and a source file. All this is needed for WinDbg.
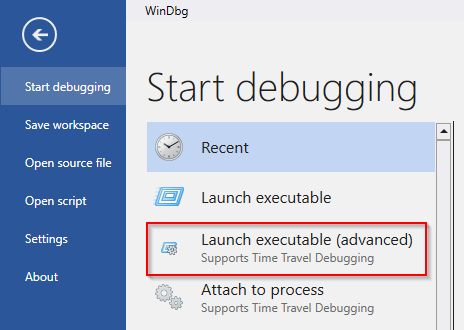
Run WinDbg with administrator privileges (this is important!). Choose File → Start debugging → Launch executable (advanced):
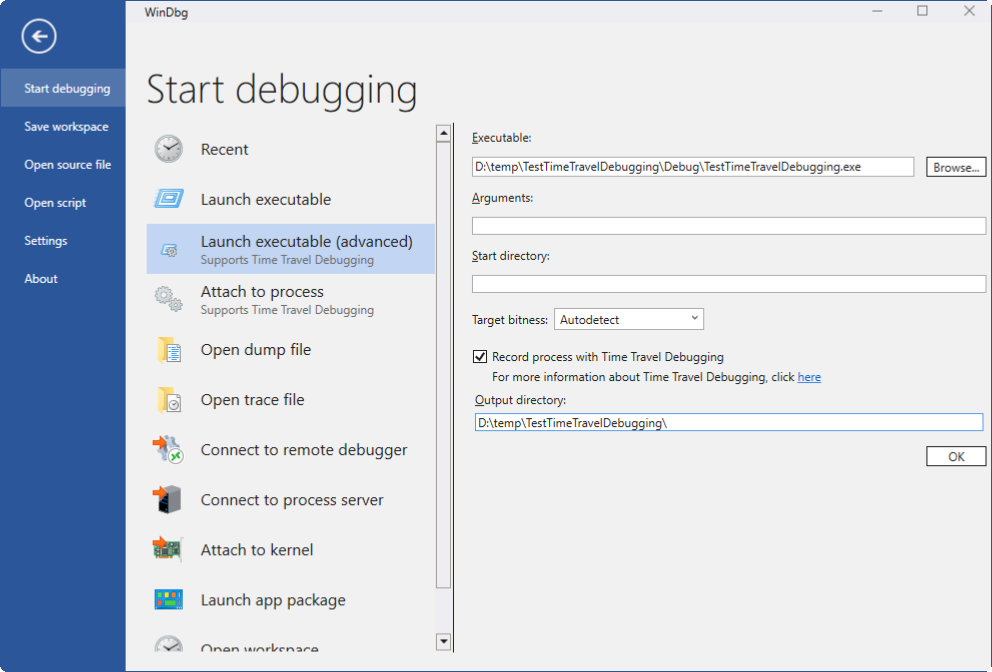
Set the path to the debugged binary, put the checkbox “Record process with Time Travel Debugging”, set the path for saving the recorded execution trace.
We press ok, the program starts, runs and closes. WinDbg saves the recorded execution trace to the specified folder and immediately loads it (this saves debugging time).
Now open the file with the code in WinDbg, set a couple of breakpoints, start debugging. At first glance, everything looks familiar.
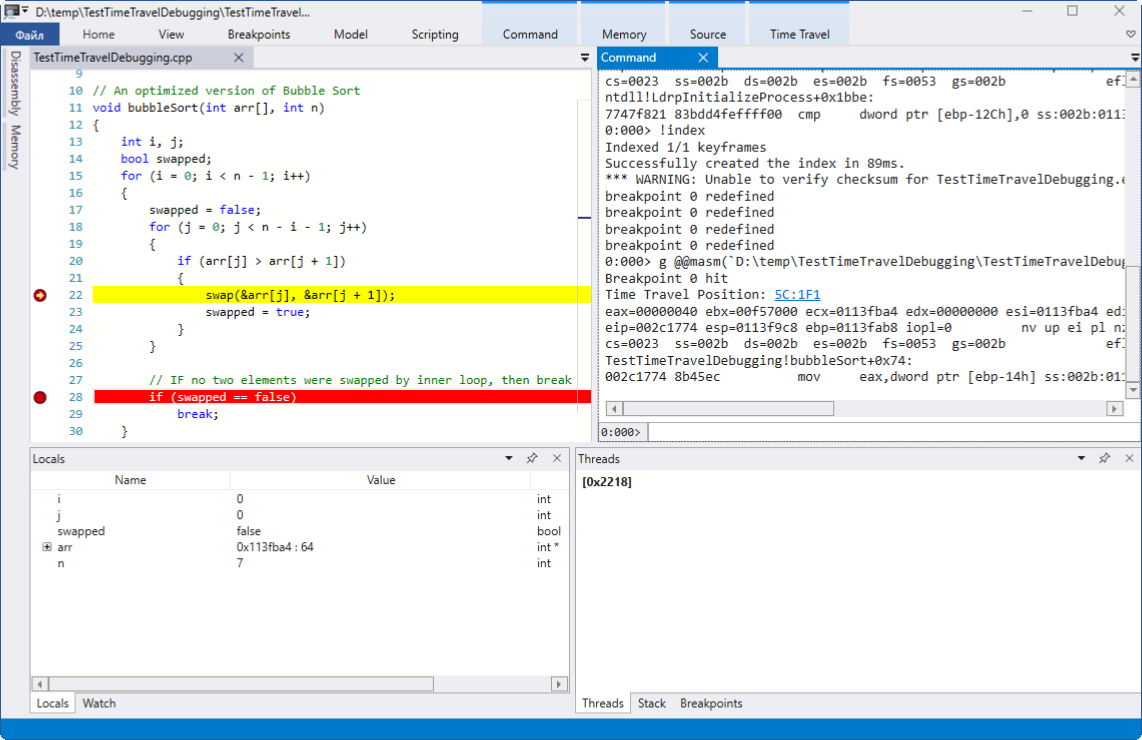
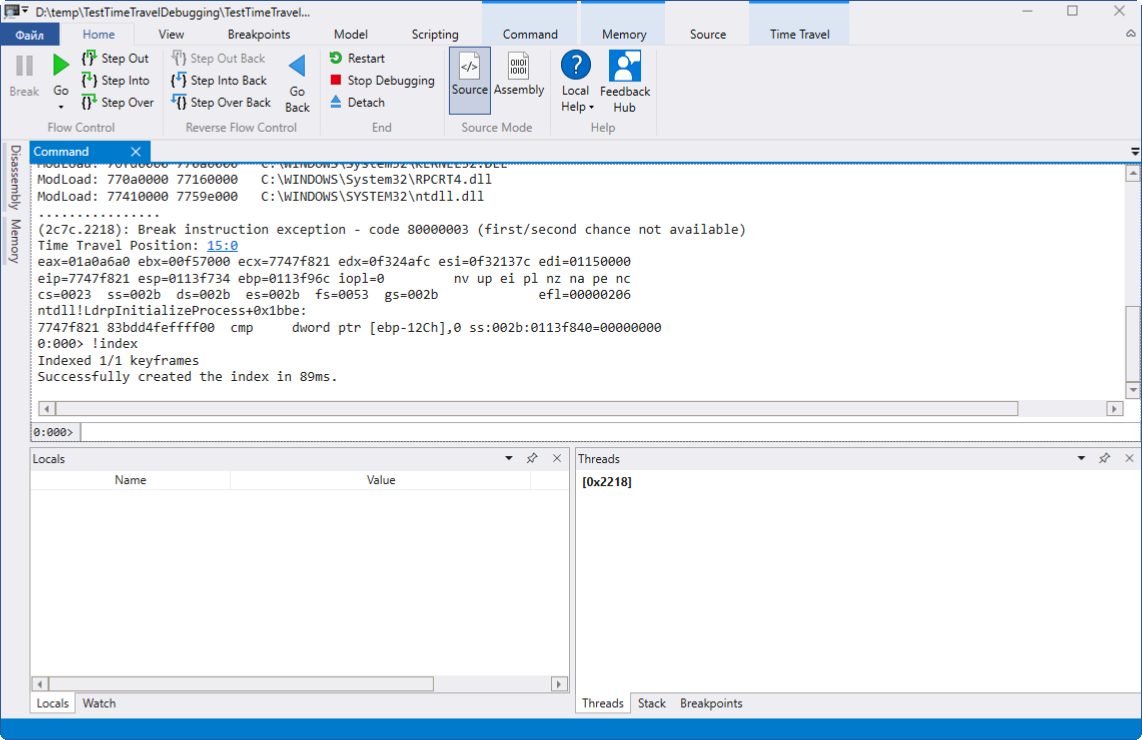
But here it is - the main difference:
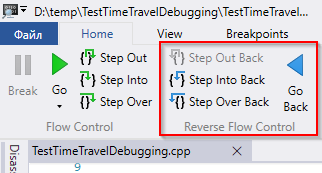
We have access to the reverse direction control block. We can just step back on the line.

We can put a new breakpoint somewhere higher and click “Go back” to get the program back to it.
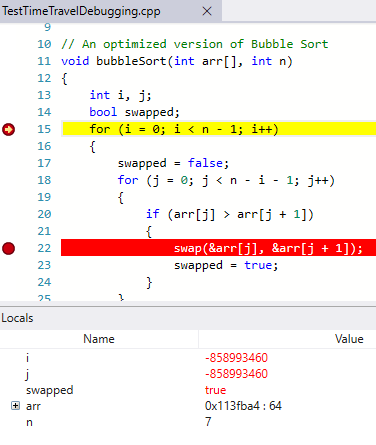
Pay attention - we jumped back in time before the program entered the for loops - and below in the Locals window we already see that the variables i and j still have undefined values at this moment.
We can go back and forth as much as necessary, restart debugging from the very beginning. You can connect to already running processes to record the execution of only certain blocks of code. It is very convenient to catch bugs that are reproduced only occasionally or only in a certain environment, and then scroll through them again and again.
In general, I like the feature.
Materials on the topic:
WinDbg looks cute:
')
And all its power in the form of commands, debugging drivers, remote debugging, scripts and other things - remained with him. Moreover, on September 25, an update was released, adding an important feature to the new WinDbg - debugging with the ability to move along the program in the opposite direction (Time Travel Debugging). The opportunity is interesting, because once a programmer is in some invalid state, the programmer often asks the question “How did it happen?”. Previously, it was possible to get an answer to it by either losing commands in the mind in the reverse order, or by restarting debugging over and over again with the addition of logs and new control points. All this took time. Let's see how it works now.
Install WinDbg
We write some small program and compile it. I took the first bubble sorting implementation on the Internet (yes, because I'm lazy).
Bubble Sort
#include "stdafx.h" void swap(int *xp, int *yp) { int temp = *xp; *xp = *yp; *yp = temp; } // An optimized version of Bubble Sort void bubbleSort(int arr[], int n) { int i, j; bool swapped; for (i = 0; i < n - 1; i++) { swapped = false; for (j = 0; j < n - i - 1; j++) { if (arr[j] > arr[j + 1]) { swap(&arr[j], &arr[j + 1]); swapped = true; } } // IF no two elements were swapped by inner loop, then break if (swapped == false) break; } } /* Function to print an array */ void printArray(int arr[], int size) { int i; for (i = 0; i < size; i++) printf("%d ", arr[i]); } // Driver program to test above functions int main() { int arr[] = { 64, 34, 25, 12, 22, 11, 90 }; int n = sizeof(arr) / sizeof(arr[0]); bubbleSort(arr, n); printf("Sorted array: \n"); printArray(arr, n); return 0; } Now we have a compiled binary, a symbol file for it and a source file. All this is needed for WinDbg.
Run WinDbg with administrator privileges (this is important!). Choose File → Start debugging → Launch executable (advanced):
Set the path to the debugged binary, put the checkbox “Record process with Time Travel Debugging”, set the path for saving the recorded execution trace.
We press ok, the program starts, runs and closes. WinDbg saves the recorded execution trace to the specified folder and immediately loads it (this saves debugging time).
Now open the file with the code in WinDbg, set a couple of breakpoints, start debugging. At first glance, everything looks familiar.
But here it is - the main difference:
We have access to the reverse direction control block. We can just step back on the line.
We can put a new breakpoint somewhere higher and click “Go back” to get the program back to it.
Pay attention - we jumped back in time before the program entered the for loops - and below in the Locals window we already see that the variables i and j still have undefined values at this moment.
We can go back and forth as much as necessary, restart debugging from the very beginning. You can connect to already running processes to record the execution of only certain blocks of code. It is very convenient to catch bugs that are reproduced only occasionally or only in a certain environment, and then scroll through them again and again.
In general, I like the feature.
Materials on the topic:
Source: https://habr.com/ru/post/340744/
All Articles