Monitoring with Prometheus at Kubernetes in 15 minutes

Note trans. : The author of the article, Giancarlo Rubio - DevOps Engineer from the IT company LINKIT (Netherlands) - through the ITNEXT online resource shares a concise recipe for setting up monitoring with Prometheus in Kubernetes using Prometheus Operator. The manual appeared as a consequence of the recent experience of choosing and implementing a proactive monitoring system after the project migration from bare metal to cloud infrastructure. The recipe is great for quick theoretical (first half of the article) and practical (second half) dating. For some teams, the URLs have been fixed, which in the original material appear to have been transformed by the medium engine.
Monitoring the K8s cluster will help your team implement:
')
- proactive monitoring,
- the visibility of the cluster and its employment / performance planning,
- triggers and alerts (alerts),
- panels with metrics.
Not so long ago, CoreOS released Prometheus Operator , which perfectly matched my needs, simplifying the entire initial configuration.
Kubernetes Operator
“Operators we call a new software class. Operator is an application-specific controller that extends the Kubernetes API by creating and configuring instances of complex stateful applications and managing them on behalf of the user Kubernetes. The operator is based on the concepts of a resource and controller in Kubernetes and adds to them knowledge from a specific area or application-specific automation for key tasks. ”
- Brandon Philips from CoreOS.
Operators for Kubernetes were introduced in 2016 and offer the opportunity to abstract the deployment and configuration of applications. I myself managed to actively work with the elasticsearch-operator and prometheus-operator . A detailed description of the operators for Kubernetes is not included in the objectives of the article, and all those interested are invited to familiarize themselves with the list of other available operators here .
Note trans. : more about operators for Kubernetes and their use for working with stateful applications we wrote in this article .
Prometheus
Prometheus is an open source set of monitoring and notification utilities created under the inspiration of Google Borg Monitor. Its development began in SoundCloud, and then transferred to the CNCF foundation. ( Note : the story of the emergence of Prometheus, we recently wrote in this article .)
Prometheus supports applications in many programming languages . Being an excellent solution for monitoring infrastructure and applications, it also offers ready-made integration for connecting well-known applications (including PostgreSQL, MySQL, AWS Cloudwatch, etcd, K8s, etc.) in the form of exporters .
Prometheus Operator
“The mission of Prometheus Operator is to make launching Prometheus over Kubernetes as simple as possible, while maintaining configurability and implementing the configuration in the native Kubernetes form.”
- Getting Started Guide by Prometheus Operator.
Prometheus Operator offers simple monitoring for services and deployments in K8s, as well as management of Prometheus, Alertmanager and Grafana settings (for details, see below) .
How it works?
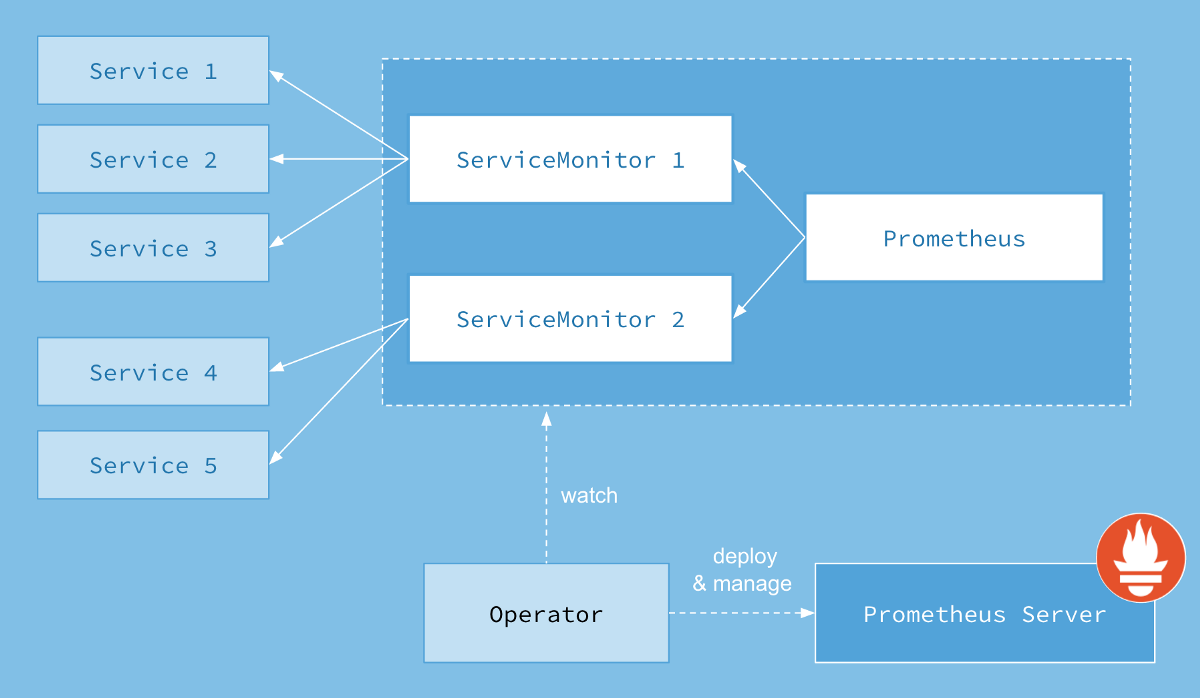
Architecture Prometheus Operator. Source: GitHub
When you deploy a new version of the application, K8s creates a new one and, when this one is ready, destroys the old one. Prometheus constantly monitors the Kubernetes API and, when it detects changes, creates a new configuration of Prometheus, guided by changes in services (subflows).
ServiceMonitor
Prometheus Operator uses a Custom Resource Definition (CRD) called ServiceMonitor to abstract the configuration. In the example below, you can see how to use ServiceMonitor to monitor under nginx. ServiceMonitor selects under nginx using the matchLabels selector . Prometheus Operator searches for tags that match the label selector and creates a target from which Prometheus will collect metrics.
apiVersion: monitoring.coreos.com/v1 kind: ServiceMonitor metadata: name: nginx spec: selector: matchLabels: app: nginx namespaceSelector: matchNames: - default endpoints: - port: web interval: 30s Try it yourself
Further instructions can be completed in less than 15 minutes if you already have:
- Raised and working cluster Kubernetes.
- Installed and working Helm .
helm list.
Installation
1. Create a namespace and clone the prometheus-operator Git repository:
$ kubectl create ns monitoring $ git clone https://github.com/coreos/prometheus-operator.git $ cd prometheus-operator 2. Install the prometheus-operator deployment:
$ helm install --name prometheus-operator \ --set rbacEnable=true --namespace=monitoring helm/prometheus-operator 3. Install Prometheus and Alertmanager specs, as well as Grafana deployment:
$ helm install --name prometheus --set serviceMonitorsSelector.app=prometheus \ --set ruleSelector.app=prometheus --namespace=monitoring helm/prometheus $ helm install --name alertmanager --namespace=monitoring helm/alertmanager $ helm install --name grafana --namespace=monitoring helm/grafana 4. Install kube-prometheus to download the predefined k8s exporters and serviceMonitors:
$ helm install --name kube-prometheus --namespace=monitoring helm/kube-prometheus If everything went well, you can run this command to display a list of applications:
$ kubectl get pods -n monitoring NAME READY STATUS RESTARTS AGE alertmanager-alertmanager-0 2/2 Running 0 3m grafana-grafana-3066287131-brj8n 2/2 Running 0 4m kube-prometheus-exporter-kube-state-2696859725-s8m56 2/2 Running 0 3m kube-prometheus-exporter-node-029w0 1/1 Running 0 3m kube-prometheus-exporter-node-n3txz 1/1 Running 0 3m kube-prometheus-exporter-node-q2rk3 1/1 Running 0 3m prometheus-operator-prometheus-operator-514889780-qm3fp 1/1 Running 0 4m prometheus-prometheus-0 2/2 Running 0 3m Prometheus
Flip the Prometheus server onto your computer to access the panel via
http://localhost:9090 : $ kubectl port-forward -n monitoring prometheus-prometheus-0 9090 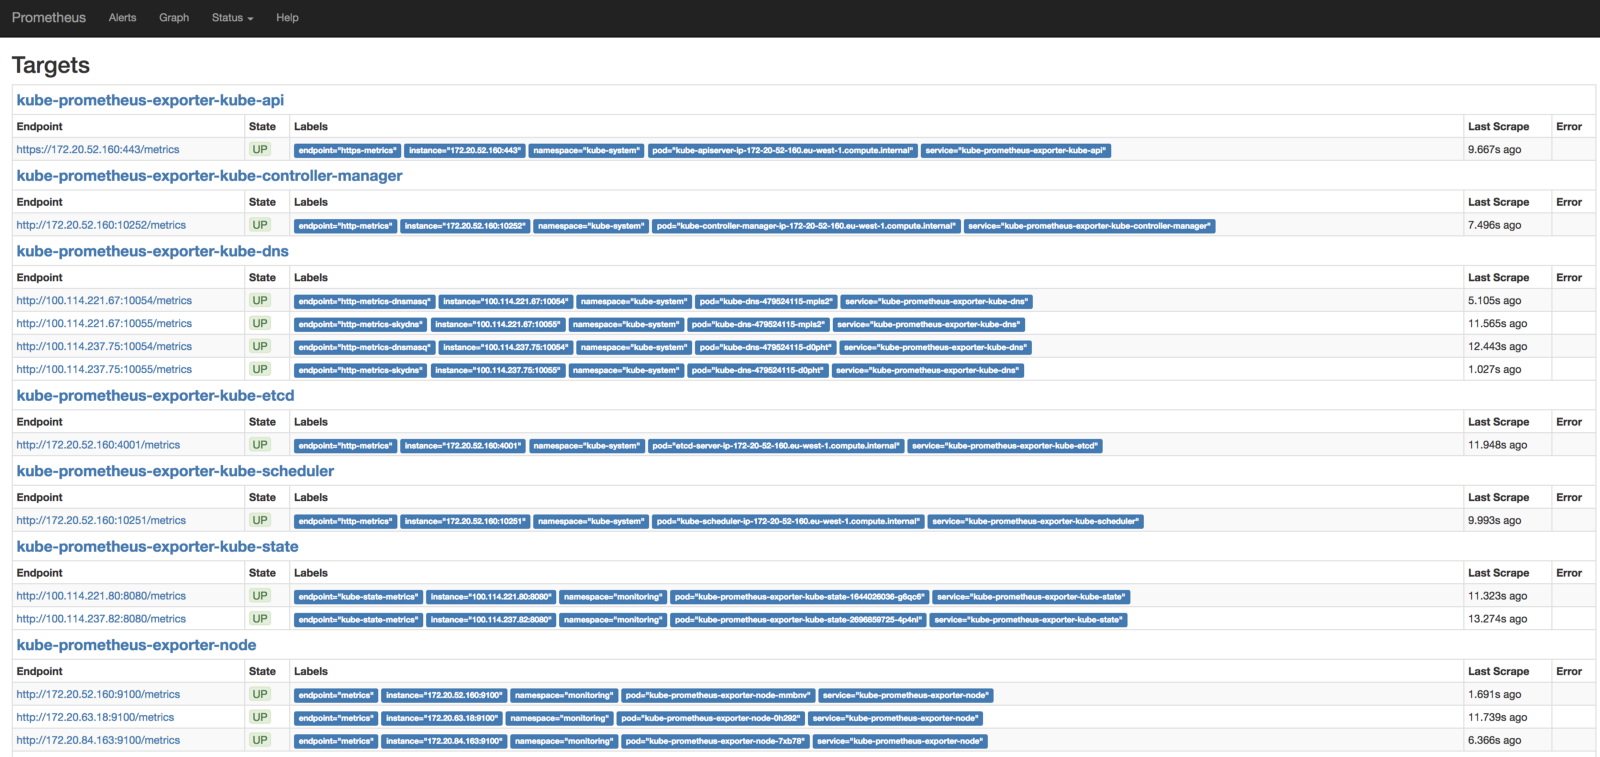
In the Prometheus panel, you can query the metrics, view the predefined notifications and target objects of Prometheus.
Note : If any targets return an unavailable error, check the security groups and firewall rules. If you do not have the goals shown in the screenshot above, check out the K8s pod labels, because sometimes the utilities used to deploy a cluster do not install them.
Please note (# 2) : In the project, a prometheus-operator is working on packaging standard notifications for K8s in the Helm chart. However, now to download them you need to follow the sequence of the commands below (in the future this need will disappear):
$ sed -ie 's/role: prometheus-rulefiles/app: prometheus/g' contrib/kube-prometheus/manifests/prometheus/prometheus-k8s-rules.yaml $ sed -ie 's/prometheus: k8s/prometheus: prometheus/g' contrib/kube-prometheus/manifests/prometheus/prometheus-k8s-rules.yaml $ sed -ie 's/job=\"kube-controller-manager/job=\"kube-prometheus-exporter-kube-controller-manager/g' contrib/kube-prometheus/manifests/prometheus/prometheus-k8s-rules.yaml $ sed -ie 's/job=\"apiserver/job=\"kube-prometheus-exporter-kube-api/g' contrib/kube-prometheus/manifests/prometheus/prometheus-k8s-rules.yaml $ sed -ie 's/job=\"kube-scheduler/job=\"kube-prometheus-exporter-kube-scheduler/g' contrib/kube-prometheus/manifests/prometheus/prometheus-k8s-rules.yaml $ sed -ie 's/job=\"node-exporter/job=\"kube-prometheus-exporter-node/g' contrib/kube-prometheus/manifests/prometheus/prometheus-k8s-rules.yaml $ kubectl apply -n monitoring -f contrib/kube-prometheus/manifests/prometheus/prometheus-k8s-rules.yaml Grafana
For debugging purposes, Prometheus has an expression browser . To get a beautiful panel, use Grafana with the built-in ability to perform queries in Prometheus.
Note : In the project, the prometheus-operator is working on creating a simple deployment for Grafana, probably using the new CRD . At the moment, to configure it, you need to run the following commands (in the future, this need will disappear):
$ sed -ie 's/grafana-dashboards-0/grafana-grafana/g' https://raw.githubusercontent.com/coreos/prometheus-operator/master/contrib/kube-prometheus/manifests/grafana/grafana-dashboards.yaml $ sed -ie 's/prometheus-k8s.monitoring/prometheus-prometheus.monitoring/g' https://raw.githubusercontent.com/coreos/prometheus-operator/master/contrib/kube-prometheus/manifests/grafana/grafana-dashboards.yaml $ kubectl apply -n monitoring -f https://raw.githubusercontent.com/coreos/prometheus-operator/master/contrib/kube-prometheus/manifests/grafana/grafana-dashboards.yaml $ kubectl port-forward -n monitoring $(kubectl get pods --selector=app=grafana-grafana -n monitoring --output=jsonpath={.items..metadata.name}) 3000 Wait a few seconds while Grafana downloads the data, open
http://localhost:3000 in your browser and learn some great graphics!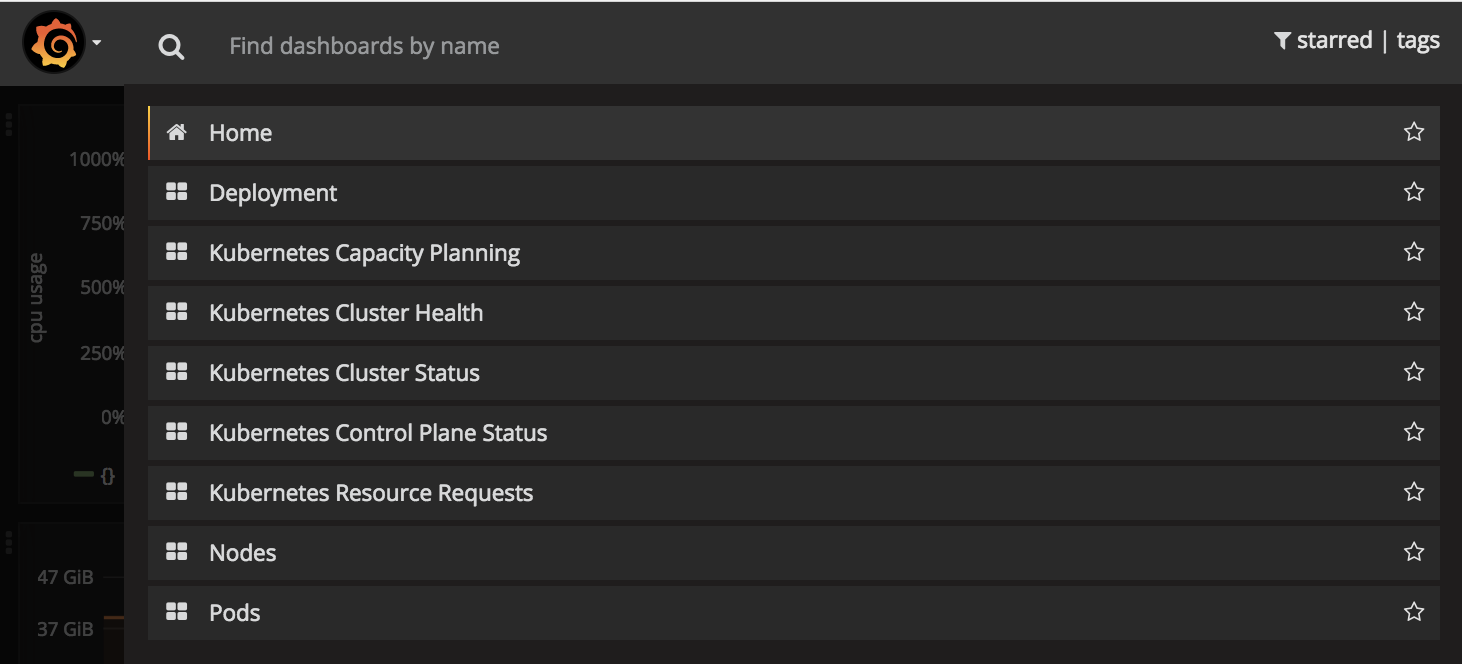
Grafana: available dashboards for Kubernetes
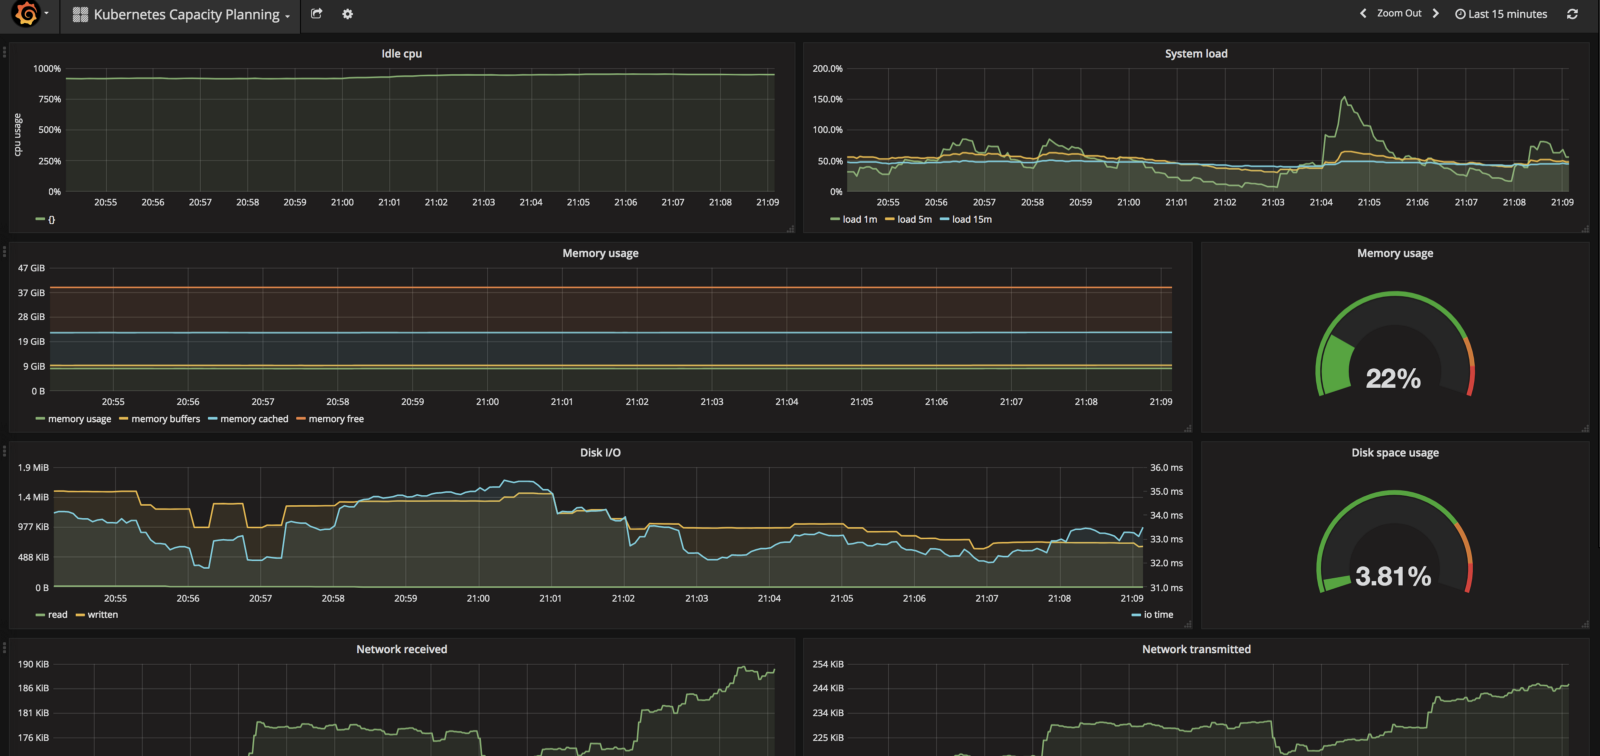
Grafana: graphics for employment / productivity planning Kubernetes
Alertlerman
Alertmanager serves notifications sent by client applications like the Prometheus server. It provides duplicate elimination, grouping, sending to the correct recipient service like email, PagerDuty or OpsGenie. He is also responsible for silence and inhibit notifications.
We have already installed Alertmanager with the commands above, and it remains to forward the service port to your computer, after which you can open
http://localhost:9093 in a web browser: $ kubectl port-forward -n monitoring alertmanager-alertmanager-0 9093 Is done
All K8s components are added to monitoring. I also recommend watching this video on YouTube to better understand how the prometheus-operator works.
PS from translator
The author also promises to tell in his next article about setting up notifications using Alertmanager. Her appearance can be expected here .
Read also in our blog:
- “ Monitoring and Kubernetes (review and video of the report) ”;
- " Our experience with Kubernetes in small projects " (video of the report, which includes an introduction to the technical device Kubernetes);
- “ Getting started in Kubernetes using Minikube ” (translation) ;
- “ Kubernetes success stories in production. Part 4: SoundCloud (by Prometheus) . ”
Source: https://habr.com/ru/post/340728/
All Articles