Search memory leaks in applications on .NET Core under Linux
.NET Core is becoming more and more mature platform. It is already quite comfortable to develop it using the same Rider or VS Code.
However, everything is not smooth there. For example, debugging code on .NET Core 2 worked only in Rider 2017.2, which was released just a few days ago (there were more EAP builds). Had to use VS Code. Debugging works in it, however, in order for the tests to start running, you need to manually install the beta version of the extension for C # .
I think the essence is clear that the instrumental support is still far from similar when developing under Windows.
For some things, there are no ready-made tools yet. For example, for profiling.
From the sources that are available on the web, the most informative, in my opinion, are currently the articles of Sasha Goldstein:
- Analyzing a .NET Core Core Dump on Linux
- Profiling a .NET Core Application on Linux
- Tracing Runtime Events in .NET Core on Linux
- Tracing .NET Core on Linux with USDT and BCC
However, I could not find a ready-made recipe for finding a memory leak. So I decided to describe the method I found.
How would we act under Windows
Personally, I would, without hesitation, connect to a running application using dotMemory, take 2 snapshots over a period of time and compare them using a nice GUI.
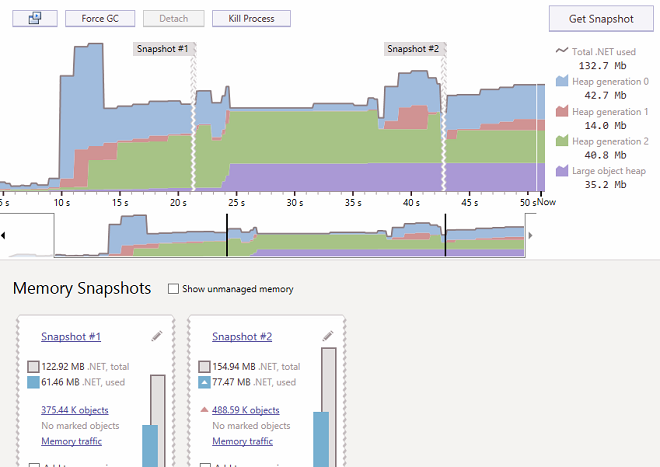
How great it would be if under Linux we could do something similar.
Let's try.
An example that will be considered
There is nothing difficult. Of course, you do not need to resort to any tools to find a leak in the following code. But for educational purposes will fit.
using System; namespace leak_example { class Program { static void Main(string[] args) { Function1(); } private static void Function1() { var leakClass = new LeakClass(); leakClass.DoWork(); } } } using System.Collections.Concurrent; using System.Threading.Tasks; namespace leak_example { public class LeakClass { private BlockingCollection<string> _collection; public LeakClass() { _collection = new BlockingCollection<string>(new ConcurrentQueue<string>()); } public void DoWork() { while(true) { _collection.Add(System.Guid.NewGuid().ToString()); Thread.Sleep(20); } } } } How to make a snapshot of a running Linux application
It’s easy to make a similar snapshot (core dump) under Linux for a running application. The following 2 commands do this:
$ ulimit -c unlimited $ sudo gcore -o dump1 $(pidof dotnet) And after a while we do the second snapshot
$ sudo gcore -o dump2 $(pidof dotnet) We received 2 dumps of our application:
$ ls -lah dump* -rw-r--r-- 1 root root 5,7G 18 17:01 dump1.13486 -rw-r--r-- 1 root root 6,2G 18 17:03 dump2.13486 which we can now try to compare.
How in theory to glance in snapshot .NET Core applications
Microsoft provides a plugin for LLDB that can help us with this. This is a ported SOS extension from WinDBG with a similar set of commands.
In theory, to view memory allocations, having the snapshot obtained above, we would have to execute the following commands:
$ lldb $(which dotnet) --core <dump> (lldb) plugin load libsosplugin.so (lldb) sos DumpHeap -stat Sasha Goldstein’s articles still set the path to the CLR with the command
(lldb) setclrpath /usr/share/dotnet/shared/Microsoft.NETCore.App/2.0.0 But to investigate the problems with the Debug build of my test application, I didn’t need it.
Harsh reality
Microsoft ships
libsoplugin.sowith .NET Core. So, most likely you have it in the system.As Sasha wrote in his article, unfortunately, this plugin is linked with a specific version of LLVM. Accordingly, a specific version of LLDB is required to use it.
View a specific version, it will not work as before, using the
lddcommand:$ ldd /usr/share/dotnet/shared/Microsoft.NETCore.App/2.0.0/libsosplugin.so linux-vdso.so.1 => (0x00007ffc31dcb000) libstdc++.so.6 => /usr/lib/x86_64-linux-gnu/libstdc++.so.6 (0x00007f65b93bb000) libm.so.6 => /lib/x86_64-linux-gnu/libm.so.6 (0x00007f65b90b2000) libgcc_s.so.1 => /lib/x86_64-linux-gnu/libgcc_s.so.1 (0x00007f65b8e9c000) libc.so.6 => /lib/x86_64-linux-gnu/libc.so.6 (0x00007f65b8ad2000) /lib64/ld-linux-x86-64.so.2 (0x00007f65b994e000)The fact is that
liblldd.soin different distributions was called differently and was removed from explicit dependencies .In some of the issues on GitHub there is information that in .NET Core 2.0 this plugin is compiled from lldb-3.8, and the version in .NET Core 2.0.1 will already be compiled from lldb-3.9.
It would seem that now we know the version and can simply put the correct version in the lldb system. But no. The fact is that lldb before version 4.0 could not load on-demand core dump. Just as we did (in the process of the program).
- So it turns out that we have 2 paths, either build a plugin for lldb-4.0, or patch it and build it on lldb-3.8 itself. I went the first way.
Build libsoplugin with lldb-4.0
Fortunately, we only need the plugin. No need to use custom .NET Core, etc. The plugin will be used directly from the folder in which we collect it, so that the system does not litter.
Actually, in the CoreCLR repository there are instructions for building under Linux. We'll just tweak them a bit to use lldb-4.0.
I use Ubuntu 16.04. For other distributions, the command set may differ slightly.
We put the necessary tools for assembly:
$ sudo apt install cmake llvm-4.0 clang-4.0 lldb-4.0 liblldb-4.0-dev libunwind8 libunwind8-dev gettext libicu-dev liblttng-ust-dev libcurl4-openssl-dev libssl-dev uuid-dev libnuma-dev libkrb5-devClone repository:
$ git clone https://github.com/dotnet/coreclr.git $ git checkout release/2.0.0Apply the following patch:
diff --git a/src/ToolBox/SOS/lldbplugin/CMakeLists.txt b/src/ToolBox/SOS/lldbplugin/CMakeLists.txt index fe816ab..ef9846d 100644 --- a/src/ToolBox/SOS/lldbplugin/CMakeLists.txt +++ b/src/ToolBox/SOS/lldbplugin/CMakeLists.txt @@ -76,6 +76,7 @@ endif() find_path(LLDB_H "lldb/API/LLDB.h" PATHS "${WITH_LLDB_INCLUDES}" NO_DEFAULT_PATH) find_path(LLDB_H "lldb/API/LLDB.h") +find_path(LLDB_H "lldb/API/LLDB.h" PATHS "/usr/lib/llvm-4.0/include") find_path(LLDB_H "lldb/API/LLDB.h" PATHS "/usr/lib/llvm-3.9/include") find_path(LLDB_H "lldb/API/LLDB.h" PATHS "/usr/lib/llvm-3.8/include") find_path(LLDB_H "lldb/API/LLDB.h" PATHS "/usr/lib/llvm-3.7/include")Putting CoreCLR:
$ ./build.sh clang4.0
Hurray, we got a working plugin for lldb-4.0.
We apply the theory in practice
Open our snapshot in lldb:
sudo lldb-4.0 $(which dotnet) --core ./dump1.13486Load the assembled plugin:
(lldb) plugin load /home/user/works/coreclr/bin/Product/Linux.x64.Debug/libsosplugin.soDumping heap usage statistics:
(lldb) sos DumpHeap -stat Statistics: MT Count TotalSize Class Name 00007fe36870b4c8 1 24 System.Collections.Generic.GenericEqualityComparer`1[[System.Int32, System.Private.CoreLib]] 00007fe3686efea8 1 24 System.Threading.AsyncLocalValueMap+EmptyAsyncLocalValueMap ... 00007fe367cf7038 1 131096 System.Collections.Concurrent.ConcurrentQueue`1+Segment+Slot[[System.Threading.IThreadPoolWorkItem, System.Private.CoreLib]][] 00007fe3686dcec8 19898 477552 System.Threading.TimerHolder 00007fe3686bfc70 19898 477552 System.Threading.Timer 00007fe3686dcd18 16261 650440 System.Threading.QueueUserWorkItemCallback 00007fe3686c4430 19898 1751024 System.Threading.TimerQueueTimer 00007fe3686bfbb8 19898 2228576 System.Threading.Tasks.Task+DelayPromise 00007fe367d08498 19 268435400 UNKNOWN 0000000001b465a0 3069079 449192802 Free 00007f53bc74b460 13903273 1362548770 System.String Total 17068427 objectsThe first column is the address of the method table for objects of this class, the second is the number of allocated objects of this class, the third is the number of allocated bytes, the fourth is the name of the class.
According to the conclusion is not difficult to guess who flows.
We get the stack in which the object is created (commands can be executed sooo long):
(lldb) sos DumpHeap -mt 00007f53bc74b460 ... 00007f539d0712c0 00007f53bc74b460 98 00007f539d071420 00007f53bc74b460 98 00007f539d071580 00007f53bc74b460 98 00007f539d0716e0 00007f53bc74b460 98 00007f539d071840 00007f53bc74b460 98 00007f539d0719a0 00007f53bc74b460 98 00007f539d071b00 00007f53bc74b460 98 00007f539d071c60 00007f53bc74b460 98 00007f539d071dc0 00007f53bc74b460 98 00007f539d071f20 00007f53bc74b460 98 00007f539d072080 00007f53bc74b460 98 00007f539d0721e0 00007f53bc74b460 98 00007f539d072340 00007f53bc74b460 98 00007f539d0724a0 00007f53bc74b460 98 00007f539d072600 00007f53bc74b460 98 00007f539d072760 00007f53bc74b460 98 00007f539d0728c0 00007f53bc74b460 98 00007f539d072a20 00007f53bc74b460 98 00007f539d072b80 00007f53bc74b460 98 ...We get a huge table in which the first column is the address of the instance of this class, the second is the address of the method table, the third is the size of the instance in bytes.
Select an instance and execute the command:
(lldb) sos GCRoot 00007f539d072b80 Thread 4303: 00007FFC92921910 00007F53BC9C0E30 leak_example.LeakClass.DoWork() [/home/ilya/works/trading/leak-example/LeakClass.cs @ 18] rbp-48: 00007ffc92921918 -> 00007F539D072B80 System.String 00007FFC92921910 00007F53BC9C0E30 leak_example.LeakClass.DoWork() [/home/ilya/works/trading/leak-example/LeakClass.cs @ 18] rbp-40: 00007ffc92921920 -> 00007F5394014878 <error> -> 00007F5394014530 <error> -> 00007F53984B4A10 <error> -> 00007F53A47E35F0 <error> -> 00007F539D072B80 System.String Found 2 unique roots (run '!GCRoot -all' to see all roots).And as we see, we are pointed at the line
_collection.Add(System.Guid.NewGuid().ToString());in the source file.
Snapshot comparison
Since I started talking about comparing snapshots, I’ll have to somehow compare them.
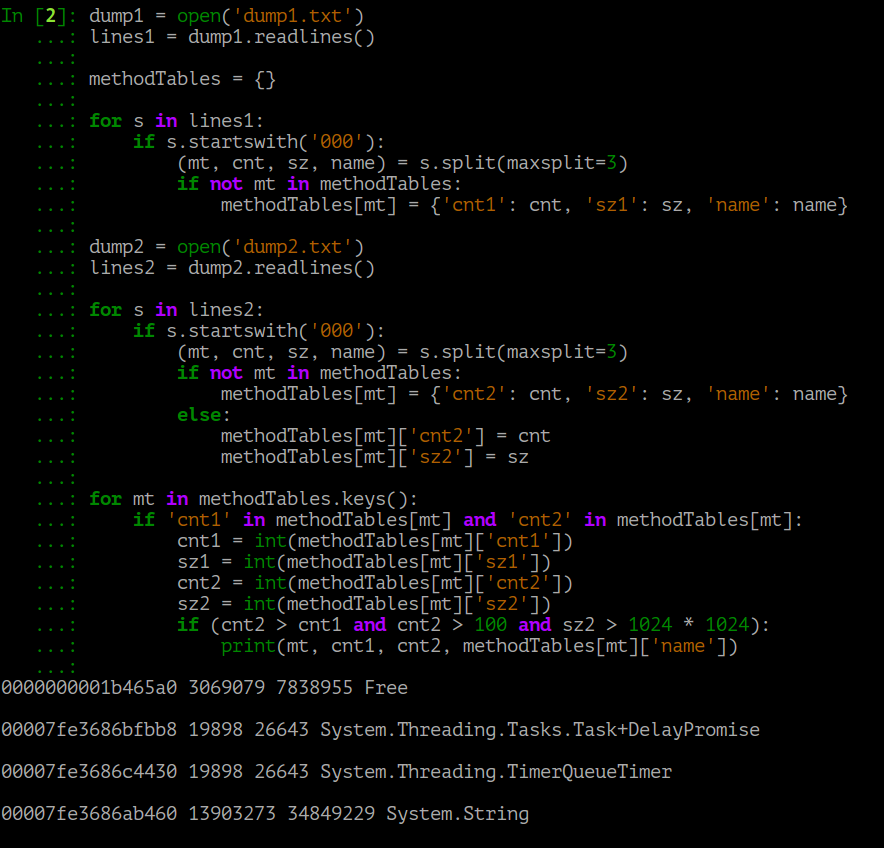
dump1.txt dump2.txt output of sos DumpHeap -stat for both snapshots to dump1.txt and dump2.txt files (I just copied from the console), I processed them with such a simple script (in fact, I wrote directly to the iPython console, so this isn’t is very similar):
dump1 = open('dump1.txt') lines1 = dump1.readlines() methodTables = {} for s in lines1: if s.startswith('000'): (mt, cnt, sz, name) = s.split(maxsplit=3) if not mt in methodTables: methodTables[mt] = {'cnt1': cnt, 'sz1': sz, 'name': name} dump2 = open('dump2.txt') lines2 = dump2.readlines() for s in lines2: if s.startswith('000'): (mt, cnt, sz, name) = s.split(maxsplit=3) if not mt in methodTables: methodTables[mt] = {'cnt2': cnt, 'sz2': sz, 'name': name} else: methodTables[mt]['cnt2'] = cnt methodTables[mt]['sz2'] = sz for mt in methodTables.keys(): if 'cnt1' in methodTables[mt] and 'cnt2' in methodTables[mt]: cnt1 = int(methodTables[mt]['cnt1']) sz1 = int(methodTables[mt]['sz1']) cnt2 = int(methodTables[mt]['cnt2']) sz2 = int(methodTables[mt]['sz2']) if (cnt2 > cnt1 and cnt2 > 100 and sz2 > 1024 * 1024): print(mt, cnt1, cnt2, methodTables[mt]['name']) Having received as a result, a list of "hot spots" that are worth paying attention to:
Conclusion
I hope this improvised way of searching for memory leaks will be useful to someone.
An attentive reader, of course, will notice that it would be nice to automate the entire process using lldb scripts. But so far I have no time for it. It was not possible to immediately solve the problem with the fact that python-lldb-4.0 installed from the repository refuses to load libsoplugin.so . Perhaps someone else will move on.
Thanks for attention!
')
Source: https://habr.com/ru/post/340516/
All Articles