C / C ++ code profiling on * nix-systems

Alexander Alekseev ( Postgres Professional )
An excellent overview report of the HighLoad ++ 2016 conference on how to program code profiling. About the typical errors occurring in the measurements. And, of course, about the tools:
- gettimeofday
- strace, ltrace, truss
- gprof
- gdb / lldb
- perf
- pmcstat
- SystemTap
- DTrace
- HeapTrack
- BPF / bcc
')
In the beginning I will have a not too technical part, on how not to do benchmarks.
I observe that people often make common mistakes when they make benchmarks. And the first of them ...
If you do not know, then all speakers of HighLoad ++ undergo severe coaching, multiple, for different vectors. One coaching is required, the rest are optional. Optional coaching - this is how to overcome the fear of the scene, for example. That is a very harsh approach to the organization of this whole business. And when I submitted a report on HighLoad ++, the organizers suggested removing all this technical part and adding more coolstory, beautiful screenshots, and so on. And those who are interested in how to run it, which teams to type, can refer to the documentation - and that's why - a link to my blog , because everything is there.In the beginning I will have a not too technical part, on how not to do benchmarks.
If you are interested in, for example, how SystemTap is going to be difficult on Linux, then open the link to the blog and everything will be right there. And in this report there will be more of such a review, so that you can imagine what tools are in general, what they give and when to use which one.
I observe that people often make common mistakes when they make benchmarks.
- First, it is unrepeatability. When you open a blog, and there is such a cool article that we “have measured something, got such beautiful graphics, and our solution, which is worth it, makes it 500 times faster.” No data is given to repeat this experiment, no scripts, and nothing. Well, it's a bad benchmark, and you need to close this page right away. If you can't repeat it, how can you believe it?
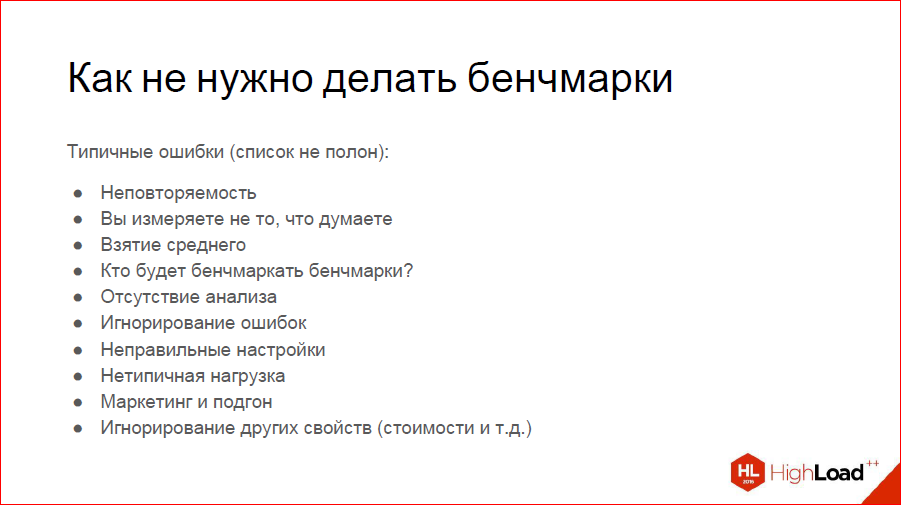
You should be able to reproduce at least approximately the same results.
- You measure not what you think. A typical example: we want to measure how our hard disk works. We have fun typing dd if something somewhere. We write to disk and measure, and how quickly he actually writes. Can anybody in the audience say why this is not a disc speed measurement?
That's right - because in fact you have measured the speed with which your file system cache works. How to get around this is also an interesting problem. - Taking the average. It always enraged me at our meetings, and I see in the first row a listener who understands me. We need to understand how quickly we respond to user requests - let's build a graph of the average response time. The problem is that on this graph there can be an average beautiful time - 15 milliseconds, but there are peaks for 15 seconds. They can be very rare, and this taking of the average lubricates them. You think that everything is great and wonderful with you, in fact it is not. Therefore, build at least medium and maximum - this will give you a good picture. If it’s too easy for you, build Perceptyl, 95th, 99th, it will give you an even better idea. They are not very cheap to build, but, in principle, solved.
- Who will benchmark benchmarks? This is such a problem. For example, you wrote a cool test that measures how many answers per second your application generates. We measured, received, say, 4000 requests per second. You think: "Somehow not enough, it is necessary to optimize." The problem is that your benchmark is single threaded. And under real load, your application runs in hundreds, in thousands of threads. And, in fact, you did not take into account that your own benchmark is a bottleneck in this case. This needs to be understood.
- Lack of analysis. This is when you have fallen down, say: "Something stupid, you need to do everything, rewrite everything." That is, you need to understand why it is stupid.
- Ignoring errors. Again, let's go back to the example with your benchmark. Suppose this is not your benchmark, this is A / B, and you set it on your service, measured it, received 5 million requests per second, and rejoice: “Everything is very fast here.” But you did not see that all these are 404 answers, for example. That is, you also need to calculate errors.
- Incorrect settings. In my field, in databases, this is a frequent problem, because the default Postgres settings assume that you are trying to run it in a microwave. Now the servers are powerful, so all the default settings should be changed very much. Get plenty of buffers, more work_mem. And understand what these settings do. If you see a benchmark, even with the data on which it was tested, and even with scripts, but it says that "we tested with the default settings" - by default MongoDB and Postgres - everything can be closed. The default settings are a non-constructive way to understand what is faster.
- Atypical load. You read something 90% of the time, 10% write something, and you decide: we will write a benchmark, which is the FIFT / FIFT - and so, and so it does. Why test this? That is, you are optimizing something, it just won't help you much in the product.
- Marketing and customization. Here I have a small cool story. I reliably know that there were years ... twenty years ago such iron producers who knew benchmarks for which a certain magazine was testing computers. They collected their iron so that it looked good on these benchmarks. As a result, everything was sold very well. This is the first way to fit.
Another way of adjusting - we can give MongoDB. They always chase their benchmarks on small DataSets, so everything fits in their memory, it works great. When your DataSet stops storing in memory, everything stops working great.
That is, you need to understand that it exists, it is not an illusory thing. - Well, and other properties. Close example: Oracle vs. Postgres - which is faster? Maybe Oracle is 10 times faster, but it stands as if not in itself. This must also be taken into account. Or maybe not - I have never been a benchmark for Oracle, and have never seen it at all, to be honest.

To create a complete picture, I’ll start by not having to benchmark the code. The easiest way is gettimeofday (). The grandfather's method, when we have a piece of code, we want to know how fast or slow it is - we measured the time at the beginning, executed the code, measured the time at the end, counted the delta and concluded that the code runs for so long.

In fact, it is not the most idiotic way, it is convenient, for example, when you have this code sometimes tupit, that is, very rarely - once per 10,000 requests, for example. Plus, it is not as expensive as it is customary to think that you do not have a system call, as you might think. In Linux, this mechanism is called VDSO. In fact, you have a page in the kernel that is mapped into the address space of all processes, and your gettimeofday () turns into a memory access, no syscall occurs.
You should not use it, despite the fact that it is cheap, if you are doing something with backslips. Because spinlok themselves work pretty quickly. That is, what you measure should be at least a millisecond, otherwise your error will be at the measurement level.

Tools like strace, ltrace, truss are cool tools, they have a -c checkbox that shows how much time you have which syscalls have been running. Well, ltrace measures library routines, and strace syscalls, but also, in principle, can be useful somewhere in some tasks. I can not say that I often use it.

Gprof, there is such a cool tool, on the slide is an example of its text report. It is also clear - here we have procedures in the program, so many times they were called, so much time this was done as a percentage. A simple, visual report, if you wrote a micro-benchmark, you can use it.
With gprof, you can still generate these images:

This is rather an example of how not to do. Memorize this picture, here are 6 squares. Pay attention to how much space they occupy, here the names of the procedures, something is always written above the arrows, nothing is clear - it takes up a lot of space. We will see much more visual reports than this. But, in principle, a beautiful picture, it is possible for the authorities to show, pontatsya.

Debuggers In fact, this is already an example of the tools that have to be used in practice when profiling, because they have cool properties to execute batch commands and you can write backtrace to this set of batch commands (bt). This is very useful when debugging lock contention, when you have a struggle for locks.

http://habr.ru/p/310372/
Here I have a little cool story. This, in my opinion, was the very first patch I wrote for Postgres. Or second, I do not remember. Postgres has its own implementation of hash tables, strongly sharpened for Postgres tasks. And it, including, can be created with such flags to be used by different processes. The client came with the problem that "here I have on such and such requests, in such and such a scheme everything is stupid, help me." Interestingly, at first, with the aid of a back-rake receiver, it looked like you run gdb 10 times, in 5 cases you have a back-rack hanging on a lock, and in half of the cases on something else, that is, you obviously have a process hanging on lock, something is wrong.
By the way, we posted in open access the video of the last five years of the conference of developers of high-loaded systems HighLoad ++ . Watch, learn, share and subscribe to the YouTube channel .
By backtracking, it was possible to find out what kind of code this is, which then takes, then releases the lock. This is a long story, you can follow the link to read the article on Habré. There is also a link to the discussion in the hackers, where there are technical details.
On the slide above - a piece of code, between taking and releasing the lock, he, in his turn, was falling somewhere in the dynahash, where he was spinning on taking the spinlock. This was possible with the help of debuggers to find, fix, suggest a patch. And that spinlock, which is in dynahash (this is a hash plate in Postgres), was turned into 8 or 16 spin locks, which under certain conditions are taken different. I managed to get it shuffled and it already exists in 9.6.

Perf is a great tool because perf top shows top procedures. In this case, in the specified process, how much time they run. At the top we see 30%, 20% and we see ResourceOwner - this is not without reason in the names of the procedures, because the next coolstory is also about the real patch.

A client came and said: “I have such requests and such a scheme. All tupit. What to do?". Started debugging. And he has an enterprise application, he has tables, a thousand child tables (in Postgres, if anyone does not know, there is table inheritance). And with the help of perf top, we see that everything is dying in ResourceOwner. ResourceOwner is such an object (as far as the word object is applicable for the C language), which stores various resources, files, memory, and something else. And it is written under the assumption that we usually allocate resources and put them into an array, and release them in reverse order. Therefore, when you delete resources, it starts looking for them from the end. He knows the size of the array, well, in the sense that he has the index of the last element. It turned out that this condition is not always met and he has to look in all directions along this array, so he is dull. The patch is that with a certain amount of resources (about 16 or a number of the order of this), this array turns into a hash table. When you resolve the conflict, you came to the specified index of the array according to the hash, and then go to one of the sides.
By the way, if someone is interested in the question, who in the third millennium has to write his own hash tables, then here I sit and write my own hash tables in two patches, because standard implementations do not suit us. This is also already in 9.6, where ResourceOwner is not stupid if you have a heavily partitioned table. I mean, he's still dumb, but weaker.

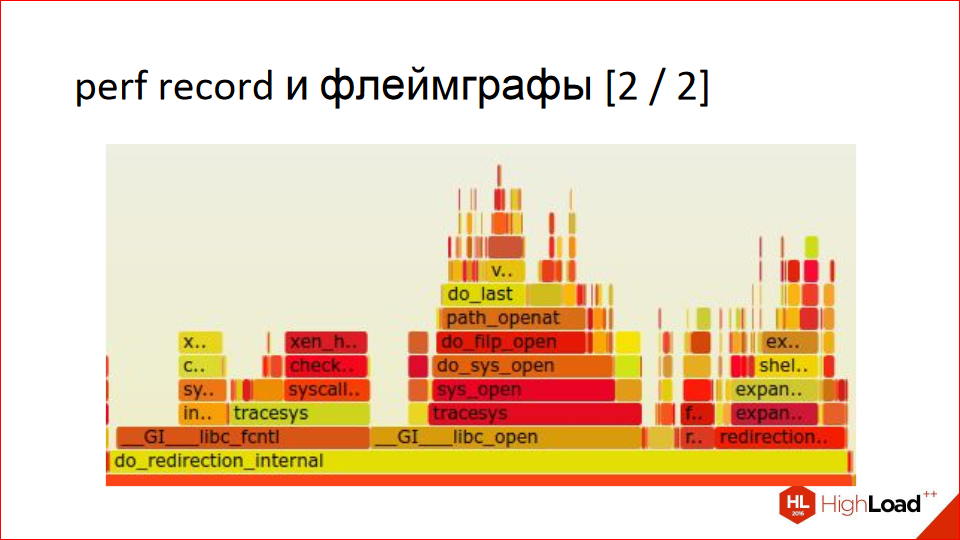
With the help of perf you can build such beautiful pictures, they are called flamegraphs. This is read from the bottom up. Below we have a procedure, then - in proportion to how much time where she spends and in turn causes - we are divided into other procedures. Then we go up, we also share in proportion, how much time she spends where. And further up. This is very clear, but it may be unusual if you see this for the first time. In fact, this is a very visual report, much clearer than the example with the graph that Gprof is building. Notice how space is used sparingly; it cannot be shown on slides, but you can click into it all. And he has a hint that shows percentages.
Here is an enlarged piece, this is somewhere in the middle part:
Actually, this is probably all. We use this often. In previous work, we analyzed the logs in the same way. There was another story - there was an AK-cluster, a distributed application, and we built such things according to the logs, trying to understand where the code is slowing us down. Logs, of course, needed to be aggregated from all backends. In general, a handy thing, I recommend it to everyone.
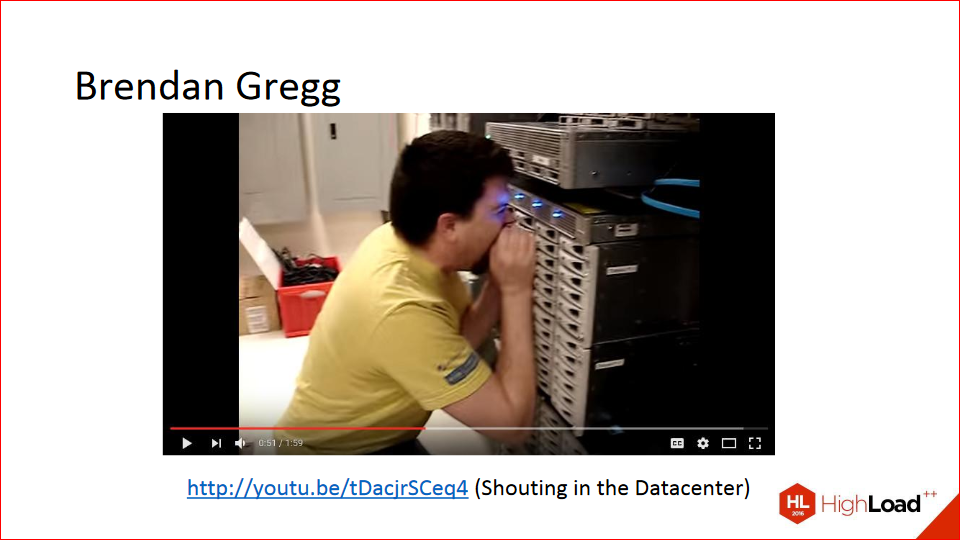
http://youtu.be/tDacjrSCeq4
This is Brandon Gregg. He invented flame graphs and almost perf himself. Probably, he was not quite alone in writing, but he significantly invested in it. He is also known in the video on YouTube, where he yells at the hard drives in the data center, and he has increased latency when accessing these drives - a great video. If anyone is interested, this is a real topic, though, with SSD it works or not - I do not know.
Recently, there was a similar story about how the entire data center was cut down in a bank during fire drills, because the pipes that supply gas that extinguishes the fire were whistling too loudly. That is, the vibration of the air knocked out all the disks.
We will return to Brandon, because he knows everything about profiling and has invested a lot in it, now he is working on it in Netflix.

http://eax.me/freebsd-pmcstat/
Pmcstat is a tool exclusively for FreeBSD. When I made these slides, I thought that no one would have FreeBSD, so there are no special details about pmcstat, since the rest is not very interesting. But the summary is that with it you can do the same thing with perf. He also makes the top, also builds flame graphs and he’s no worse, just other commands. Who cares, here is a link to a specific article.

We turn to more serious tools. SystemTap. Above this, there was CPU CPUing, where something slows down, and SystemTap allows you to do even more - you can look literally at anything in the kernel, measure how many packets you have on the network, go to disk, try on everything and everything please, limited only by your imagination. SystemTap allows you to write such scripts, in this case, the ip_rcv call, that is, the receipt of some iP package.

Advantages and disadvantages. The main drawbacks are 2. Firstly, this is not some official tool for Linux, these are the guys from Red Hat who wrote it down for themselves, to debug their code, as I understand it. It is very inconvenient to install, you need to download a package with debugging symbols of the kernel, then install it, then SystemTap itself compiles for a very long time, it is also not so easy to compile, versions are needed. But ultimately it starts working. The second drawback is that you need to understand well the basis of what you want to analyze, trace. Not everyone knows by heart the Linux kernel. But if you know your code well, you can use it.
There is an interesting property - the code is translated to C, then it is compiled into a kernel module, which loads and collects all statistics, all traces. In this case, you can not be afraid to divide by zero, dereference pointers wrong. If you write this in a scripting language, it will not cause the kernel to crash, it will just gently fold the legs and unload, but your kernel will continue to work.
There is an automatic type inference. True, there are only two or three types, but they are automatically displayed.
Personally, I would be scared to use this in production because it does not seem to be a stable tool. One fact - you have the script for 10 seconds compiled and loaded, and what will be slowing down at this time, not slowing down, is not very clear. I would not risk it, but maybe you are braver.

DTrace is also a cool tool, not just for FreeBSD, but Linux is also, all is well. It is similar to SystemTap, in this example we trace the system call poll, and moreover for processes called postgres. Here traytsya, with what arguments it is called and what is returned.

Advantages and disadvantages. Firstly, unlike SystemTap, it is directly in the system out of the box, it doesn’t need to be installed or compiled. There are in FreeBSD, in Mac OS. For Linux, it is also there, if you are somehow using Oracle Linux. In addition, there is a project dtrace4linux on GitHub, it compiles, it works, I checked. In principle, you can use.
Unlike SystemTap, DTrace is not scary to use in production - go to your Mac in a combat environment and treysit whatever you like. According to my subjective feelings, DTrace is more for admins, because you have a lot of samples in the core for anything, you don’t need to know the code base, you just say: “I want to collect statistics on IP packets - how many have come, how many have gone” . By the way, there are sets of ready-made utilities, you do not need to write all the scripts yourself. DTrace Toolkit is called.
And SystemTap is more likely not for admins, but for developers: “I know the kernel code, I want to go in this place without writing any code, not patching it”.
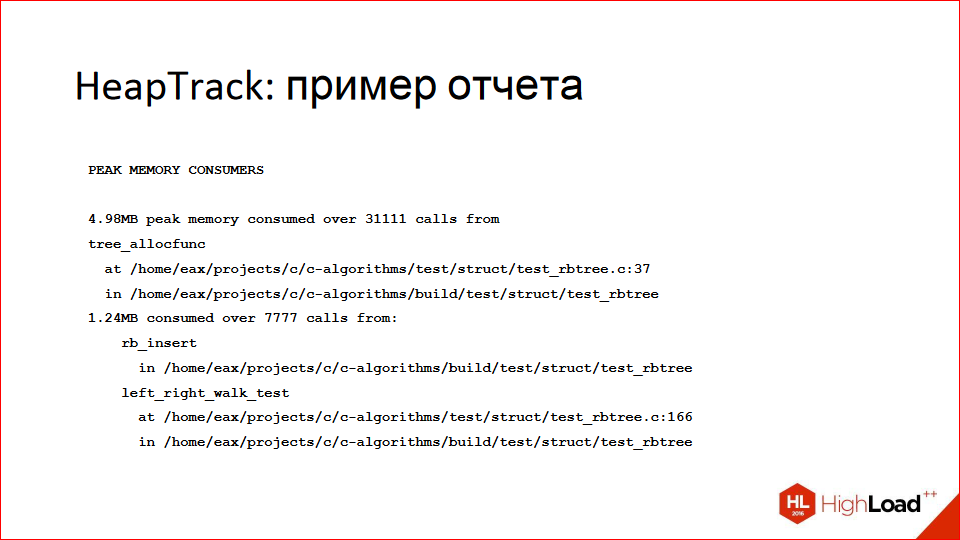
Until now, we have been talking about profiling in terms of CPU utilization, but another frequent problem is “what if I get a lot of memory?”. I personally like the HeapTrack tool, if you have ever used Valgrind Massif, it’s the same, only fast, but with a restriction - it works only on Linux.
Here (on the slide above) is an example of a text report, a place is found that eats up the most memory, there are specific line numbers, source file names, and so on.

In addition, he can build such beautiful reports in the Massif Visualizer tool. It is possible to open everything in it, it is all in dynamics. There the memory grew, then it reached its peak, then it began to fall, to free itself, to stand out, on the right there are traces. Everything is very clear and beautiful.

Advantages and disadvantages. It is fast, unlike Valgrind. Can cling to running processes, you can run processes under it. Beautiful reports. He is able to find memorials faces. He finds them a little crooked, if your standard language library allocated 16 KB for some of its internal needs and then did not release them, because “well, why?”, He will say that this is a memorial. But, in principle, quite a useful tool, despite all this.
You can build a histogram that I have pieces of 8 bytes in size allocated the most, and pieces of memory of 32 bytes in size are allocated a little less. Such a beautiful bar chart is obtained.
He doesn't know anything about the stack, if you need a stack or need something outside of Linux, then use Valgrind. I’m a Linuxoid, so I don’t know anything about Valgrind.

There is such a topic in Linux, called BPF, originally it was Berkeley Packet Filter and, as the name suggests, it is related to Berkeley and some sort of packet filtering, but it landed BPF somewhere in 2.6 at the time. But as a result, it was finalized and, in fact, it evolved, not without the help of the already mentioned Brandon Gregg, in DTrace in Linux.
It allows you to do absolutely the same thing. Recently, Brandon had a blog post where he writes that in kernel 4.9, which is still a release candidate now, but soon will be, changes to BPF have finally landed there. There will not be big, major changes, maybe they will zarefachat something, maybe a little corrected, but to actively add - this will not be.
Bcc is a set of utilities that uses BPF to profile different parts of the kernel. The picture is all the names of utilities. You can virtually any place in the kernel trace, file in the kernel.
BPF has the disadvantage that it does not have its own scripting language, as DTrace and SystemTap have, but there are already some developments in this direction. In particular, the Red Hat guys connected, they took their SystemTap and made it build for BPF. That is, the SystemTap language is used, but it works on BPF. It is still limited, does not support the string type at all, but they are working on it.
The bottom line is that BPF seems to be our distant bright future, and it is the largest common denominator that all companies eventually came to because there were some Facebook scripts that Red Hat had SystemTap because they needed to develop something to treysit. They solved their task and they do not need anything else. And BPF is what should as a result solve the needs of all, and it is already right in the core of the box ready and, it seems, in the end everyone will come to this and in a couple of years there will be great happiness.
The main question that excites the minds of millions: "Well, a lot of tools, what and when to use?". What I personally use. Debuggers If you suspect lock contention, it is easy to suspect it, you won't see in perf top that someone is eating a lot of time, probably, it is hanging in locks. Perf, if you think that you have rested against the CPU, it is visible in the usual htop - this is the process, it is eating a lot of CPU. Pmcstat, if you have FreeBSD, SystemTap, it seems to me a useless tool for the reason that there is a perf - it is more convenient. This is meant in the context of profiling, that is, I can perf'om, and for SystemTap tracing it is nothing, it is just not about profiling.
DTrace is if you are sitting on a Mac, then it is your everything, because it can do everything.
HeapTrack for memory, Vagrant Massif - if you are on Linux, and BPF is a bright future, but now I would not put 4. 9 into the product, but maybe you are bolder, again.

I would like to recommend books co-authored by Brandon Gregg.
The first one is Systems Performance: Enterprise and the Cloud - an amazing book, it must be read to everyone. This is one of the best books I have read that is related to programming. She blew my brain, then shrapnel touched my colleagues' brains, in general, just read.
The second book about DTrace is also a book by Brandon Gregg in collaboration with a guy who I don’t know what is remarkable about. I did not read it, I looked through it, it is such a big collection of recipes about DTrace. A command is given there, and what it does is sample scripts. And so on a thousand pages. It seems to me that this is not very interesting reading, but if you are very interested in DTrace, it will not be harmful to look through the evening.
A bunch of online resources:
- This is a link to my blog ;
- http://www.brendangregg.com/blog/index.html - Brendon Gregg's blog - be sure to subscribe, he will post mind-blowing things there.
- http://dtrace.org/blogs/ - I also read the DTrace blog, there are interesting articles there.
- Farther. https://sourceware.org/systemtap/ - SystemTap site.
- FreeBSD on the wiki - https://wiki.freebsd.org/DTrace
- And in the handbook you can read about DTrace. Even if you are using a Mac, still look through the handbook, there are good examples there - https://www.freebsd.org/doc/handbook/dtrace.html
- And at the end of the manual Intel - http://www.intel.com/content/www/us/en/processors/architectures-software-developer-manuals.html . There you can read, actually, what parasitizes perf, what RMC is, right in the processors there are instructions that allow you to measure all this.
That's all I wanted to say.
This report is a transcript of one of the best speeches at the conference of developers of high-loaded HighLoad ++ systems. Less than a month is left before the HighLoad ++ 2017 conference.
We have already prepared the conference program , now the schedule is being actively formed.
This year, reports on the tag "The right handles ":
- I want to compress everything / Andrey Aksenov
- Protection from DDoS at the system design stage / Ramil Hantimirov
- What to do in the evening, if I know how much ++ i + ++ i will be / Andrey Borodin
- How to develop a library of components without breaking it / Arthur Udalov
Also, some of these materials are used by us in an online training course on the development of high-load systems HighLoad.Guide is a chain of specially selected letters, articles, materials, videos. Already, in our textbook more than 30 unique materials. Get connected!
Source: https://habr.com/ru/post/340394/
All Articles