Theoretical informational approach to the analysis of sales funnel in contextual advertising
In this post, senior product manager for Calltouch Fedor Ivanov will talk about the importance of a different approach to forecasting conversion for key phrases - analyzing microconversions as key metrics that influence the final conversion on the site (which we will call macroconversion).
What can microconversions give us?
In everyday practice, we often come across the concept of "conversion." By this term we understand some target action committed by the user on the site. Examples of such targeted actions can be a transaction, a phone call, sending an application, registering on the site, etc. What action is considered to be conversion is first of all the choice of the advertiser, which he does based on the specifics of the business, site functionality, etc.
')
It is intuitively clear that a conversion has a certain value, and therefore the more conversions occur on a site per unit of time, the more benefits (direct or indirect) the advertiser receives. In this regard, the conversion rate can be viewed as the proportion of those site visitors who ultimately made the conversion, and the CPA as the average cost of attracting one “conversion” visitor.

So, this model is the simplest sales funnel: the entire audience of the site gets to enter it, and the output is the part of it that made the conversion (macro).
However, in the course of their “life” on the site, visitors can perform certain actions, which somehow make it possible to assess their loyalty and readiness to perform a targeted action on the site. Examples of such actions are:
- View at least 5 pages of the site
- Go to the "basket" section
- View contact information
- Newsletter Subscription
Such actions are called "microconversions." To summarize, microconversions are intermediate user actions on the site, which to a certain extent reflect his measure of involvement and interest in the products and services offered. If the analytics system is configured in such a way that the specified actions are tracked, then we can significantly enrich our initial sales funnel:

At the same time, it is obvious that statistics on microconversions can accumulate several times faster than statistics on basic macroconversions. For example, users who view 5 pages of the site, much more than those who purchase goods. This fact will significantly speed up the collection of statistics required to run the optimizer.
On the other hand, the analysis of microconversions will allow you to track down weak spots in the sales funnel, which will simplify the site analytics. For example, if out of 1000 visitors to the site, 200 moved to the “basket” section, and only 10 placed an order from the “basket”, it would be reasonable to assume that the form in which the user is offered to place an order needs to be processed and improved.
However, when we gave the definition of microconversion, we did not in vain mention that the indicator of one or another microconversion “to a certain extent” reflects the user's loyalty and his willingness to perform macroconversion. For example, if the goal of “at least 10 minutes user session length” is selected as a microconversion, then a high conversion rate to this goal does not necessarily mean a high conversion rate of the site as a whole.
Therefore, it is important to analyze the effect of a particular microconversion on macroconversion. In the next section, we will discuss in detail the existing approaches to such an analysis.
Methods for assessing the effect of microconversion
The simplest method of estimating the effect of one value on another (in our case, microconversion for a given goal on macroconversion) is correlation analysis. This approach was developed in one of the sections of mathematical statistics, science, which operates with random variables.
A random variable is an event that occurs with a certain probability, which obeys a certain distribution law. Therefore, we abstract from the concept of conversion and microconversion, but we will talk about random variables C V m a c r o - the number of macroconversions and C v i - the number of microconversions for some goal i . The values of these indicators, which we observe in any cuts (on the site, on a separate advertising campaign and even on a separate keyword) are called realizations (values) of a given random variable.
Correlation coefficient r (Pearson linear correlation) allows us to estimate the relationship of random variables C V m a c r o and C v i by their observable N values (specific implementations). This value takes a value from -1 to 1. The closer the value r to one (or to -1), the more random variables are "connected" (directly or in inverse relation). In other words, the more accurately we can "guess" the value C V m a c r o having information about C v i . In the first case, the dependence is direct: C V m a c r o s i m C V i , and in the second - the reverse: C V m a c r o s i m - C V i .
In our interpretation, this means that if r → 1 , the more microconversion happened C v i , the more we should expect macroconversion C V m a c r o . If r → - 1 , the more microconversion happened C v i the less macroconversion should be expected C V m a c r o .
An example of directly correlated random variables is the number of users who made a purchase and the number of users who put the product in the basket. An example of a backward-correlated random variable is the number of transactions and the number of failures.
The correlation coefficient allows one to quite accurately predict the behavior of one random variable relative to another, but there are a number of limitations. First, the sample sizes (observable values) should be large enough (several dozen observations), which will not automatically reveal the effect of one value on another at the micro level (for example, at the level of a key phrase). In addition, the formulas for calculating the correlation are accurate only when the distributions for C V m a c r o and C v i are Gaussian (normal). In addition, when calculating the coefficient r only observable values are used, with smoothing of which (for example, by pooling) a systematic error increases.
In addition, an interesting fact is that the lack of correlation between the two quantities does not mean that there is no connection between them. For example, a dependency can be complex non-linear in nature, which the correlation does not reveal. That is, the widespread belief that zero correlation means event independence is wrong. A clear demonstration of the above is the following picture:

Above the figure shows the correlation coefficient of two random variables, and the figure itself has the values of these quantities. It is easy to see that the correlation well "predicts" only a linear relationship, without detecting any others.
We have proposed an alternative approach to the analysis of microconversions, based on the principles and fundamental concepts of information theory, which allows you to significantly simplify the search for relationships between conversions at different levels even if this relationship is complex, non-linear.
What is mutual information?
Mutual information is one of the basic concepts of general information theory. It is defined as follows: Reciprocal information is a statistical function of two random variables that describes the amount of information contained in one random variable relative to another.
Thus, knowing the distribution of two random variables, we can calculate how closely they are interconnected (for any form of dependence) in terms of how much information about one event (for example, macroconversion) says the onset (or not the onset) of another event (for example, microconversion for some purpose).
General formula for calculating mutual information I ( A ; B ) between random variables A and B next:
I(A;B)=H(A)+H(B)−H(A;B)
• It is symmetrical: I(A;B)=I(B;A)
• It is limited to: 0≤I(A;B)≤min[H(A),H(B)]
• It is equal to entropy, if events are related by any functional dependence
The presence of all the above properties makes it possible to consider mutual information as a good analogue of correlation in calculating the relationship between events. In particular, the latter property will make it possible to detect the dependence of an arbitrary nature, but unfortunately the establishment of its form is a separate and rather nontrivial task.
Mutual information as an event dependency metric
All the properties that we discussed above indicate that mutual information can be considered as a metric between events (conversions and microconversions). However, in practice it is convenient to use normalized mutual information:
Id(A,B)=1− fracI(A;B)min[H(A),H(B)]
Simulation of random variables
Since mutual information can be calculated only for random variables with given distribution functions, it is first necessary to choose distributions for CVmacro and CVi . Due to the fact that conversions (and microconversions) occur independently of each other with some probabilities (probabilities of conversion and microconversion) CR and CRi then the behavior of such quantities is best described using the binomial distribution law, namely:
CV_ {macro} \ in \ {0,1 \}, \: \: p (1) = CR, \: \: p (0) = 1-CR,
CV_i \ in \ {0,1 \}, \: \: p (1) = CR_i, \: \: p (0) = 1-CR_i,
where under p(1) and p(0) we understand the probability that a conversion (micro-conversion) has occurred and the probability of the opposite event, respectively. Such a model, in addition to its simplicity, is convenient because with insufficient amount of statistical data necessary for the calculation p(1) and p(0) , these values can be calculated using the pooling method (see ppcworld ). In addition, for a binomially distributed random variable A quite simply calculated H(A) :
H(A)=−p(0)∗log2p(0)−p(1)∗log2p(1).
H(CVmacro)=−CR∗log2CR−(1−CR)∗log2(1−CR),
H(CVi)=−CRi∗log2CRi−(1−CRi)∗log2(1−CRi).
Calculation of conditional entropy
Conditional entropy between random variables CVmacro and CVi can be calculated by the formula:
H(CVi,CVmacro)=−(p(00)∗log2p(0|0)+p(01)∗log2p(0|1)++p(10)∗log2p(1|0)+p(11)∗log2p(1|1))
Where:
- p(00) - the probability that the click did not lead to either micro or macroconversion
- p(01) - the probability that a click led to macroconversion, but there was no microconversion
- p(10) - the probability that the click led to microconversion, but there was no macroconversion
- p(11) - the probability that a click will lead to both micro and macroconversion
- p(0|0)=Pr(CVi=0|CVmacro=0) - probability of absence of microconversion, provided that there was no macroconversion
- p(0|1)=Pr(CVi=0|CVmacro=1) - probability of no microconversion, provided that macroconversion has occurred
- p(1|0)=Pr(CVi=1|CVmacro=0) - probability of microconversion, if there was no macroconversion
- p(1|1)=Pr(CVi=1|CVmacro=1) - probability of microconversion, provided that macroconversion has occurred
Based on the definition of conditional probability, we can calculate:
p(0|0)=Pr(CVi=0|CV=0)= fracp(00)1−CR
p(0|1)=Pr(CVi=0|CV=1)= fracp(01)CR
p(1|0)=Pr(CVi=1|CV=0)= fracp(10)1−CR
p(1|1)=Pr(CVi=1|CV=1)= fracp(11)CR
By definition:
p(00)= fracnumberclickswithoutmacroconversionandimicroconversiontotalnumberclicks
p(01)= fracnumberclickswithoutmacroconversionandimicroconversiontotalnumberclicks
p(10)= fracnumberclickswithoutmacroconversionandimicroconversiontotalnumberclicks
p(11)= fracnumberclickswithoutmacroconversionandimicroconversiontotalnumberclicks
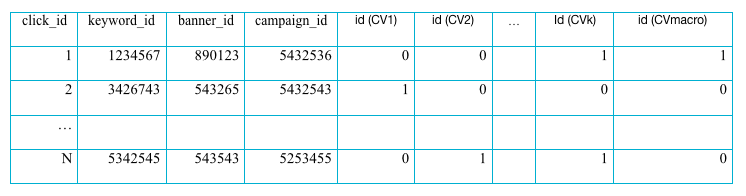
The calculation of these four probabilities requires the accumulation of the following statistics: for each click that we enumerate with some clickID, it is required to compile a vector-indicator of whether the user session initiated by this click led to a micro-conversion on the goal and to a macro-conversion on the site:
clickID→(id(CV1),id(CV2),...,id(CVk),id(CVmacro))
If we additionally add to the statistics keywordID, bannerID, campaignID, we will be able to calculate the effect of microconversion on conversion for each keyword, banner, campaign. If it turns out that its own statistics for calculation is not enough, then it can always be “inherited” from a higher level using the method of pooling. Thus, we finally have:
Statistics aggregated in this way will allow calculating both numerators and denominators in p(00),p(01),p(10),p(11) , which ultimately makes it possible to calculate the conditional entropy between the conversion and each microconversion, which means that the problem of calculating the effect of microconversions on the final conversion on the site has been completely solved.
In addition, summing up the data at the keyword, banner, campaign levels, we can calculate the dependencies between conversions and microconversions not only at the site level as a whole, but also at lower levels, which will significantly increase the effect of optimization.
In the next chapter, we will look at the question of how to estimate the weight of microconversion on the basis of the data obtained, and how to use this information for optimization.
Estimation of microconversion weights and rate optimization
To assess the effect of microconversion on some goal on the overall conversion on the site, it is convenient to use the normalized weighting formula:
Impact(CVi,CVmacro)= frac1−Id(CVi,CVmacro) sum limitskj=1(1−Id(CVj,CVmacro))
If we calculated the influence coefficient (weight) for all transitions to the site, then by selecting the targets with the greatest influence, we can optimize (for example, A / B testing methods) those parts of the site where microconversion data is collected to increase overall conversion.
If we are faced with the goal of optimizing the rates for contextual advertising, it is necessary to calculate Impact at the level of every keyword X (for them, the conversion optimizer calculates and sends the best bids):
ImpactkeywordX(CVi,CVmacro)= frac1−Id(CVi(keywordX),CVmacro(keywordX)) sum limitskj=1(1−Id(CVj(keywordX),CVmacro(keywordX)))
Bid=f(CR(ST),KPI,ST).
Bid(keywordX)= omega sum limitski=1ImpactkeywordX(CVi,CVmacro)f(C R i ( S T ) , K P I , S T ) ++ ( 1 - o m e g a ) f ( C R ( S T ) , K P I , S T ) ,
Thus, information on microconversions is especially valuable in the case of a small amount of statistics on keywordv.
Optimization case
The algorithms described in this paper are an integral part of the Calltouch conversion optimizer. Microconversion optimization is especially effective if the number of conversions that the optimizer tries to maximize within the established KPIs is small. This is the case either for small advertising accounts, or in the case of choosing a specific type of conversion. If we consider optimization by calls (the Calltouch service specializes in this type of optimization), then a specific type of conversion is a tagged call. The system allows you to tag calls both manually and using the Calltouch Predict automatic tagging tool.
In this section, we present the results of a joint case optimization study for the company BIIKS (Well Drilling) with the Ashmanov & Partners agency. The purpose of testing was to increase the number of listened target calls within the current CPA.
Test results:
Cost of conversion: connecting advertising campaigns to the Calltouch Optimizer, the client expected to save the current cost of conversion, while getting a maximum of calls. During the first 4 weeks of the test, the following results were achieved:
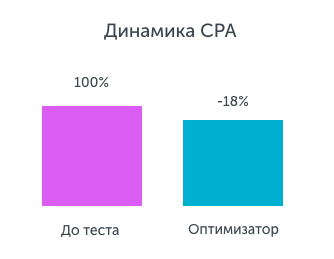
Conversion Rate: On ad campaigns connected to the Calltouch Optimizer, the conversion rate for the test period increased by 55%.

The number of conversions: the number of conversions during the test period has increased significantly: the increase when using the Optimizer was 91%

Conclusion
The paper considers a new approach to the analysis of microconversions and their impact on the main conversion on the site. This approach is based on the principles of information theory. To implement it, it is enough to choose specific goals that will be monitored by the analytics system, and choose among them the main one (conversion) and accumulate statistics on the transitions to the site for at least 30 days. The method proposed in the article can be used both to identify weak spots on the site and to optimize the rates in contextual advertising.
Source: https://habr.com/ru/post/340332/
All Articles