Automation of work with Logs API in AppMetrica. Lecture in Yandex
The data that AppMetrica collects can be made to work as you please, and not just for analytics. They allow you to automate many processes directly or indirectly related to user behavior. How to set up the upload, what data can be used and what pitfalls met during the development of the Logs API, said developer Nikolai Volosatov.
- My name is Nikolai Volosatov, I work in the mobile development department of Yandex. In particular, I am developing the iOS SDK AppMetrica. I have been working for more than three years.
Today I will talk about some functionality, about which, perhaps, you have not heard or heard, but have never used it, even if you have integrated AppMetrica. The service is called the Logs API, it allows you to upload non-aggregated data. I will tell you how it can be useful, how it can be used, everything you need to know about this product. I will also tell you about what I encountered when developing a tool for automating work with these APIs, what are the subtleties, difficulties, what is behind all this. I try to interest you both in the product itself and in some of its features, which I will tell you about.
')
AppMetrica is a universal analytical tool for your mobile applications. Allows you to do an analysis from installations and advertising campaigns to crash logs, that's all. Also available as an SDK for all major platforms: iOS, Android, Windows Phone. And also in the form of plugins for Unity, Cordova and Xamarin.
I can’t stop at the SDK itself in more detail, but on our website you can see the documentation and other reports, we also talk about this product on Subbotniki. You can learn - it may be useful in your mobile applications.
Today let's talk about, perhaps, the little-known possibility of our product - unloading non-aggregated data. What it is? We use all the data collected by our service to build reports on the web, beautifully so that you can watch, follow the trends, how the application works. But we also allow all this data to be unloaded in the non-aggregated form in which we store it, and give it to you for some of your needs.
What data can I use? First of all, information about advertising campaigns. The user clicks on the links, goes to the store, installs your application, we have all this information, you can use it, for example, to analyze the effectiveness of advertising campaigns, to integrate with internal services for setting goals, for monitoring. You can expand the information on how exactly and where your application is installed, what works effectively. Plus information about whether this is installing or reinstalling the application.
A broader application is in information about events that you send to us in the application code and can then be analyzed on the web.
In conjunction with the beginning of user sessions, when the user started working with the application, opened it for the first time, or deployed after a session timeout, all this data will be convenient for analyzing user behavior inside the application, for analyzing how it walks around the screens, where delayed how effectively it leads to sales. Sales funnels. All this information, in addition to what can be used by you, can be useful for your partners through which you make advertising campaigns.
Another interesting feature is unloading crashes and errors. Here, too, there is room for creativity - for example, to integrate with your issue tracker, with your corporate messengers, send notifications to Slack. In the case of new crashes, you can collect this information, get a ticket, once a week write reports about how many crashes happened. And when the crash is fixed, your integration will also receive a notification.
In addition, you can download the information needed to send push notifications to your application. Our service allows you to send push to all segments, according to which our SDK can filter users. But if this is not enough for you or you have very specific tastes in terms of sending guns, you can send them yourself, send them yourself.
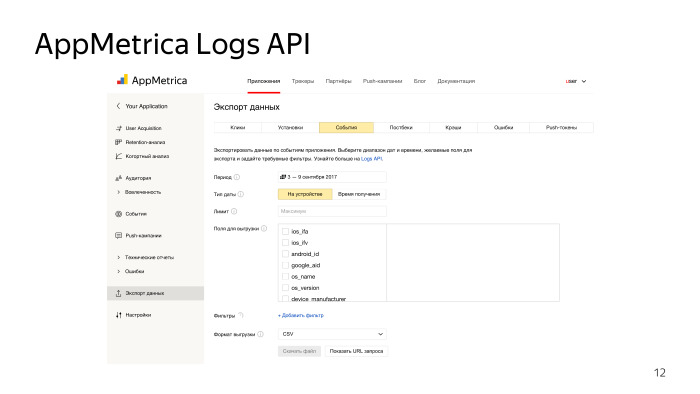
The upload interface is extremely simple. It can be used by a person who is far from not only developing, but generally from working with a computer. A simple site, our web-face from the metrics, data export, data type, format, what data you need, time interval, fields, filters. Supported formats unload CSV and JSON. Click "Generate data", wait for the processing queue to pass. The answer will be formed, get a regular file.
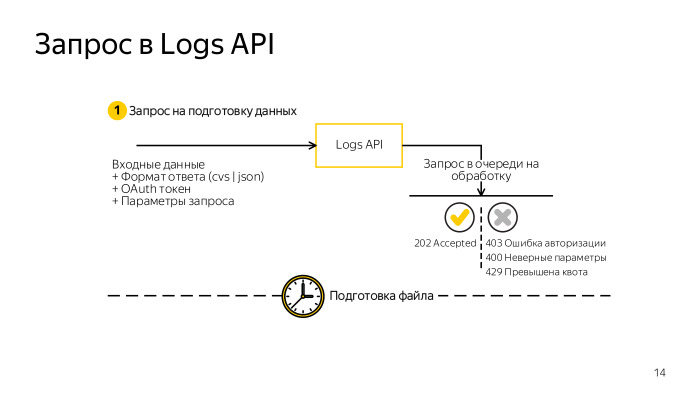
What is under the hood? Requests, if you decide to do it through the terminal, are extremely simple. You form the usual GET request to our service. This requires an authentication token, a simple OAuth token and all the same fields: what data, filters, fields, columns you need. Make a request, get an HTTP response code of 202. If all is well, the request is queued, now you will receive 202 for each request while the data is being generated. Or some answer with an error code: 403 - authorization errors, 200 - incorrectly generated request, if the fields belong to the wrong data, 239 - the quota is exceeded.
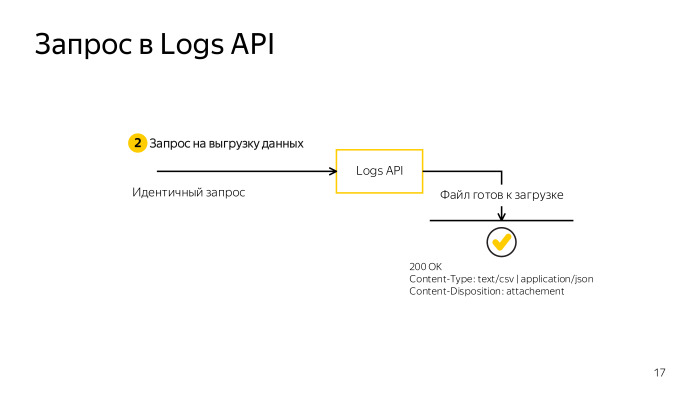
In parallel, you can make three requests for one application. If you have more than one application, you can make more requests. The size of the downloaded data should not exceed 5 GB. In conjunction with the fact that you can still exceed the time limit, you need to learn how to break the query somehow, reduce the sample. But if you need to get big data and you cannot filter something or make fewer fields, the opportunity comes to help just split the request into several parts. Two new parameters, parts_count and part_number. One by one, iterate and unload the entire data set. When the answer is generated by the server, you will receive 200 and, in the body of the answer, all the necessary data.
It looks easy, let's try to automate. Most likely, you need to automate when you are developing an analytics extension, be it a sales funnel or a crash analysis.
Most likely, it will consist of three parts. You need a database where you will upload the downloaded data, the upload script itself and the interface. If this is some kind of analytics, then the web interface. If integration with instant messengers or the issue tracker is a virtual interface of the product, where you send reports and, of course, database requests.
In the upload script that I implemented, I decided to use as the database what is most logical to use. What is used on our backend. This is a ClickHouse database that you may have heard about somewhere before. Maybe even use, perhaps, about in production. A wonderful database designed to store some kind of analytics, frequent events, is used, among other things, at CERN. The database allows you to make amazingly quick insert requests, selects, data selections, and it works distributedly.
We have data that is not so big, only 5 GB at a time, but if you unload such statistics over the years, in the end you will need acceleration to generate reports. The next thing you need: an interface and building queries to it. About this article is being prepared, will be released on Habré by Maria Mansurova miptgirl , who developed the tool for the very sales funnels.
Today we will focus more on unloading, on the nuances associated with updating the download of this kind of data. Let's look at the problems that can be encountered in the development of automation interface.
The first thing we encounter is large amounts of data. In 2017, calling 5 GB in large volumes is blasphemy, but understand that by developing a script for uploading, you mean that it will work in a minimal environment, whether it is a minimum instance on Amazon or a machine in your garage. You need everything to fit into the RAM, not sagging anywhere. And if ClickHouse is still spinning on the same machine, you will run into problems and will not be able to insert 5 GB at a time into the database.
We must learn to break the data we receive. We will upload the CSV, it is streamed, it can be beat on the lines. Manually doing it is quite difficult. The one who wrote to write the CSV parser, understands that it is not so simple, on the new line not to break.
We will use pandas, the script is written in Python. Who worked with data in Python - knows this library. The CSV read method is quite flexible for this kind of problem.
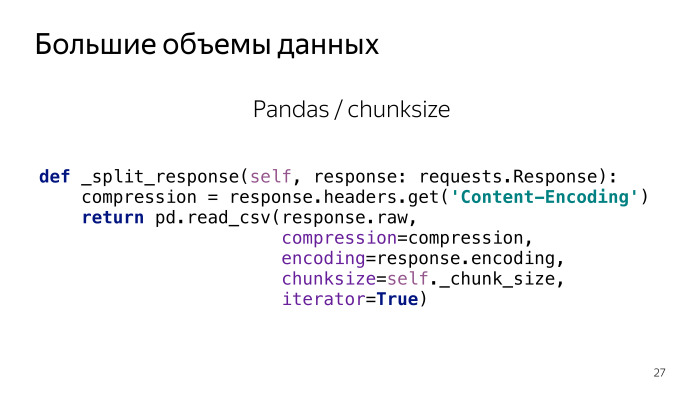
This is a piece of code that is responsible for breaking a large request into parts. The input is a stream from the network, from our API, the stream, and the output is an iterator with chunks of n lines each. Extremely simple: we have reduced the amount of RAM that is needed at once.
The next problem is data update. Here we need to look at what data, in its structure and nature, our service gives.
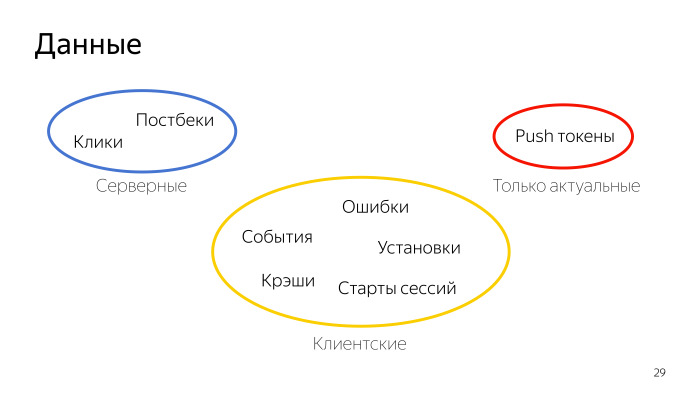
They can be divided into several groups by temporary nature. The first is the server data that is generated on the server and stored there. They undergo a minimum delay. The event has happened, the click has happened, and it can be downloaded via the Logs API.
Separately, there are push-tokens. We do not store and do not give historical data on them, it is impossible to unload push-tokens for three weeks ago. They are only current, they are here on special rights.
And - a significant part of the responses from the Logs API comes from the client, from the mobile application, which is logical, this is mobile analytics. Here we are faced with the problem that customer data may come with a delay. The delay can be up to seven days. Data may come later, but will not be given to the Logs API, are already considered obsolete. This is due to the fact that the user does not always have the Internet, we do not always send events right away to save both device resources and traffic - because somewhere in the request there is service information. All this adds up to the fact that we will have to update the data and keep in mind that we consider the data older than a week archived. They will no longer change, but the current week is problem data, they need to be updated, and they will be supplemented in the last 7 days.
If we remember that we use ClickHouse, then updating the data is not so easy. The base ClickHouse is not designed for the fact that the data will somehow change. This feature suits everyone, because the data is designed for analytics. There should be no changes.
The first decision that occurred to us was to do the unloading in a separate table. Suppose we upload one day to a separate table, then we build a diff with the data we have, and add it to the production base that we unloaded.
This solution works. On small data, it even works quite quickly. But if you think about how much data can be uploaded for years, then a request to build the difference between what we downloaded and what we have will take considerable time. ClickHouse is not ready for this, this solution is poorly scalable if you make such a large database, and it is basically a problem.
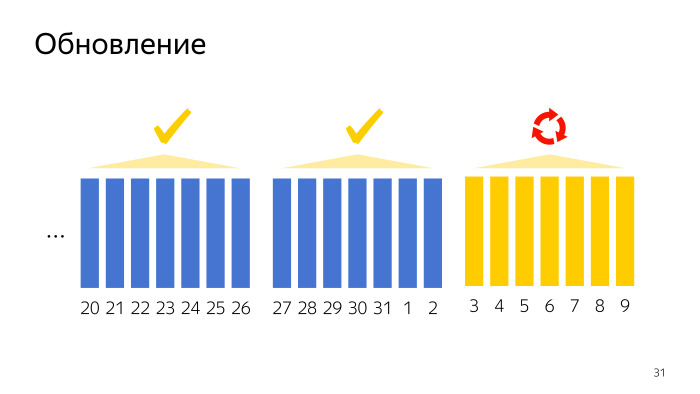
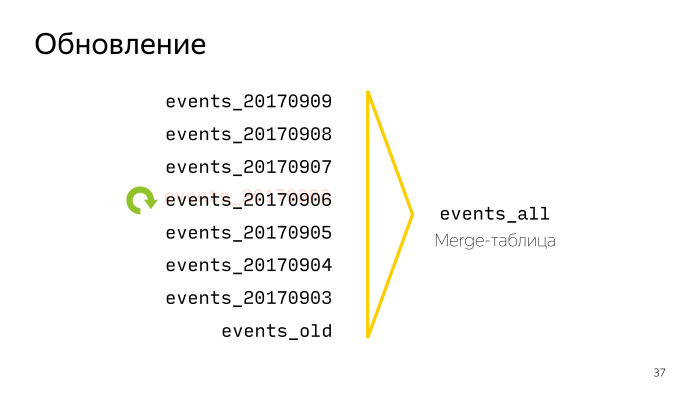
ClickHouse itself comes to the rescue, which provides an interesting opportunity: we will upload the data as follows - every day from the last seven we will upload in a separate table. All data older than seven days will be added to a separate archive table and in the event of an update we will drop there the tables that will not be updated anymore.
To make it convenient to work with, ClickHouse has a great virtual table with a merge table engine. This is a virtual table that will somewhere in their queries make union of all data from the tables based on a regular expression. We will not even need to re-create this table — it will pick up new and changing tables automatically.
Now, to update one day, we just have to throw out the table, which we consider obsolete, and load it again. In the case when the table is no longer being updated, we discard all the old data and delete it too. Now ClickHouse is satisfied. This solution scales well and does not require complex data insertion requests.
We can go to the following problems. The next question was state saving. This may seem trivial, but during the development of the tool it was necessary to constantly keep in mind that the script should work correctly, should not miss data, duplicate, and at the same time everything should work fast enough, not overload the whole world in case of problems.
Here is an example, when we unloaded several months and only a little more than a week remained. We unload the next day, something went wrong. In order not to overload all the months for which we made requests, it is sufficient to always unload every next day in a separate temporary table. So, we will keep the old data intact, and when the script is restarted - whether the network script or the machine fell - you won’t get duplication, but delete the table that didn’t reload and load it again.
It was constantly required to keep in mind that in the case of updating data, adding, first unloading and initialization it was necessary to always remain in a consistent state. Further it was required to convert and generate some fields. And here it’s not that the Logs API deceives us or does not give us any data. It simply does not give away what we already know - in particular, two generated fields: AppID, the identifier of the application from which we now receive data, and the time when we receive them.
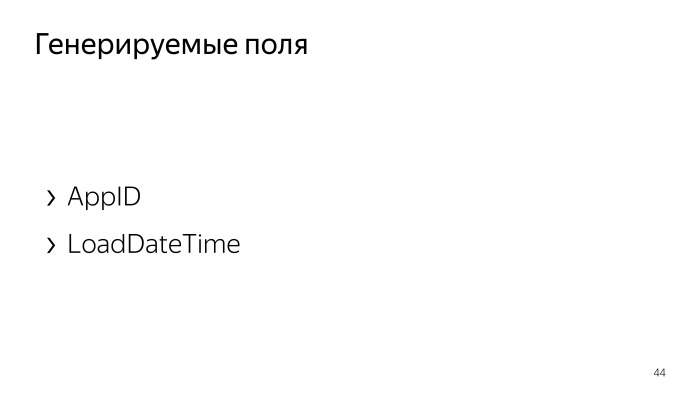
This is the information that we already know. We do not need to get it again from the Logs API, it is enough just to drop it during data processing.
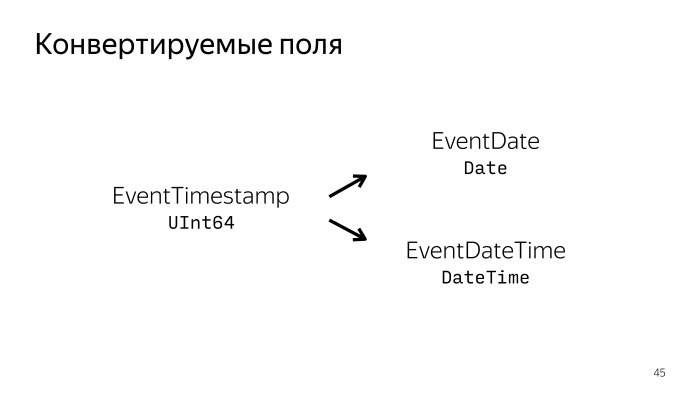
For many fields, the date can be either in string format or in Unix Time. In order not to upload it in different formats, you can, for example, always unload Time Unix and generate two new fields with the Date and DateTime native format for ClickHouse. And live with this data. In principle, it will not be necessary to unload unnecessary data, save traffic.
To conveniently deliver this all, you can use Docker, a tool that allows you to hide an application in a container, isolated from other containers and other environments of the host machine. In this case, it can work on Ubuntu 17.04, and Windows or macOS. And the application will not care, it will work correctly.
To start working with Docker and start shipping your application in a container, you just need to create a Dockerfile.
Who worked with Docker - learns almost standard Python Dockerfile, which is also used in the ONBUILD image. The file structure is simple. You say on the basis of what image you want to do it. In particular, we want Python 3.6.2 to be here. Then we create the necessary environment, the necessary directories, import all the dependencies via pip requirements, specify where we will store the persistent data necessary to save the state, and how to run the script. Everything.
Further, after some manipulations, everything can be run with two commands. To begin with - start ClickHouse, this is generally a simple command.
Then you will need to run the unload script, point the script where ClickHouse is located, authenticate it to its container. This is an authorization token, a list of application identifiers that you want to unload, and that's it. After that, when you run two commands, you will begin uploading data for the last month for all data that is. All this can be customized, but it is the minimum set of what needs to be done.

You can also simplify these two commands by adding a file for the docker-compose tools, which allows you to lift several containers at once, somehow connected to each other. We specify what we need: how ClickHouse rises, how the upload script rises. We specify that they should know about each other, or rather, we specify the ClickHouse unloading script. We specify what data will be persistent, where it is stored. In this example, you do not specify a token and a list of applications, but pass them through a variable environment. Thus, you will be able to raise all with one command, specifying the required data, the authorization token and the list of applications, as well as docker-compose up? D as environment variables. That's all you need to start using the script. It's simple. He is already in open source.
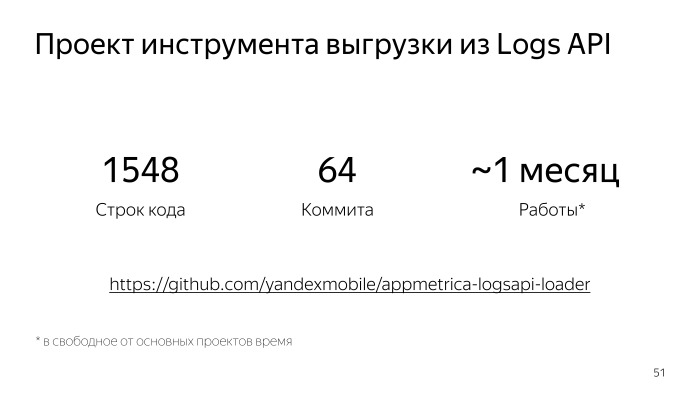
How did everything happen? This is such a pet project, not at all the main project. Just my initiative, the opportunity to practice in Python, see how you can work with the data. Took about a month of work, 64 commits, one and a half thousand lines. It seems and not very little for a simple unload script.
All data is on our GitHub and will appear in the documentation for our product. If you suddenly use AppMetrica and would like to expand the capabilities of the analytics that we provide, with its specific tastes - try to pick up, play around with the data. Perhaps you will discover something interesting for yourself.
I summarize. I explained what the Logs API is, gave an example of how it is convenient to use it, for what purposes, and told about the nuances of unloading the Logs API, which can be extrapolated to upload updated data from the network in general. Write if you have any questions. Thank!
- My name is Nikolai Volosatov, I work in the mobile development department of Yandex. In particular, I am developing the iOS SDK AppMetrica. I have been working for more than three years.
Today I will talk about some functionality, about which, perhaps, you have not heard or heard, but have never used it, even if you have integrated AppMetrica. The service is called the Logs API, it allows you to upload non-aggregated data. I will tell you how it can be useful, how it can be used, everything you need to know about this product. I will also tell you about what I encountered when developing a tool for automating work with these APIs, what are the subtleties, difficulties, what is behind all this. I try to interest you both in the product itself and in some of its features, which I will tell you about.
')
AppMetrica is a universal analytical tool for your mobile applications. Allows you to do an analysis from installations and advertising campaigns to crash logs, that's all. Also available as an SDK for all major platforms: iOS, Android, Windows Phone. And also in the form of plugins for Unity, Cordova and Xamarin.
I can’t stop at the SDK itself in more detail, but on our website you can see the documentation and other reports, we also talk about this product on Subbotniki. You can learn - it may be useful in your mobile applications.
Today let's talk about, perhaps, the little-known possibility of our product - unloading non-aggregated data. What it is? We use all the data collected by our service to build reports on the web, beautifully so that you can watch, follow the trends, how the application works. But we also allow all this data to be unloaded in the non-aggregated form in which we store it, and give it to you for some of your needs.
What data can I use? First of all, information about advertising campaigns. The user clicks on the links, goes to the store, installs your application, we have all this information, you can use it, for example, to analyze the effectiveness of advertising campaigns, to integrate with internal services for setting goals, for monitoring. You can expand the information on how exactly and where your application is installed, what works effectively. Plus information about whether this is installing or reinstalling the application.
A broader application is in information about events that you send to us in the application code and can then be analyzed on the web.
In conjunction with the beginning of user sessions, when the user started working with the application, opened it for the first time, or deployed after a session timeout, all this data will be convenient for analyzing user behavior inside the application, for analyzing how it walks around the screens, where delayed how effectively it leads to sales. Sales funnels. All this information, in addition to what can be used by you, can be useful for your partners through which you make advertising campaigns.
Another interesting feature is unloading crashes and errors. Here, too, there is room for creativity - for example, to integrate with your issue tracker, with your corporate messengers, send notifications to Slack. In the case of new crashes, you can collect this information, get a ticket, once a week write reports about how many crashes happened. And when the crash is fixed, your integration will also receive a notification.
In addition, you can download the information needed to send push notifications to your application. Our service allows you to send push to all segments, according to which our SDK can filter users. But if this is not enough for you or you have very specific tastes in terms of sending guns, you can send them yourself, send them yourself.
The upload interface is extremely simple. It can be used by a person who is far from not only developing, but generally from working with a computer. A simple site, our web-face from the metrics, data export, data type, format, what data you need, time interval, fields, filters. Supported formats unload CSV and JSON. Click "Generate data", wait for the processing queue to pass. The answer will be formed, get a regular file.
What is under the hood? Requests, if you decide to do it through the terminal, are extremely simple. You form the usual GET request to our service. This requires an authentication token, a simple OAuth token and all the same fields: what data, filters, fields, columns you need. Make a request, get an HTTP response code of 202. If all is well, the request is queued, now you will receive 202 for each request while the data is being generated. Or some answer with an error code: 403 - authorization errors, 200 - incorrectly generated request, if the fields belong to the wrong data, 239 - the quota is exceeded.
In parallel, you can make three requests for one application. If you have more than one application, you can make more requests. The size of the downloaded data should not exceed 5 GB. In conjunction with the fact that you can still exceed the time limit, you need to learn how to break the query somehow, reduce the sample. But if you need to get big data and you cannot filter something or make fewer fields, the opportunity comes to help just split the request into several parts. Two new parameters, parts_count and part_number. One by one, iterate and unload the entire data set. When the answer is generated by the server, you will receive 200 and, in the body of the answer, all the necessary data.
It looks easy, let's try to automate. Most likely, you need to automate when you are developing an analytics extension, be it a sales funnel or a crash analysis.
Most likely, it will consist of three parts. You need a database where you will upload the downloaded data, the upload script itself and the interface. If this is some kind of analytics, then the web interface. If integration with instant messengers or the issue tracker is a virtual interface of the product, where you send reports and, of course, database requests.
In the upload script that I implemented, I decided to use as the database what is most logical to use. What is used on our backend. This is a ClickHouse database that you may have heard about somewhere before. Maybe even use, perhaps, about in production. A wonderful database designed to store some kind of analytics, frequent events, is used, among other things, at CERN. The database allows you to make amazingly quick insert requests, selects, data selections, and it works distributedly.
We have data that is not so big, only 5 GB at a time, but if you unload such statistics over the years, in the end you will need acceleration to generate reports. The next thing you need: an interface and building queries to it. About this article is being prepared, will be released on Habré by Maria Mansurova miptgirl , who developed the tool for the very sales funnels.
Today we will focus more on unloading, on the nuances associated with updating the download of this kind of data. Let's look at the problems that can be encountered in the development of automation interface.
The first thing we encounter is large amounts of data. In 2017, calling 5 GB in large volumes is blasphemy, but understand that by developing a script for uploading, you mean that it will work in a minimal environment, whether it is a minimum instance on Amazon or a machine in your garage. You need everything to fit into the RAM, not sagging anywhere. And if ClickHouse is still spinning on the same machine, you will run into problems and will not be able to insert 5 GB at a time into the database.
We must learn to break the data we receive. We will upload the CSV, it is streamed, it can be beat on the lines. Manually doing it is quite difficult. The one who wrote to write the CSV parser, understands that it is not so simple, on the new line not to break.
We will use pandas, the script is written in Python. Who worked with data in Python - knows this library. The CSV read method is quite flexible for this kind of problem.
This is a piece of code that is responsible for breaking a large request into parts. The input is a stream from the network, from our API, the stream, and the output is an iterator with chunks of n lines each. Extremely simple: we have reduced the amount of RAM that is needed at once.
The next problem is data update. Here we need to look at what data, in its structure and nature, our service gives.
They can be divided into several groups by temporary nature. The first is the server data that is generated on the server and stored there. They undergo a minimum delay. The event has happened, the click has happened, and it can be downloaded via the Logs API.
Separately, there are push-tokens. We do not store and do not give historical data on them, it is impossible to unload push-tokens for three weeks ago. They are only current, they are here on special rights.
And - a significant part of the responses from the Logs API comes from the client, from the mobile application, which is logical, this is mobile analytics. Here we are faced with the problem that customer data may come with a delay. The delay can be up to seven days. Data may come later, but will not be given to the Logs API, are already considered obsolete. This is due to the fact that the user does not always have the Internet, we do not always send events right away to save both device resources and traffic - because somewhere in the request there is service information. All this adds up to the fact that we will have to update the data and keep in mind that we consider the data older than a week archived. They will no longer change, but the current week is problem data, they need to be updated, and they will be supplemented in the last 7 days.
If we remember that we use ClickHouse, then updating the data is not so easy. The base ClickHouse is not designed for the fact that the data will somehow change. This feature suits everyone, because the data is designed for analytics. There should be no changes.
The first decision that occurred to us was to do the unloading in a separate table. Suppose we upload one day to a separate table, then we build a diff with the data we have, and add it to the production base that we unloaded.
This solution works. On small data, it even works quite quickly. But if you think about how much data can be uploaded for years, then a request to build the difference between what we downloaded and what we have will take considerable time. ClickHouse is not ready for this, this solution is poorly scalable if you make such a large database, and it is basically a problem.
ClickHouse itself comes to the rescue, which provides an interesting opportunity: we will upload the data as follows - every day from the last seven we will upload in a separate table. All data older than seven days will be added to a separate archive table and in the event of an update we will drop there the tables that will not be updated anymore.
To make it convenient to work with, ClickHouse has a great virtual table with a merge table engine. This is a virtual table that will somewhere in their queries make union of all data from the tables based on a regular expression. We will not even need to re-create this table — it will pick up new and changing tables automatically.
Now, to update one day, we just have to throw out the table, which we consider obsolete, and load it again. In the case when the table is no longer being updated, we discard all the old data and delete it too. Now ClickHouse is satisfied. This solution scales well and does not require complex data insertion requests.
We can go to the following problems. The next question was state saving. This may seem trivial, but during the development of the tool it was necessary to constantly keep in mind that the script should work correctly, should not miss data, duplicate, and at the same time everything should work fast enough, not overload the whole world in case of problems.
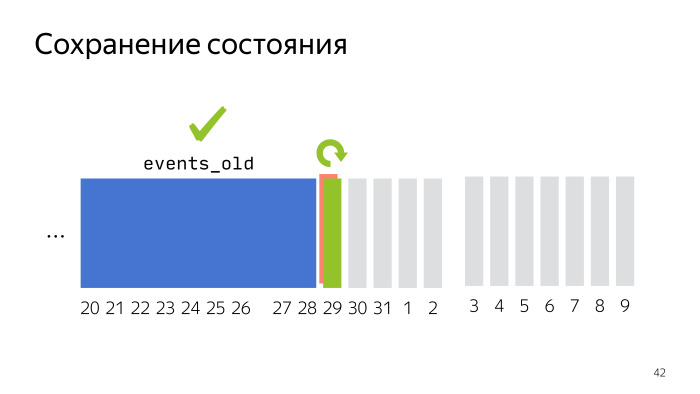
Here is an example, when we unloaded several months and only a little more than a week remained. We unload the next day, something went wrong. In order not to overload all the months for which we made requests, it is sufficient to always unload every next day in a separate temporary table. So, we will keep the old data intact, and when the script is restarted - whether the network script or the machine fell - you won’t get duplication, but delete the table that didn’t reload and load it again.
It was constantly required to keep in mind that in the case of updating data, adding, first unloading and initialization it was necessary to always remain in a consistent state. Further it was required to convert and generate some fields. And here it’s not that the Logs API deceives us or does not give us any data. It simply does not give away what we already know - in particular, two generated fields: AppID, the identifier of the application from which we now receive data, and the time when we receive them.
This is the information that we already know. We do not need to get it again from the Logs API, it is enough just to drop it during data processing.
For many fields, the date can be either in string format or in Unix Time. In order not to upload it in different formats, you can, for example, always unload Time Unix and generate two new fields with the Date and DateTime native format for ClickHouse. And live with this data. In principle, it will not be necessary to unload unnecessary data, save traffic.
To conveniently deliver this all, you can use Docker, a tool that allows you to hide an application in a container, isolated from other containers and other environments of the host machine. In this case, it can work on Ubuntu 17.04, and Windows or macOS. And the application will not care, it will work correctly.
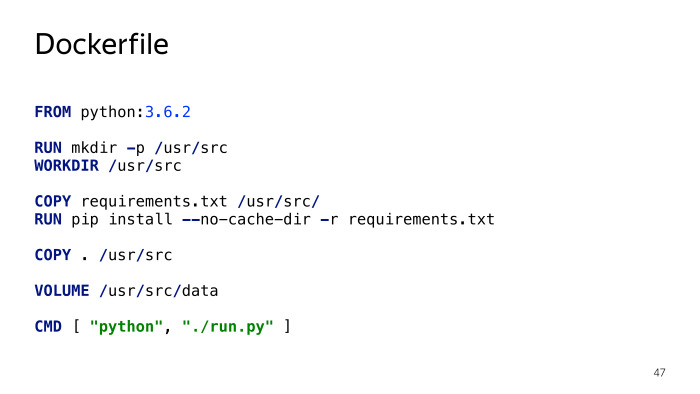
To start working with Docker and start shipping your application in a container, you just need to create a Dockerfile.
Who worked with Docker - learns almost standard Python Dockerfile, which is also used in the ONBUILD image. The file structure is simple. You say on the basis of what image you want to do it. In particular, we want Python 3.6.2 to be here. Then we create the necessary environment, the necessary directories, import all the dependencies via pip requirements, specify where we will store the persistent data necessary to save the state, and how to run the script. Everything.
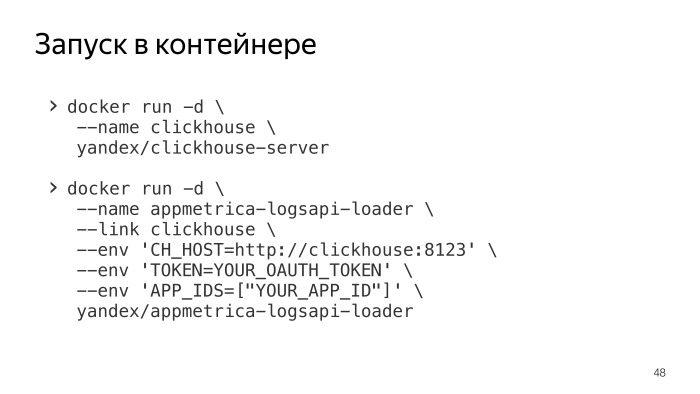
Further, after some manipulations, everything can be run with two commands. To begin with - start ClickHouse, this is generally a simple command.
Then you will need to run the unload script, point the script where ClickHouse is located, authenticate it to its container. This is an authorization token, a list of application identifiers that you want to unload, and that's it. After that, when you run two commands, you will begin uploading data for the last month for all data that is. All this can be customized, but it is the minimum set of what needs to be done.
You can also simplify these two commands by adding a file for the docker-compose tools, which allows you to lift several containers at once, somehow connected to each other. We specify what we need: how ClickHouse rises, how the upload script rises. We specify that they should know about each other, or rather, we specify the ClickHouse unloading script. We specify what data will be persistent, where it is stored. In this example, you do not specify a token and a list of applications, but pass them through a variable environment. Thus, you will be able to raise all with one command, specifying the required data, the authorization token and the list of applications, as well as docker-compose up? D as environment variables. That's all you need to start using the script. It's simple. He is already in open source.
How did everything happen? This is such a pet project, not at all the main project. Just my initiative, the opportunity to practice in Python, see how you can work with the data. Took about a month of work, 64 commits, one and a half thousand lines. It seems and not very little for a simple unload script.
All data is on our GitHub and will appear in the documentation for our product. If you suddenly use AppMetrica and would like to expand the capabilities of the analytics that we provide, with its specific tastes - try to pick up, play around with the data. Perhaps you will discover something interesting for yourself.
I summarize. I explained what the Logs API is, gave an example of how it is convenient to use it, for what purposes, and told about the nuances of unloading the Logs API, which can be extrapolated to upload updated data from the network in general. Write if you have any questions. Thank!
Source: https://habr.com/ru/post/340126/
All Articles