A practical guide to analyzing application performance
You probably already know that several months after the conferences we post videos of all the reports . And for the very best, as in the case of Sasha's goldshtn Goldstein keynout , we are also preparing transcripts - so that those who do not like the video format can also join.
Sasha talks about the methods and tools for analyzing the performance of applications, including those developed by him.
')
The article is based on Sasha’s speech at the DotNext 2017 Piter conference. Sasha works as the technical director of the Israeli training and consulting company Sela and knows firsthand how to conduct a performance analysis. How to start it better than complete it, what tools should be used, and what to avoid, read under the cut.
Let's start with the performance analysis framework. The following plan is used by developers, system administrators, any technical specialists:
It is much more difficult to get an exact description of the problem from the client than it seems at first glance.
A client can deal with a problem like:
“The application is working too SLOWLY. Users can not say exactly when this happens, but this is bad. Can you see it? ”
Or
“We have a budget for productivity work, will you be able to look at our work environment for two days and find a problem?”
Of course, you can try, but it is unlikely to be a very good use of the allocated budget. The problem, formulated more precisely, may look like this:
“Starting from 4:25 in the morning, when accessing the ASP.NET site in 95% of cases, there is a delay of 1,400 ms (the normal response time is 60 ms). The delay is observed regardless of geographic location and does not decrease. We turned on automatic scaling, but that didn't help. ”
Such a description of the problem is much more accurate, because I see the symptoms and understand where to look, and I know what can be considered a solution to the problem (reducing the delay to 60 ms).
Sometimes it is much more difficult to find out what exactly is required by the client than it seems at first glance.
Each company has its own performance requirements, which, unfortunately, are not always formulated. For example, they may be:
When there are such requirements, it remains only to test the system for compliance with them and understand how to solve the problem. But it is important to understand that the requirements are not taken from nowhere, they must always be consistent with business goals. With well-defined requirements, you can always track the statistics in the APM-solution or in other ways and receive notifications when something goes wrong.
Before diving into the analysis methods that give results, I want to talk a little about how not to analyze the problem. So you definitely shouldn't:
I will give an example of one unsuccessful analysis, which was never completed. My task was to understand why sometimes customers encounter significant delays when saving and loading documents in the project management system. The system was connected to NetApp via SMB on the local network, and my task was to find out the network latency and latency that could have occurred when working with the data warehouse.
I had tools for monitoring WCF and application server performance, I had a sniffer for network traffic, but I did not have access to NetApp storage. After a series of tests, I found out that the average response speed was 11 ms, but within 24 hours some cases of a 1200 ms delay were observed. I lacked information about what was happening on the part of NetApp, and it was necessary to obtain performance testing data.
From the client, I was able to get only the information that the response speed of the data storage system could not be less than 5 ms. To my question about what this figure is: the average or peak delay, I received the answer: this is the maximum average value for 60 seconds. I still do not know what this value is, and I believe that you also do not know. He could take the average value every second and then the maximum value from all averages, or perhaps take the maximum value every second and then the average from the maximum ...
After that, I found in the documentation for NetApp performance counters that are considered valid for this storage system. These are average data per second, not per minute. I asked the client to provide me with this data, but I was refused. This attempt analysis ended.
For me, this is a classic case of how performance analysis cannot be done. I did my best to get as much information as possible and not to rely on assumptions , but I did not succeed because of the lack of mutual understanding with the client. And this is a good example of why you can not rely on assumptions and absurd beliefs.
Now about the unsuccessful use of tools.
Sometimes experts think that if they bought an expensive instrument, then they are simply obliged to use it for all analysis options. I will give a classic example of using the wrong tool for analysis.
Let's run the Visual Studio profiling tools in CPU sampling mode to test the performance of the crawler. A robot can do some things that do not burden the processor, and if we do this test, we can get something like this:
From this it follows that it is necessary to improve the performance of System.Console.WriteLine, since this method slows down the application. However, the search robot can simply wait for the receipt of network data, it has nothing to do with the processor. Therefore, you can never choose a tool for analysis on the principle "simply because we bought it, and we need to recapture its cost."
Sometimes you just don’t know what to look for, in which case I suggest a methodology that is often used by engineers all over the world. This is the USE (Utilization, Saturation, Errors) method, which is handled in several steps:
Here is what the USE method might look like for hardware and software resources:
You must have a checklist, according to which you systematically test each of the components to get the big picture.
Here is the checklist for Windows systems:
Most of this data can be obtained using the built-in Windows performance counters. This check can be done very quickly, but it allows you to save a lot of time to focus on analyzing the problems found.
To automate this process, you can use a variety of solutions:
Performance analysis tools can be divided into three categories:
As a rule, the tools of the first category give a small overhead, when using tools to determine the waiting time, it is longer, and the tools of the third category lead to a significant overhead. This is not surprising, since the latter provide much more information.
When choosing tools, it is important to pay attention to five points:
Any observation can affect the state of the system, but some tools are stronger than others. Therefore, before using any tool it is best to refer to the documentation. As a rule, it indicates what can be expected from the use of the tool (for example, increasing the processor load by 5-10% under certain circumstances).
If the documentation for the tool you are going to use does not say anything about the overhead, then you will have to test it yourself. This should be done on a test system, measuring how much the performance drops.
Perhaps, for those who do not work with Java, this will be news, but most CPU Java profilers that are used by developers give out incorrect data (VisualVM, jstack, YourKit, JProfiler ...). They use the GetAllStackTraces documented by the JVMTI API. It gives a sample of what each thread in the system does when you call the GetAllStackTraces function.
The advantage of using it is cross-platform, but there is a significant drawback. You only get the sample stream when all the threads are in safe conditions. That is, if you request a stack trace, you do not receive it from the current moment, but from some point later, when the thread decides that it wants to transfer its stack trace. As a result, you get results that have no relation to the real state of affairs.
In the screenshot below, you can see the data from a scientific report on the accuracy of Java profilers.
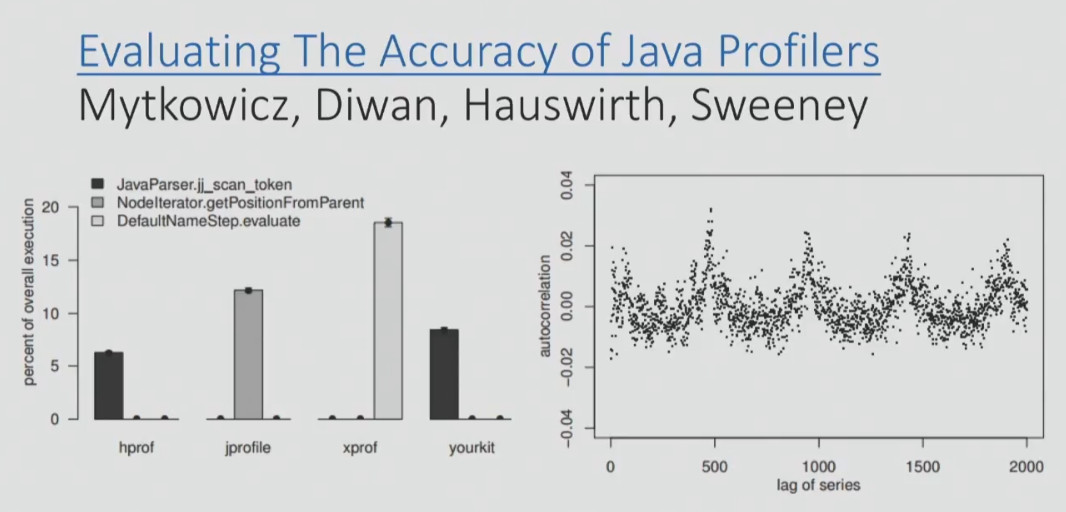
On the graph, you can see the data of four profilers on which of the methods on a particular benchmark was the hottest. Two of the four profilers (right and left) determined that this was the jj_scan_token method, the third profiler determined that it was the getPositionFromParent method, and the fourth was the DefaultNameStep.evaluate. That is, four profilers gave completely different readings and completely different methods. And here it’s not the profilers, but the API that they use to get the results from the target process.
That is why, if you use a new tool, you must test it in different conditions (when the processor is actively working, at rest or reading data from the disk). And you need to make sure that the profiler provides the correct data, and then look at the overhead. If the data is incorrect, then this profiler, of course, should not be used.
Here I want to give an example of instructions for profiling. NET Core on Linux.
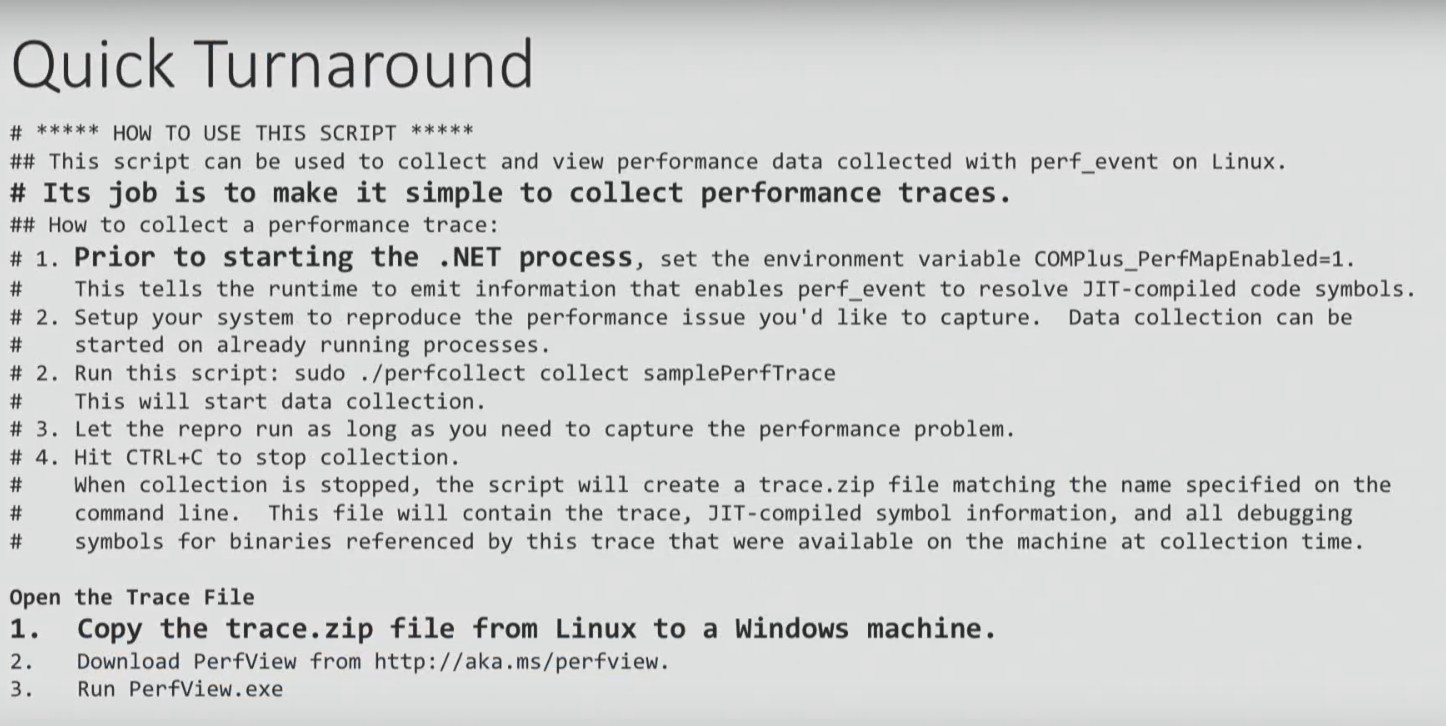
We will not consider it in detail, we will address only some points. It begins with the need to set up an environment variable, which I, for example, have problems with. Well, let's say you did it. The instruction ends with the need to take a zip file generated as a result of all these steps, copy it to a Windows machine and open it using PerfView. And only then can you analyze the data. It sounds ridiculous, is not it? Perform an analysis on Linux, and then open it on Windows ...
Here is an alternative solution to the same problem. These scripts do not work very well, but at least they provide an opportunity to get results on Linux.
$ ./dotnet-mapgen.py generate 4118
$ ./dotnet-mapgen.py merge 4118
# perf record -p 4118 -F 97 -g
# perf script | ./stackcollapse-perf.pl> stacks
$ ./flamegraph.pl stacks> stacks.svg
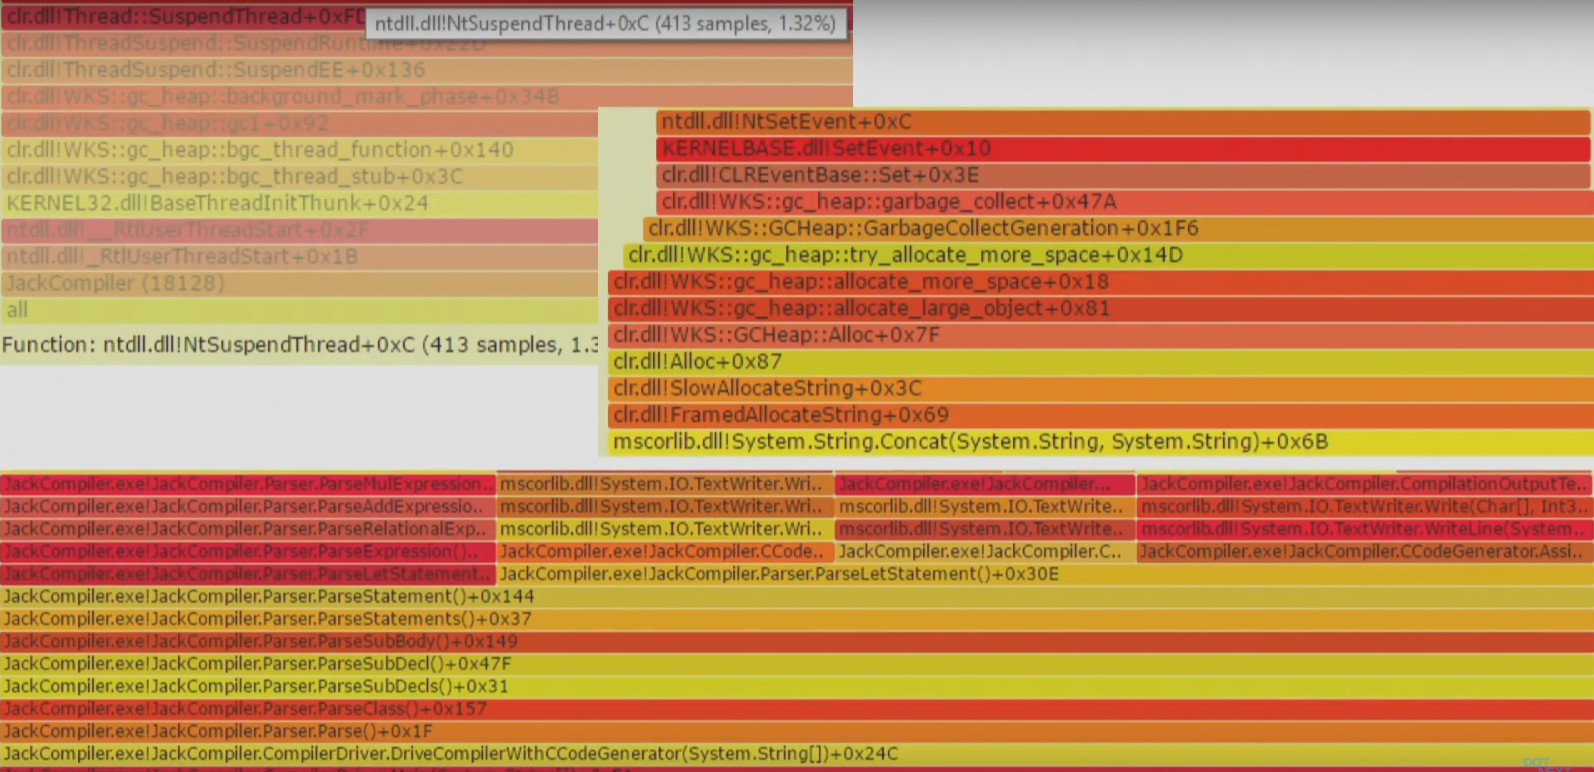
As a result, you get a visualization called a flame graph. I will focus on it in more detail, since many Windows and .NET developers are not yet familiar with it.
This method allows you to visualize different stack traces, for example, where an application often accesses a disk, when there is a heavy processor load, etc. When you have many different stacks, a flame graph is a good way to visualize them instead of reading a lot of text. Flame graph turns thousands of stack trace pages into one interactive graph.
Each rectangle in the graph is a function. Colors are selected in a random order, so they can be ignored. The Y axis is the depth of the stack, that is, if one function called another, it will be located above it, and will be shown above in the graph. The X axis is sorted stacks (not time). Having such a schedule, it is very easy to bring exactly the area that you are interested.
Invasive profilers can have a bad effect on performance, reliability, and system response because they are too “heavy”. For example, when using the Visual Studio profiler in instrumentation mode and IntelliTrace, the application is recompiled and launched with additional markers. Such a tool cannot be used in a working environment.
Another example is the CLR Profiling API, which is still used in some tools. It is based on the implementation of the DLL in the target process. This may be acceptable when developing, but in a production environment it can be problematic to embed a library in a running process.
The Linux extreme example is the Linux SystemTap, LTTng, and SysDig trace frameworks that require the installation of a custom kernel module in the system. Yes, you can trust these guys, but it's still a bit suspicious that you need to load something new into the kernel to run the performance measurement tool.
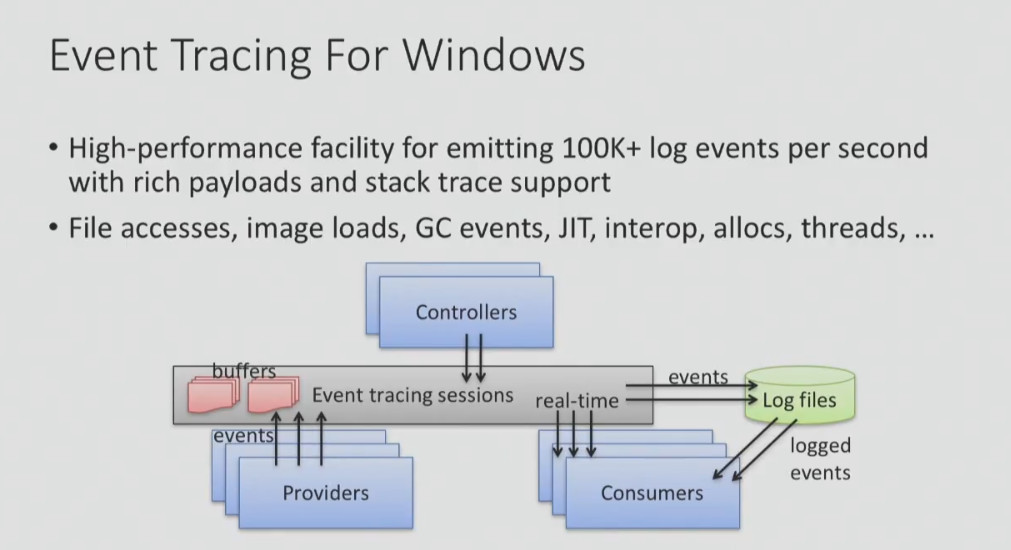
Fortunately, Windows has a fairly lightweight Event Tracing framework (Windows), which you may have heard about. With this framework, you can profile the processor, determine where the garbage collections are, which files the application gets access to, where it accesses the disk, etc.
But despite the fact that ETW is not too invasive, the speed of getting results from it can sometimes be a problem. Below I give an example from a log file generated using PerfView:

As you can see, I collected information about the use of the processor for 10 seconds, and a total of 15 MB of data. Therefore, it is unlikely that you will be able to test the system using Event Tracing for hours - the amount of data will be too large. In addition, the CLR Rundown took 12.7 seconds to complete, then it took some time to convert and open the data (I highlighted the time in red). That is, to get the data collected within 10 seconds, you need to spend half a minute to process and open them.
Despite the fact that this is considered a fairly good result, I do not really like it. Therefore, I would rather tell you about the tools that I wrote myself and without which I simply cannot live.
Etrace (https://github.com/goldshtn/etrace) is the open source command line interface for ETW. You can tell him what events you want to see, and he will give information about them in real time. As soon as an event occurs, it can be seen on the command line.
> etrace --help
...
Examples:
etrace --clr GC --event GC / AllocationTick
etrace --kernel Process, Thread, FileIO, FileIOInit --event File / Create
etrace --file trace.etl --stats
etrace --clr GC --event GC / Start --field PID, TID, Reason [12], Type
etrace --kernel Process --event Process / start --where ImageFileName = myapp
etrace --clr GC --event GC / Start --duration 60
etrace --other Microsoft-Windows-Win32k --event QueuePostMessage
etrace --list CLR, Kernel
For example, you run etrace and say: I want GC events. As soon as such an event starts, I want to see its type, reason, process, etc.

Another tool that I wrote myself and I want to present to you is LiveStacks . He is also related to ETW. LiveStacks collects stack traces for interesting events (where are garbage collections, where there is a load on the processor, which files the application gets access to, where it accesses the disk, etc.). The main difference between LiveStacks and other similar tools is to display information in real time. You do not need to wait until data processing is complete to find out what processes are taking place.
Here is an example of the processor profiling mode that is used by default. LiveStacks looks at the process in Visual Studio and shows the call stack in a process that requires the most CPU time.
Another example: when asked, “ show me where garbage collection starts, which call stack caused the garbage collection to run in a specific process or across the entire system ” LiveStacks gives you a call stack in real time with information about where garbage collection takes place:

From the results, LiveStacks can generate flame graphs by visualizing the call stacks that were displayed in the console.
> LiveStacks -P JackCompiler -f> stacks.txt
ˆC
> perl flamegraph.pl stacks.txt> stacks.svg
I use these tools because they give me the opportunity to get results quickly, without waiting for data processing.
When you build a system, library, architecture for your new project, you should think in advance about some things that in the future will simplify the performance analysis:
An example of a project with very good instrumentation tools is .NET on Windows, which has been used by many people for more than 10 years. There are ETW events that I mentioned above, there is an opportunity to capture the call stacks of interesting events and convert them into function names. And all this is included by default!
Making a project with such instrumentation tools is not easy. Say, if you look at .NET Core 2.0 for Linux, everything is not so rosy. And not at all because there are no good tools for performance analysis in Linux, but because it is rather difficult to build a platform that would be easy to profile and debug.
Do you want to know what is wrong with .NET Core 1.0 for Linux? The platform has events, but it is impossible to receive call stacks, you can only find out that an event has occurred (which is much less informative). Another example: to convert call stacks to get the names of functions, you need to do a lot of preliminary actions. That is why the documentation proposes to take a ZIP file and open it in Windows (I gave this example above).
It's all about priorities. If you think that the possibility of performing a performance analysis is an important requirement for the system you are developing, you will not release something like this. Although, of course, this is just my point of view.
Statistics and tools often deceive us. This is what you should always remember in this regard:
For example, someone tells you that "the average response time of the system is 29 ms." What can this mean? For example, the fact that, with an average response time of 29 ms, the worst value is 50 ms or 60 ms, and the best is close to zero. Or it may mean that for most cases the response time is 10 ms, but there is a mode in which the system is much slower (with a response time of up to 250 ms), and the average value is also 29 ms.
You can see that the two graphs showing these two cases with the same average response time are completely different. In order to understand the real picture of what is happening, it is not enough to look at the numbers, you need to look at the real distribution.
There is a great study I found on the web. It demonstrates why you can never trust only summary statistics and always need to visualize the data.
The authors visualized 13 data sets with the same summary statistics (the same mean x / y, one standard deviation x / y, and the same cross-correlation). However, these datasets look completely different. That is, when you look only at numbers, it means nothing. You do not see the "form" of your data when you look only at the numbers.
BenchmarkDotNet is the library that many of you use. It is simply gorgeous, but does not show the “form” of your data (at least, by default). When you run it in the console, it gives out a lot of numbers: averages, standard deviations, confidence intervals, quartiles, but not the "form" of the data. And this is very important. For some types of analysis, the inability to see the "form" of the data means that you miss important things.
Here is an example of what you can skip by relying on averages. This graph shows the delay time. In 99% of cases, the response time is just under 200 ms, but periodic stuttering can be observed — too long delays (even up to 10 ms) occurring over a short period of time.
And in most cases, when performing performance analysis, they are asked to pay attention to stuttering - to the fact that they are above average values, to problems that users sometimes face. In order to identify them, it is necessary to visualize all the data points, as in the graph above, or to build the distribution, as in the graph below.
Another common mistake people make with percentiles is to perform mathematical operations with them. For example, it is impossible to average percentile, as my client did, whose letter you can read below.
Imagine that you have two servers. For server A, the delay time is 90 ms for 90% of the time; for Server B, the delay time is 90 ms for 90% of the time.
It is important to understand that you cannot average these values. It is not true that 90% of requests respond in less than 57 ms. In fact, 90% of requests respond in less than 68 ms.
Therefore, interest, quartiles, etc. can never be averaged. We must always look at the data and their distribution.
Sometimes you can hear something like: “Who cares about the 99th percentile? None of my users can even see this! ”I will explain why this is important on the example page of Amazon.com. She made 328 requests. Assuming that all requests are independent, what is the probability that at least one of them was in the 99th percentile?
P = 1 - 0.99 328 ~ 96%
The answer is 96%. Therefore, it is very likely that when you go to the Amazon.com page, you will receive at least one request in the 99th percentile. And if your users get access to a system that is relatively complex, then the likelihood that the worst scenario will happen to them is very high.
The last thing I would like to mention in this article is the need to use special tools for systems consisting of a large number of machines. This is what these tools should be able to do:
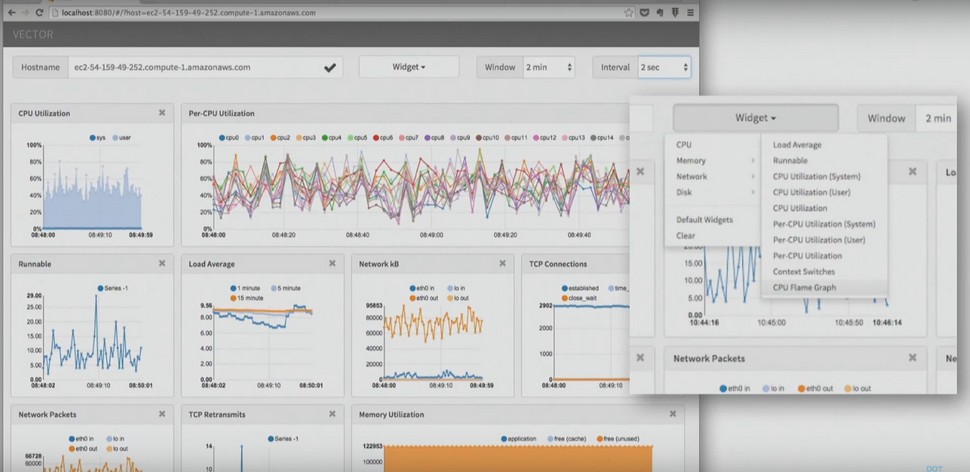
There are a lot of such tools. One example of an application performance monitoring tool is Vector from Netflix. On the information panel you can see the summary statistics, but at the same time, at any time, you can click on a specific instance and, say, view the processor flame graph for this instance or the use of disk resources.
Another example is the New Relic AMP solution , which also works with .NET. It shows you requests in the system and where you spend time servicing these requests. And if you want, you can switch to a specific request, to a specific user session.
After the performance review is complete, do not neglect the opportunity to sit down and document what has been done. What exactly is worth doing?
Sasha Goldstein is a .NET expert, a performance guru and a constant speaker at our conferences. On the two-day DotNext, which will be held November 12-13 in Moscow, he will give a hardcore report Debugging and Profiling. NET Core Apps on Linux . And on the eve of the conference, he will hold a separate training on Production Performance and Troubleshooting of .NET Applications.
Of the other reports, these three will probably also seem interesting to you:
You can view the entire conference program, get virtually acquainted with the speakers and purchase tickets on the event website .
Sasha talks about the methods and tools for analyzing the performance of applications, including those developed by him.
')
The article is based on Sasha’s speech at the DotNext 2017 Piter conference. Sasha works as the technical director of the Israeli training and consulting company Sela and knows firsthand how to conduct a performance analysis. How to start it better than complete it, what tools should be used, and what to avoid, read under the cut.
Performance Analysis: Step by Step
Let's start with the performance analysis framework. The following plan is used by developers, system administrators, any technical specialists:
- Getting a description of the problem. It sounds simpler than it actually is, because clients often describe problems very poorly.
- Building a system diagram. This makes it possible to realize what parts the problem consists of.
- Quick performance check. This allows you to understand what works in the system, what is overloaded, etc.
- Understanding which component is causing the problem. At this stage, we still do not know what the problem is, but we already understand where it is, so there is already progress.
- Detailed analysis. This stage takes the most time.
- Search for the root of the problem.
- Elimination of the problem.
- Check. At this stage, you need to check whether the problem is fixed and whether the system is now working correctly.
- Documenting the entire analysis process. This is necessary in order to know exactly what you have done, which tools worked for you, and which tools did not. This makes it possible not to repeat the same mistakes in the future.
Problem Description: Why is it sometimes so hard to get?
It is much more difficult to get an exact description of the problem from the client than it seems at first glance.
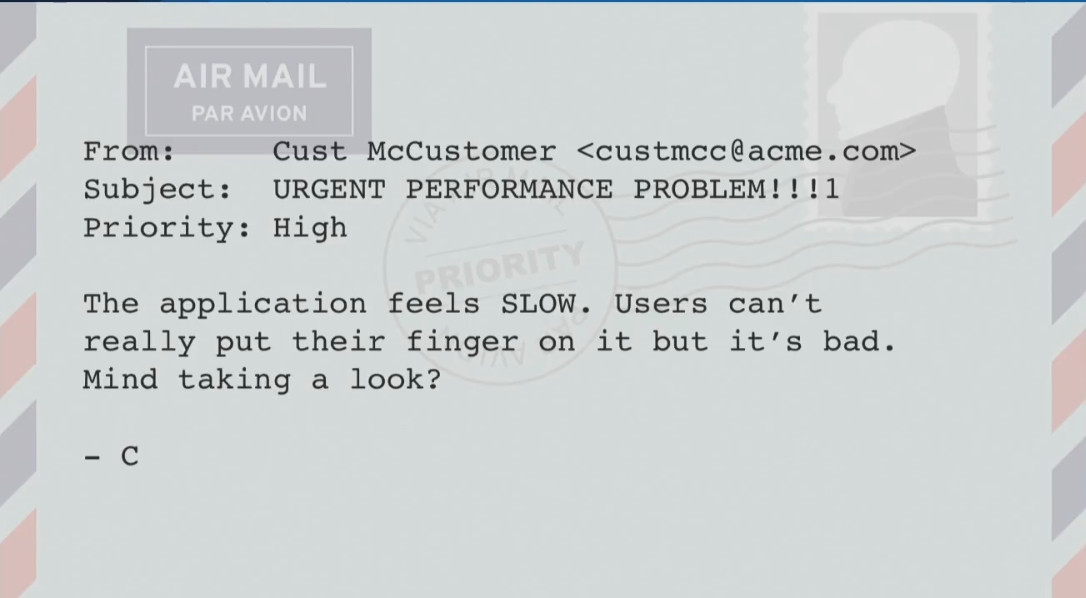
A client can deal with a problem like:
“The application is working too SLOWLY. Users can not say exactly when this happens, but this is bad. Can you see it? ”
Or
“We have a budget for productivity work, will you be able to look at our work environment for two days and find a problem?”
Of course, you can try, but it is unlikely to be a very good use of the allocated budget. The problem, formulated more precisely, may look like this:
“Starting from 4:25 in the morning, when accessing the ASP.NET site in 95% of cases, there is a delay of 1,400 ms (the normal response time is 60 ms). The delay is observed regardless of geographic location and does not decrease. We turned on automatic scaling, but that didn't help. ”
Such a description of the problem is much more accurate, because I see the symptoms and understand where to look, and I know what can be considered a solution to the problem (reducing the delay to 60 ms).
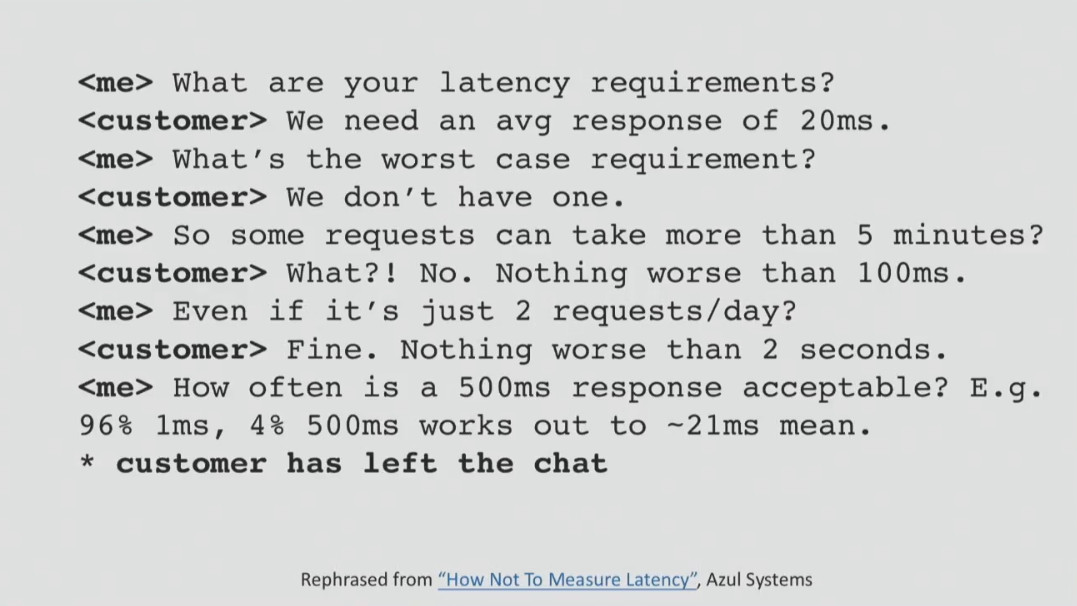
Sometimes it is much more difficult to find out what exactly is required by the client than it seems at first glance.
Each company has its own performance requirements, which, unfortunately, are not always formulated. For example, they may be:
- 90% of all full-text queries should be completed no later than 200 ms;
- 99% of all full-text queries should be completed no later than 600 ms;
- 100% of all full-text queries should be completed no later than 2000 ms.
When there are such requirements, it remains only to test the system for compliance with them and understand how to solve the problem. But it is important to understand that the requirements are not taken from nowhere, they must always be consistent with business goals. With well-defined requirements, you can always track the statistics in the APM-solution or in other ways and receive notifications when something goes wrong.
Anti-patterns: how not to perform analysis
Before diving into the analysis methods that give results, I want to talk a little about how not to analyze the problem. So you definitely shouldn't:
- Make assumptions;
- Trust "instincts" and absurd beliefs;
- Find a solution to a problem only where it is easiest to find (this behavior is also called the “street lamp effect.” He was shown by a drunkard from a famous anecdote who was looking for keys not where he lost them, but where it was light);
- Use random tools;
- Shift responsibility on tools.
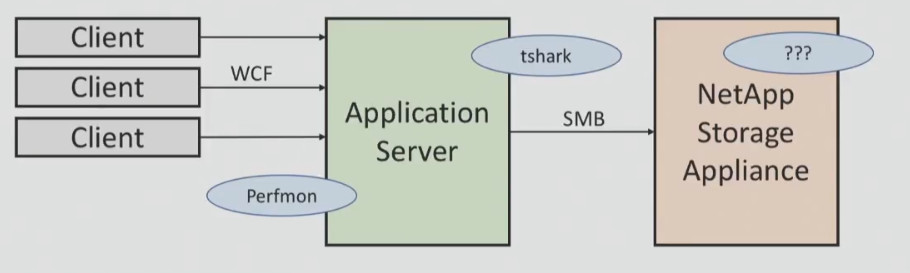
I will give an example of one unsuccessful analysis, which was never completed. My task was to understand why sometimes customers encounter significant delays when saving and loading documents in the project management system. The system was connected to NetApp via SMB on the local network, and my task was to find out the network latency and latency that could have occurred when working with the data warehouse.
I had tools for monitoring WCF and application server performance, I had a sniffer for network traffic, but I did not have access to NetApp storage. After a series of tests, I found out that the average response speed was 11 ms, but within 24 hours some cases of a 1200 ms delay were observed. I lacked information about what was happening on the part of NetApp, and it was necessary to obtain performance testing data.
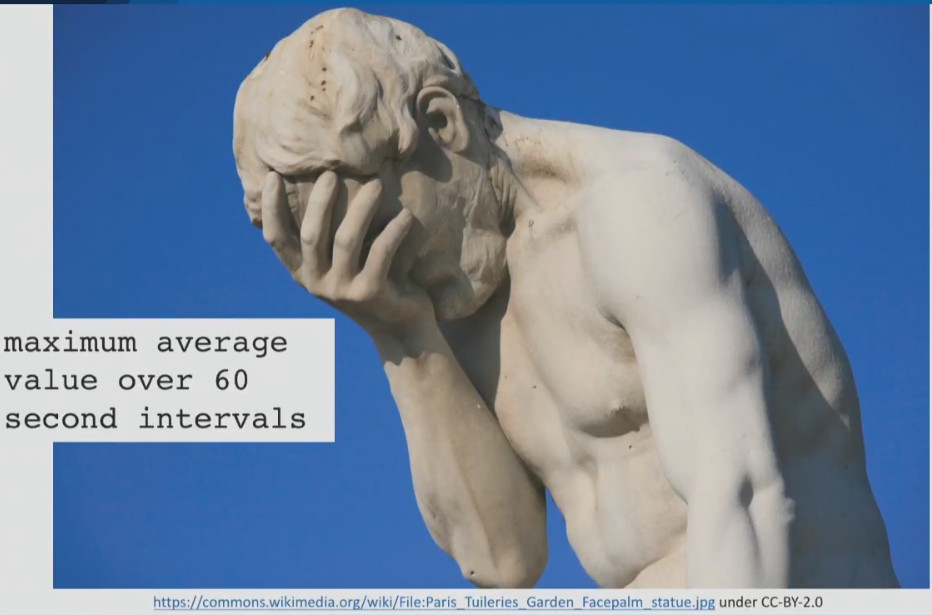
From the client, I was able to get only the information that the response speed of the data storage system could not be less than 5 ms. To my question about what this figure is: the average or peak delay, I received the answer: this is the maximum average value for 60 seconds. I still do not know what this value is, and I believe that you also do not know. He could take the average value every second and then the maximum value from all averages, or perhaps take the maximum value every second and then the average from the maximum ...
After that, I found in the documentation for NetApp performance counters that are considered valid for this storage system. These are average data per second, not per minute. I asked the client to provide me with this data, but I was refused. This attempt analysis ended.
For me, this is a classic case of how performance analysis cannot be done. I did my best to get as much information as possible and not to rely on assumptions , but I did not succeed because of the lack of mutual understanding with the client. And this is a good example of why you can not rely on assumptions and absurd beliefs.
Now about the unsuccessful use of tools.
Sometimes experts think that if they bought an expensive instrument, then they are simply obliged to use it for all analysis options. I will give a classic example of using the wrong tool for analysis.
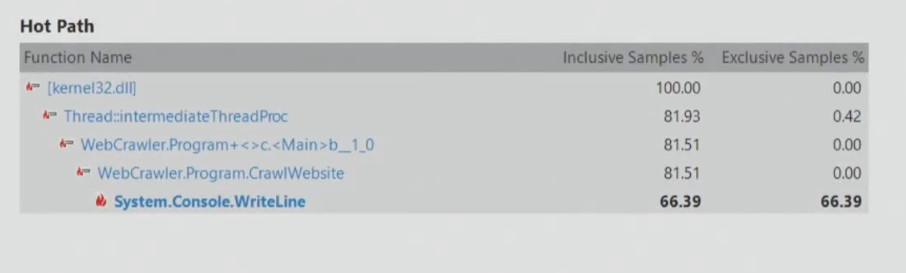
Let's run the Visual Studio profiling tools in CPU sampling mode to test the performance of the crawler. A robot can do some things that do not burden the processor, and if we do this test, we can get something like this:
From this it follows that it is necessary to improve the performance of System.Console.WriteLine, since this method slows down the application. However, the search robot can simply wait for the receipt of network data, it has nothing to do with the processor. Therefore, you can never choose a tool for analysis on the principle "simply because we bought it, and we need to recapture its cost."
Finding the source of the problem: USE method
Sometimes you just don’t know what to look for, in which case I suggest a methodology that is often used by engineers all over the world. This is the USE (Utilization, Saturation, Errors) method, which is handled in several steps:
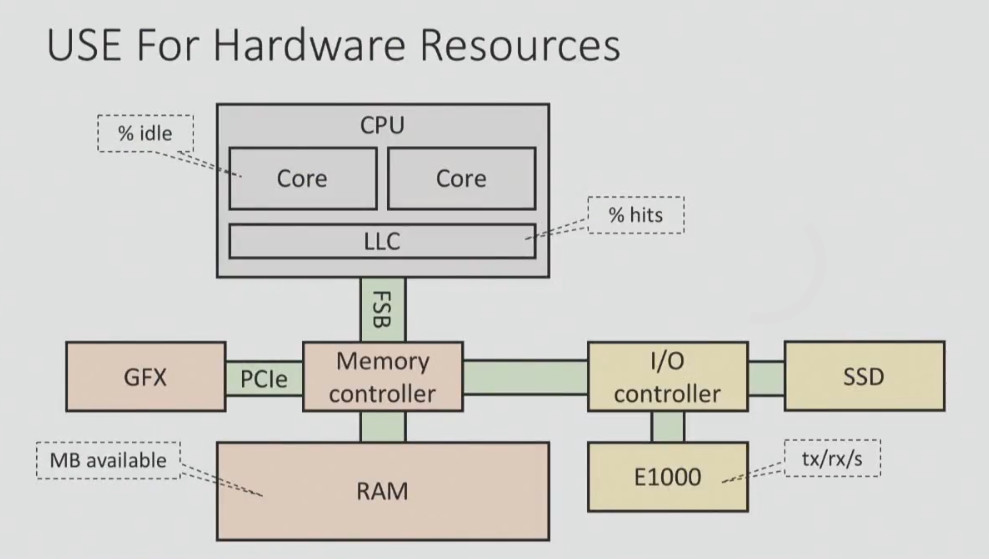
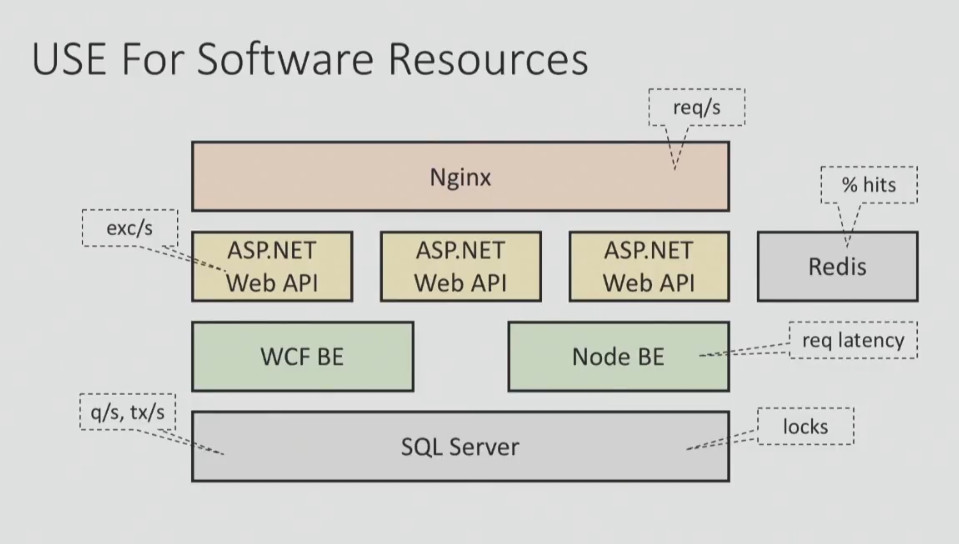
- At the first stage, it is necessary to construct a system diagram, including all the hardware and software resources and the connections between them;
- Then, for each resource and each link, you need to define three parameters: Utilization — use (how much the resource is loaded), Saturation — saturation (whether there is a queue to use this resource), and Errors — whether errors occur.
- If there are problems with any parameter, they need to be solved.
Here is what the USE method might look like for hardware and software resources:
You must have a checklist, according to which you systematically test each of the components to get the big picture.
Here is the checklist for Windows systems:
| Component | Type of | Analysis Tools or Tracked Parameters |
| Processor (_Total) \% ProcessorTime,% User Time Process (My App) \% ProcessorTime | ||
| System \ Processor Queue Length | ||
| Intel Processor Diagnostic Tool (and others) | ||
| Memory \ Available Mbytes Process \ Virtual Size, Private Bytes, Working Set .NET CLR Memory \ #Bytes in all Heaps VMMap, RAMMap | ||
| Memory \ Pages / sec | ||
| Windows Memory Diagnostic Utility (and others) | ||
| Network Interface \ Bytes Received / sec, Bytes Sent / sec | ||
| Network Interface \ Output Queue Length, Packets Outbound Discarded, Packets Received Discarded | ||
| Network Interface \ Packets Outbound Errors, Packets Received Errors | ||
| Physical Disc Disc Discs, Disc Ids, Disc Writes / sec | ||
| Physical Disc \ Current Disk Queue Length | ||
| Chkdisk (and other tools) | ||
| .NET CLR Exceptions \ # of Excepts Thrown / sec ASP.Net \ Error Events Raised |
Most of this data can be obtained using the built-in Windows performance counters. This check can be done very quickly, but it allows you to save a lot of time to focus on analyzing the problems found.
To automate this process, you can use a variety of solutions:
- Windows system monitor (Perfmon) - can collect logs of performance counters continuously or only when certain conditions are met.
- Typeperf - is able to generate a CSV file every second with performance counter values that are specified by the user.
- Third Party Solutions. For example, if you are working with a cloud solution, then the provider will most likely provide access to a tool for monitoring processor, disk, network activity, etc.
Performance analysis: what tools to use
Performance analysis tools can be divided into three categories:
- Those that help determine how often this happens (counting). For example, how many requests per second we get
- Those that help determine how long it takes (waiting time). For example, how long does my ASP.NET requests take, how long does it take to switch between windows, etc.
- Those that help determine why this happens (stacks). For example, where a certain condition occurs in the application source code
As a rule, the tools of the first category give a small overhead, when using tools to determine the waiting time, it is longer, and the tools of the third category lead to a significant overhead. This is not surprising, since the latter provide much more information.
When choosing tools, it is important to pay attention to five points:
- Small overhead
- Accuracy (how much can you trust the results)
- Fast results (when you do not need to wait hours for data analysis)
- Invasiveness (Ability to run on operating systems)
- The ability to focus on a specific area (class, function, etc.)
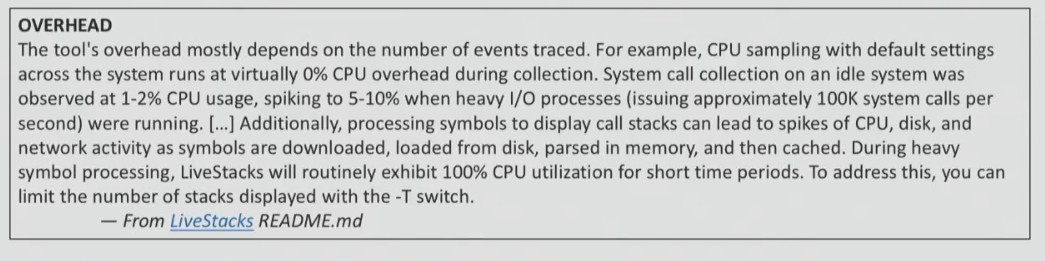
Remember the overhead!
Any observation can affect the state of the system, but some tools are stronger than others. Therefore, before using any tool it is best to refer to the documentation. As a rule, it indicates what can be expected from the use of the tool (for example, increasing the processor load by 5-10% under certain circumstances).
If the documentation for the tool you are going to use does not say anything about the overhead, then you will have to test it yourself. This should be done on a test system, measuring how much the performance drops.
Accuracy: a story with safe conditions
Perhaps, for those who do not work with Java, this will be news, but most CPU Java profilers that are used by developers give out incorrect data (VisualVM, jstack, YourKit, JProfiler ...). They use the GetAllStackTraces documented by the JVMTI API. It gives a sample of what each thread in the system does when you call the GetAllStackTraces function.
The advantage of using it is cross-platform, but there is a significant drawback. You only get the sample stream when all the threads are in safe conditions. That is, if you request a stack trace, you do not receive it from the current moment, but from some point later, when the thread decides that it wants to transfer its stack trace. As a result, you get results that have no relation to the real state of affairs.
In the screenshot below, you can see the data from a scientific report on the accuracy of Java profilers.
On the graph, you can see the data of four profilers on which of the methods on a particular benchmark was the hottest. Two of the four profilers (right and left) determined that this was the jj_scan_token method, the third profiler determined that it was the getPositionFromParent method, and the fourth was the DefaultNameStep.evaluate. That is, four profilers gave completely different readings and completely different methods. And here it’s not the profilers, but the API that they use to get the results from the target process.
That is why, if you use a new tool, you must test it in different conditions (when the processor is actively working, at rest or reading data from the disk). And you need to make sure that the profiler provides the correct data, and then look at the overhead. If the data is incorrect, then this profiler, of course, should not be used.
Results: how fast will you get them?
Here I want to give an example of instructions for profiling. NET Core on Linux.
We will not consider it in detail, we will address only some points. It begins with the need to set up an environment variable, which I, for example, have problems with. Well, let's say you did it. The instruction ends with the need to take a zip file generated as a result of all these steps, copy it to a Windows machine and open it using PerfView. And only then can you analyze the data. It sounds ridiculous, is not it? Perform an analysis on Linux, and then open it on Windows ...
Here is an alternative solution to the same problem. These scripts do not work very well, but at least they provide an opportunity to get results on Linux.
$ ./dotnet-mapgen.py generate 4118
$ ./dotnet-mapgen.py merge 4118
# perf record -p 4118 -F 97 -g
# perf script | ./stackcollapse-perf.pl> stacks
$ ./flamegraph.pl stacks> stacks.svg
As a result, you get a visualization called a flame graph. I will focus on it in more detail, since many Windows and .NET developers are not yet familiar with it.
This method allows you to visualize different stack traces, for example, where an application often accesses a disk, when there is a heavy processor load, etc. When you have many different stacks, a flame graph is a good way to visualize them instead of reading a lot of text. Flame graph turns thousands of stack trace pages into one interactive graph.
Each rectangle in the graph is a function. Colors are selected in a random order, so they can be ignored. The Y axis is the depth of the stack, that is, if one function called another, it will be located above it, and will be shown above in the graph. The X axis is sorted stacks (not time). Having such a schedule, it is very easy to bring exactly the area that you are interested.
Invasiveness: how to do no harm
Invasive profilers can have a bad effect on performance, reliability, and system response because they are too “heavy”. For example, when using the Visual Studio profiler in instrumentation mode and IntelliTrace, the application is recompiled and launched with additional markers. Such a tool cannot be used in a working environment.
Another example is the CLR Profiling API, which is still used in some tools. It is based on the implementation of the DLL in the target process. This may be acceptable when developing, but in a production environment it can be problematic to embed a library in a running process.
The Linux extreme example is the Linux SystemTap, LTTng, and SysDig trace frameworks that require the installation of a custom kernel module in the system. Yes, you can trust these guys, but it's still a bit suspicious that you need to load something new into the kernel to run the performance measurement tool.
Fortunately, Windows has a fairly lightweight Event Tracing framework (Windows), which you may have heard about. With this framework, you can profile the processor, determine where the garbage collections are, which files the application gets access to, where it accesses the disk, etc.
But despite the fact that ETW is not too invasive, the speed of getting results from it can sometimes be a problem. Below I give an example from a log file generated using PerfView:
As you can see, I collected information about the use of the processor for 10 seconds, and a total of 15 MB of data. Therefore, it is unlikely that you will be able to test the system using Event Tracing for hours - the amount of data will be too large. In addition, the CLR Rundown took 12.7 seconds to complete, then it took some time to convert and open the data (I highlighted the time in red). That is, to get the data collected within 10 seconds, you need to spend half a minute to process and open them.
Despite the fact that this is considered a fairly good result, I do not really like it. Therefore, I would rather tell you about the tools that I wrote myself and without which I simply cannot live.
Etrace (https://github.com/goldshtn/etrace) is the open source command line interface for ETW. You can tell him what events you want to see, and he will give information about them in real time. As soon as an event occurs, it can be seen on the command line.
> etrace --help
...
Examples:
etrace --clr GC --event GC / AllocationTick
etrace --kernel Process, Thread, FileIO, FileIOInit --event File / Create
etrace --file trace.etl --stats
etrace --clr GC --event GC / Start --field PID, TID, Reason [12], Type
etrace --kernel Process --event Process / start --where ImageFileName = myapp
etrace --clr GC --event GC / Start --duration 60
etrace --other Microsoft-Windows-Win32k --event QueuePostMessage
etrace --list CLR, Kernel
For example, you run etrace and say: I want GC events. As soon as such an event starts, I want to see its type, reason, process, etc.
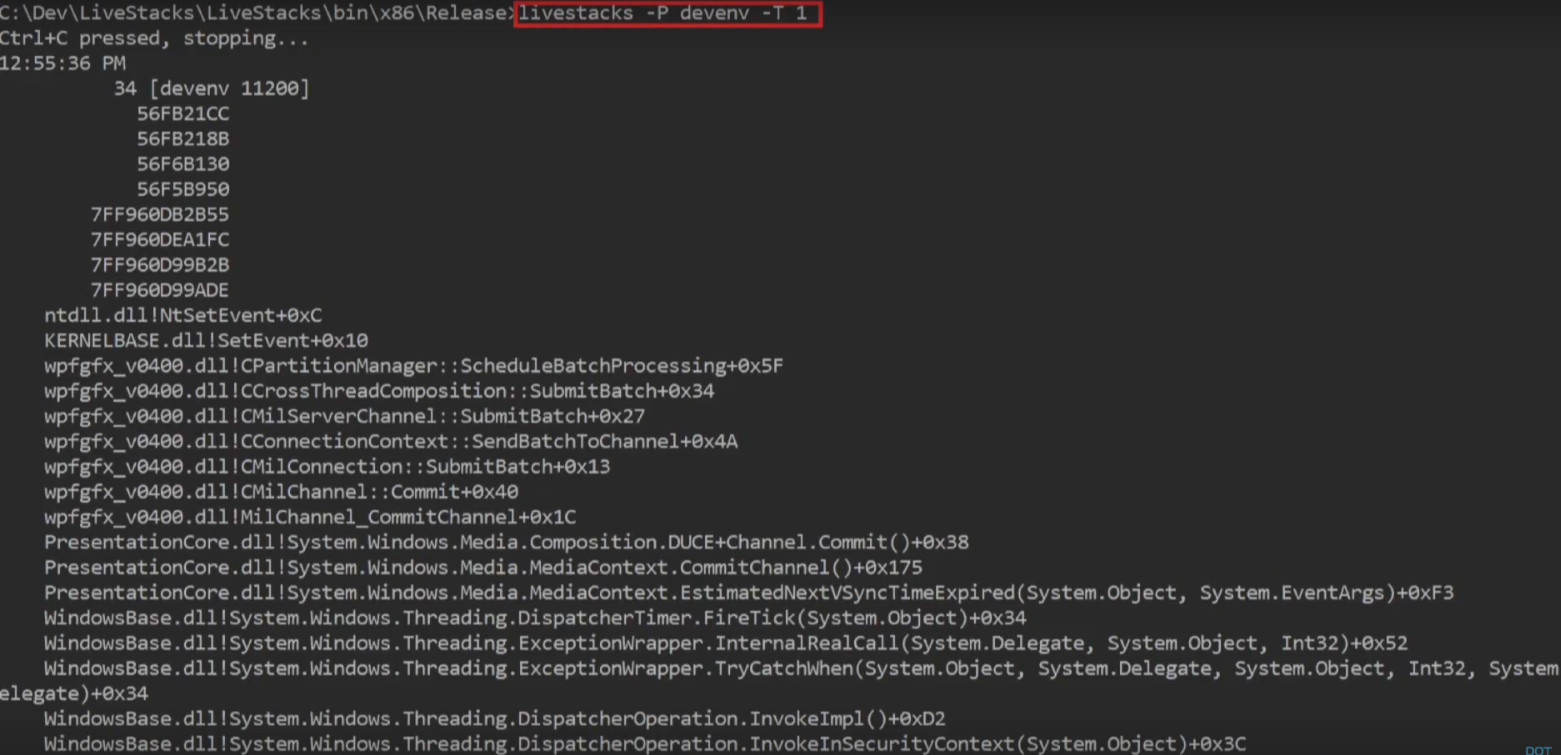
Another tool that I wrote myself and I want to present to you is LiveStacks . He is also related to ETW. LiveStacks collects stack traces for interesting events (where are garbage collections, where there is a load on the processor, which files the application gets access to, where it accesses the disk, etc.). The main difference between LiveStacks and other similar tools is to display information in real time. You do not need to wait until data processing is complete to find out what processes are taking place.
Here is an example of the processor profiling mode that is used by default. LiveStacks looks at the process in Visual Studio and shows the call stack in a process that requires the most CPU time.
Another example: when asked, “ show me where garbage collection starts, which call stack caused the garbage collection to run in a specific process or across the entire system ” LiveStacks gives you a call stack in real time with information about where garbage collection takes place:
From the results, LiveStacks can generate flame graphs by visualizing the call stacks that were displayed in the console.
> LiveStacks -P JackCompiler -f> stacks.txt
ˆC
> perl flamegraph.pl stacks.txt> stacks.svg
I use these tools because they give me the opportunity to get results quickly, without waiting for data processing.
How to build systems for effective instrumentation
When you build a system, library, architecture for your new project, you should think in advance about some things that in the future will simplify the performance analysis:
- Make sure that the call stack for interesting events (disk access, garbage collection, etc.) is easy to get;
- Implement static code instrumentation (tracepoints) so that people can get real-time information about the processes;
- Take care that important processes can be enabled without an overhead projector, without the need to restart the system, but simply by setting up at the log level;
- Add debug points (probes) for dynamic instrumentation;
- Create examples and a documentation file so that people performing performance analysis do not need to spend too much time understanding how your system works.
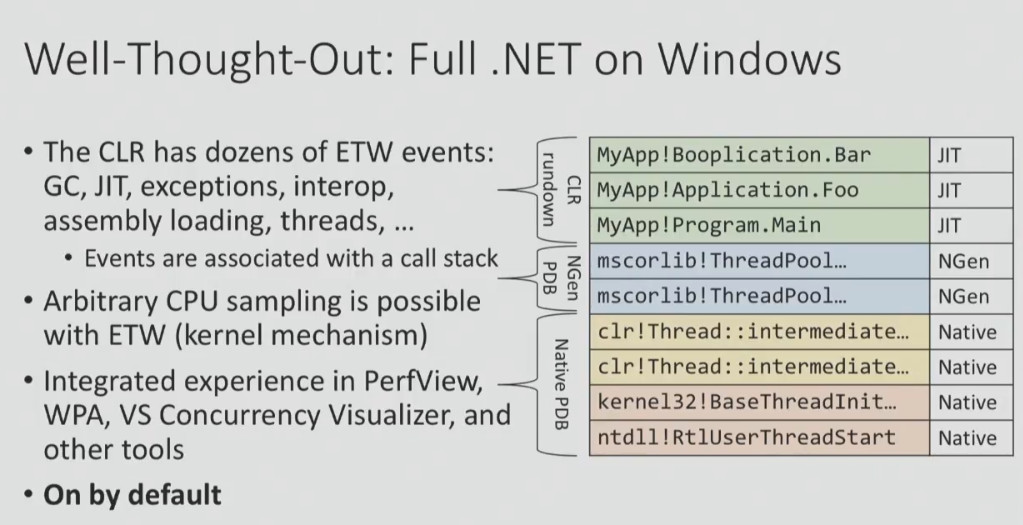
An example of a project with very good instrumentation tools is .NET on Windows, which has been used by many people for more than 10 years. There are ETW events that I mentioned above, there is an opportunity to capture the call stacks of interesting events and convert them into function names. And all this is included by default!
Making a project with such instrumentation tools is not easy. Say, if you look at .NET Core 2.0 for Linux, everything is not so rosy. And not at all because there are no good tools for performance analysis in Linux, but because it is rather difficult to build a platform that would be easy to profile and debug.
Do you want to know what is wrong with .NET Core 1.0 for Linux? The platform has events, but it is impossible to receive call stacks, you can only find out that an event has occurred (which is much less informative). Another example: to convert call stacks to get the names of functions, you need to do a lot of preliminary actions. That is why the documentation proposes to take a ZIP file and open it in Windows (I gave this example above).
It's all about priorities. If you think that the possibility of performing a performance analysis is an important requirement for the system you are developing, you will not release something like this. Although, of course, this is just my point of view.
Be careful with the statistics!
Statistics and tools often deceive us. This is what you should always remember in this regard:
- Average values are meaningless.
- Medians are meaningless.
- Percentiles and distributions are useful only if you know exactly what you are doing.
- Use good visualization for your data.
- Beware of the phenomenon of coordinated omission.
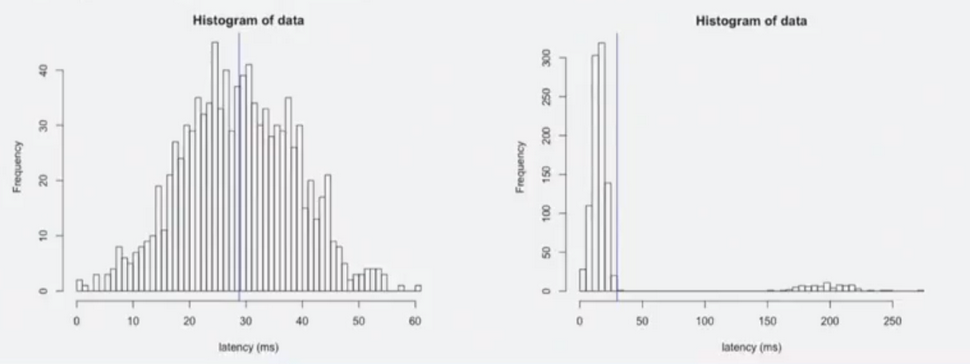
For example, someone tells you that "the average response time of the system is 29 ms." What can this mean? For example, the fact that, with an average response time of 29 ms, the worst value is 50 ms or 60 ms, and the best is close to zero. Or it may mean that for most cases the response time is 10 ms, but there is a mode in which the system is much slower (with a response time of up to 250 ms), and the average value is also 29 ms.
You can see that the two graphs showing these two cases with the same average response time are completely different. In order to understand the real picture of what is happening, it is not enough to look at the numbers, you need to look at the real distribution.
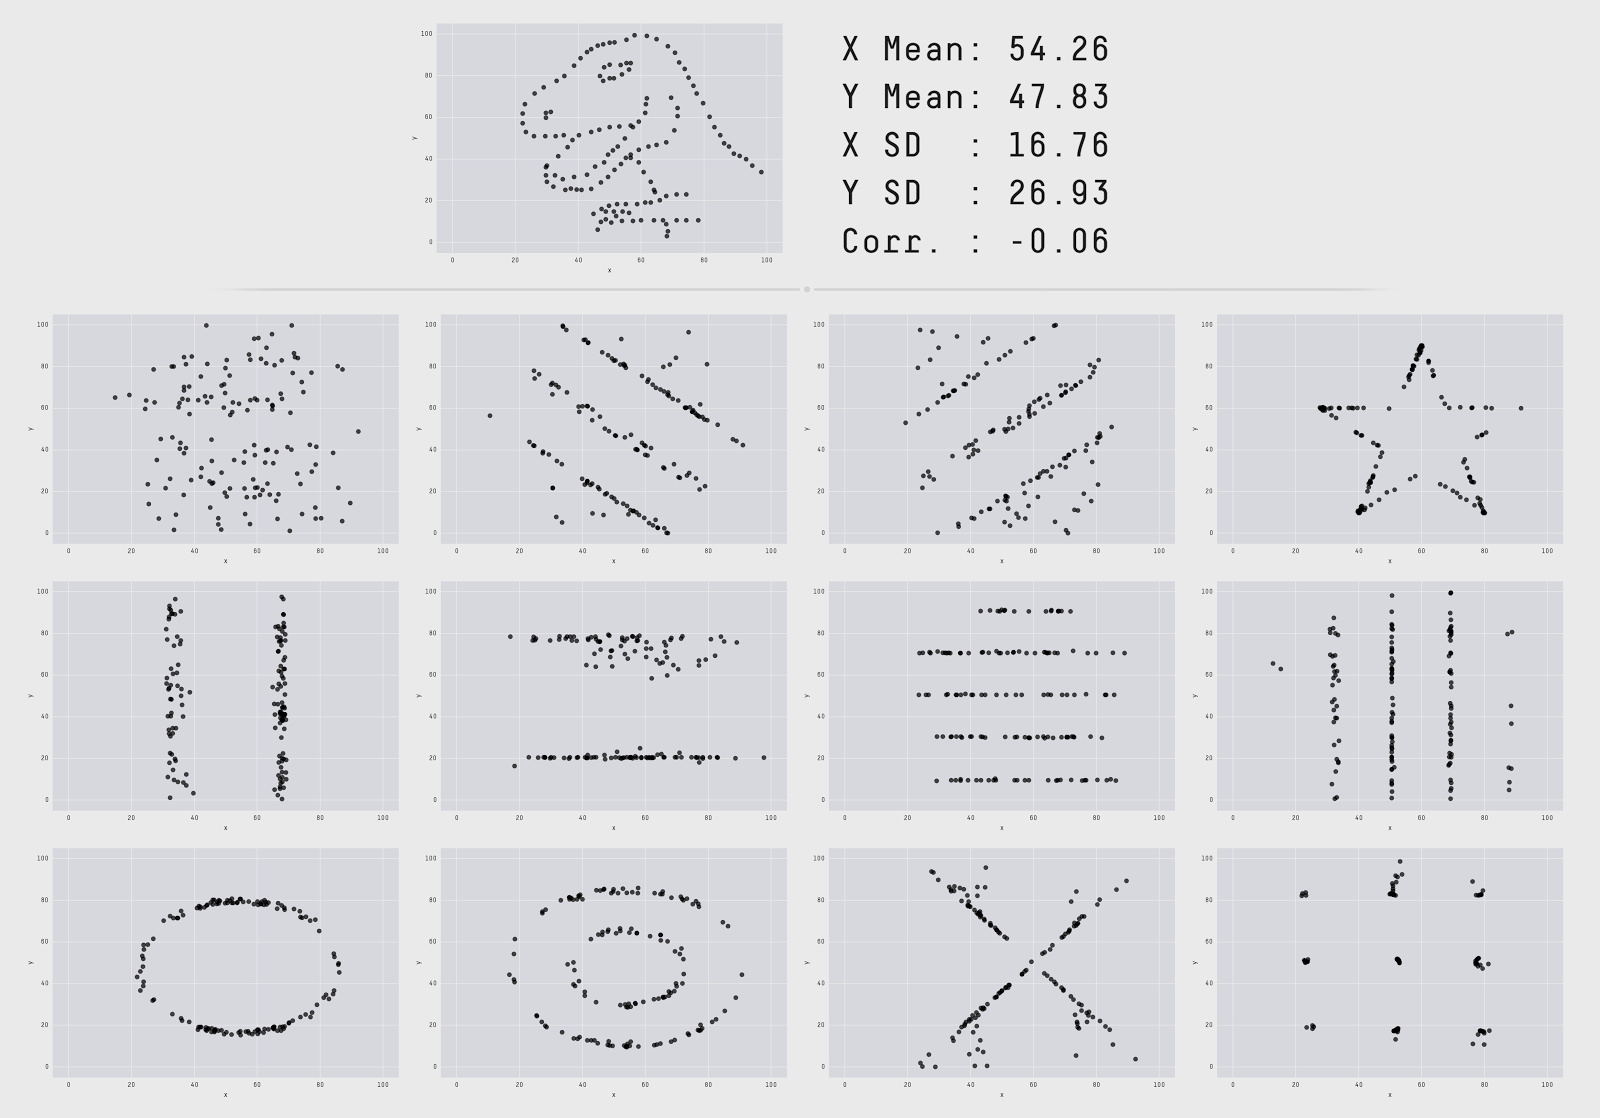
There is a great study I found on the web. It demonstrates why you can never trust only summary statistics and always need to visualize the data.
The authors visualized 13 data sets with the same summary statistics (the same mean x / y, one standard deviation x / y, and the same cross-correlation). However, these datasets look completely different. That is, when you look only at numbers, it means nothing. You do not see the "form" of your data when you look only at the numbers.
BenchmarkDotNet is the library that many of you use. It is simply gorgeous, but does not show the “form” of your data (at least, by default). When you run it in the console, it gives out a lot of numbers: averages, standard deviations, confidence intervals, quartiles, but not the "form" of the data. And this is very important. For some types of analysis, the inability to see the "form" of the data means that you miss important things.
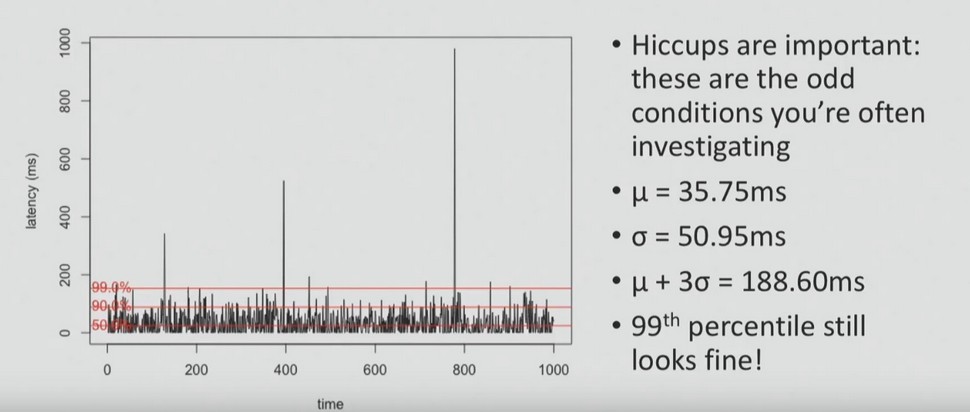
Here is an example of what you can skip by relying on averages. This graph shows the delay time. In 99% of cases, the response time is just under 200 ms, but periodic stuttering can be observed — too long delays (even up to 10 ms) occurring over a short period of time.
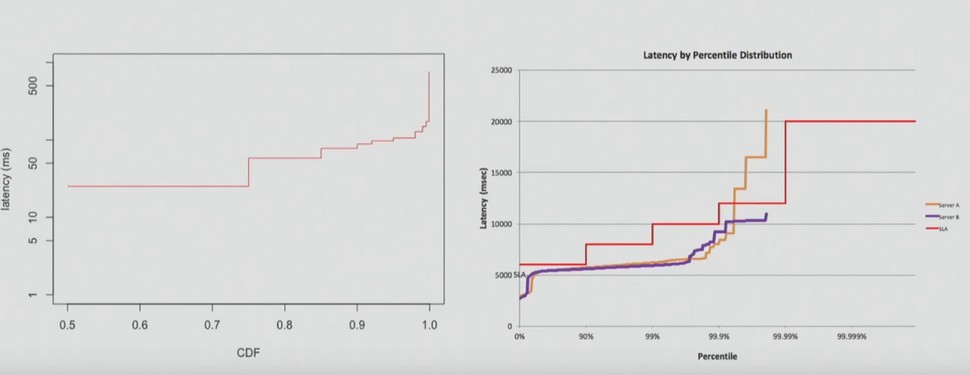
And in most cases, when performing performance analysis, they are asked to pay attention to stuttering - to the fact that they are above average values, to problems that users sometimes face. In order to identify them, it is necessary to visualize all the data points, as in the graph above, or to build the distribution, as in the graph below.
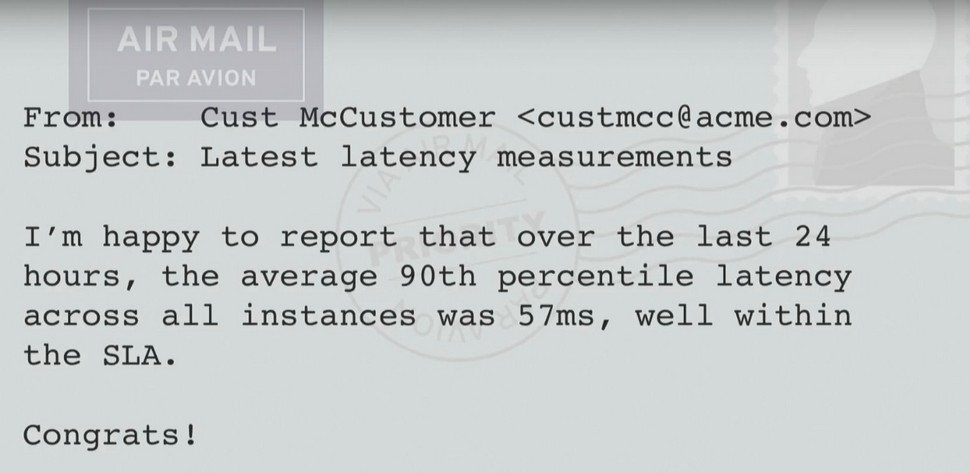
Another common mistake people make with percentiles is to perform mathematical operations with them. For example, it is impossible to average percentile, as my client did, whose letter you can read below.
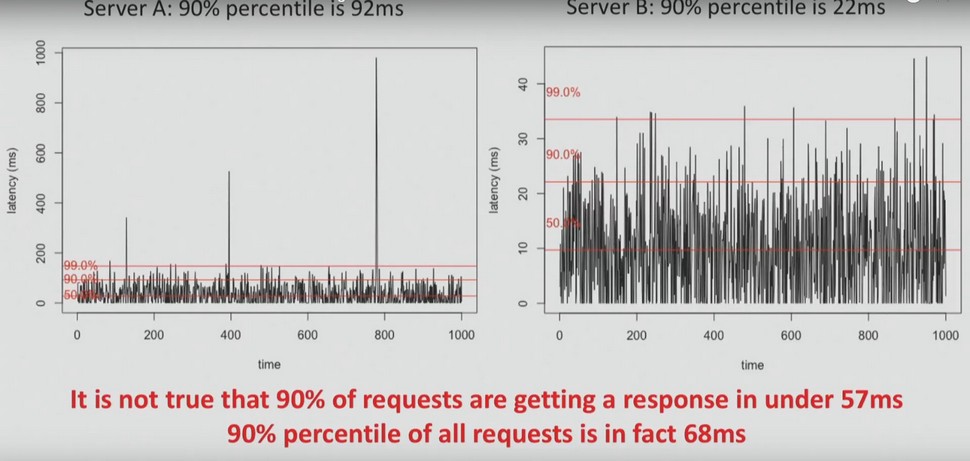
Imagine that you have two servers. For server A, the delay time is 90 ms for 90% of the time; for Server B, the delay time is 90 ms for 90% of the time.
It is important to understand that you cannot average these values. It is not true that 90% of requests respond in less than 57 ms. In fact, 90% of requests respond in less than 68 ms.
Therefore, interest, quartiles, etc. can never be averaged. We must always look at the data and their distribution.
Sometimes you can hear something like: “Who cares about the 99th percentile? None of my users can even see this! ”I will explain why this is important on the example page of Amazon.com. She made 328 requests. Assuming that all requests are independent, what is the probability that at least one of them was in the 99th percentile?
P = 1 - 0.99 328 ~ 96%
The answer is 96%. Therefore, it is very likely that when you go to the Amazon.com page, you will receive at least one request in the 99th percentile. And if your users get access to a system that is relatively complex, then the likelihood that the worst scenario will happen to them is very high.
Use serious tools for large systems!
The last thing I would like to mention in this article is the need to use special tools for systems consisting of a large number of machines. This is what these tools should be able to do:
- ;
- ID ;
- ;
- , , .
There are a lot of such tools. One example of an application performance monitoring tool is Vector from Netflix. On the information panel you can see the summary statistics, but at the same time, at any time, you can click on a specific instance and, say, view the processor flame graph for this instance or the use of disk resources.
Another example is the New Relic AMP solution , which also works with .NET. It shows you requests in the system and where you spend time servicing these requests. And if you want, you can switch to a specific request, to a specific user session.
When the work is completed: do not forget to document!
After the performance review is complete, do not neglect the opportunity to sit down and document what has been done. What exactly is worth doing?
- Document the steps that were taken to find, diagnose, solve, and verify the problem.
- What tools did you use? How can they be improved? What didn't work?
- What prevented you from doing research?
- Can you add monitoring tools for system administrators?
- Can you add tools for those who will analyze the system after you?
- If this problem occurs again, how can you automate its solution?
- Documenting the process will help you and the entire team avoid the same mistakes in the future, as well as possibly automate repetitive tasks.
Sasha Goldstein is a .NET expert, a performance guru and a constant speaker at our conferences. On the two-day DotNext, which will be held November 12-13 in Moscow, he will give a hardcore report Debugging and Profiling. NET Core Apps on Linux . And on the eve of the conference, he will hold a separate training on Production Performance and Troubleshooting of .NET Applications.
Of the other reports, these three will probably also seem interesting to you:
- another hardcore performance from Karel Zikmund from Microsoft ( High performance Networking in .NET Core )
- typical performance testing problems and possible approaches to solving them in the speech of Andrey Akinshin from JetBrains ( Let's talk about performance testing)
- serious talk about high-performance code in the report by Federico Lois from Corvalius ( Patterns for high-performance C #: from algorithm to low-level techniques)
You can view the entire conference program, get virtually acquainted with the speakers and purchase tickets on the event website .
Source: https://habr.com/ru/post/339926/
All Articles