APDEX and 1C Performance Measurements
In continuation of the article about our use of 1C Fresh, we will tell you how to learn to monitor the performance and speed of our installation.

In any company that produces any product, there is a quality control department. Usually this department checks the output, exactly what the consumer gets into his hands. If the company provides services, then there are special people who ring up customers and find out if they liked everything. After that, based on the collected statistics, any changes are made to the process and everything is repeated in a circle. Well, of course, if such departments and people exist in the company. In our world, most often either you use what you have, or you are looking for other companies and no one worries about it.
In our Button, our users of the 1C Fresh product are primarily our accountants. The higher the stability and speed of 1C, the higher the speed of the accountant. This means that customers who are served in the Button will receive faster payments for taxes, advance payments, salaries, etc.
There are many different options for assessing the performance (or quality) of IT systems and software. To assess the performance of our 1C Fresh, we use many well-known methods APDEX.
')
Apdex (Application Performance Index) - application performance index. An open international standard designed to form an objective assessment of the performance indicators of corporate information systems.
Apdex serves to measure user satisfaction with system performance. This experience can be represented on a scale from excellent to unsatisfactory.
The technique consists of the following steps:
- getting a list of key operations;
- determining the priority of each operation;
- determination of target time for each operation;
- collection of information on the execution time of each key operation;
- obtaining an estimate based on the information collected.
Upon completion of all these steps, it becomes possible to interpret the result in terms of qualitative assessment. About Apdex is information on the site 1C , where we actually scooped knowledge.
The first step in measuring performance using the Apdex methodology is to highlight the list of key operations. Having conducted some analytics together with our accountants, we identified a number of operations that are most often used in work with 1C.
The second stage is the determination of the priority of each operation. The higher the priority, the more important the performance of the operation. Properly placed priorities will allow us to further assess the severity of performance problems in the system, and correctly prioritize the work on optimization.
The next stage is the most interesting: determining the target time for each operation. Those. it is necessary to select the time for performing the specified operation in seconds (T), which will satisfy the client, i.e. our accountant. For each operation, we subjectively identified T and recorded in our table.
The next step is to collect information about the time of each operation. 1C took care of this and took this functionality into account in their products. We took the measurements from the configuration of Enterprise Accounting 3.0. In order for 1c to start measuring the time for performing operations, it is necessary to set the constant “Perform performance measurements”. It is necessary to do this for each IB operating in the service model.
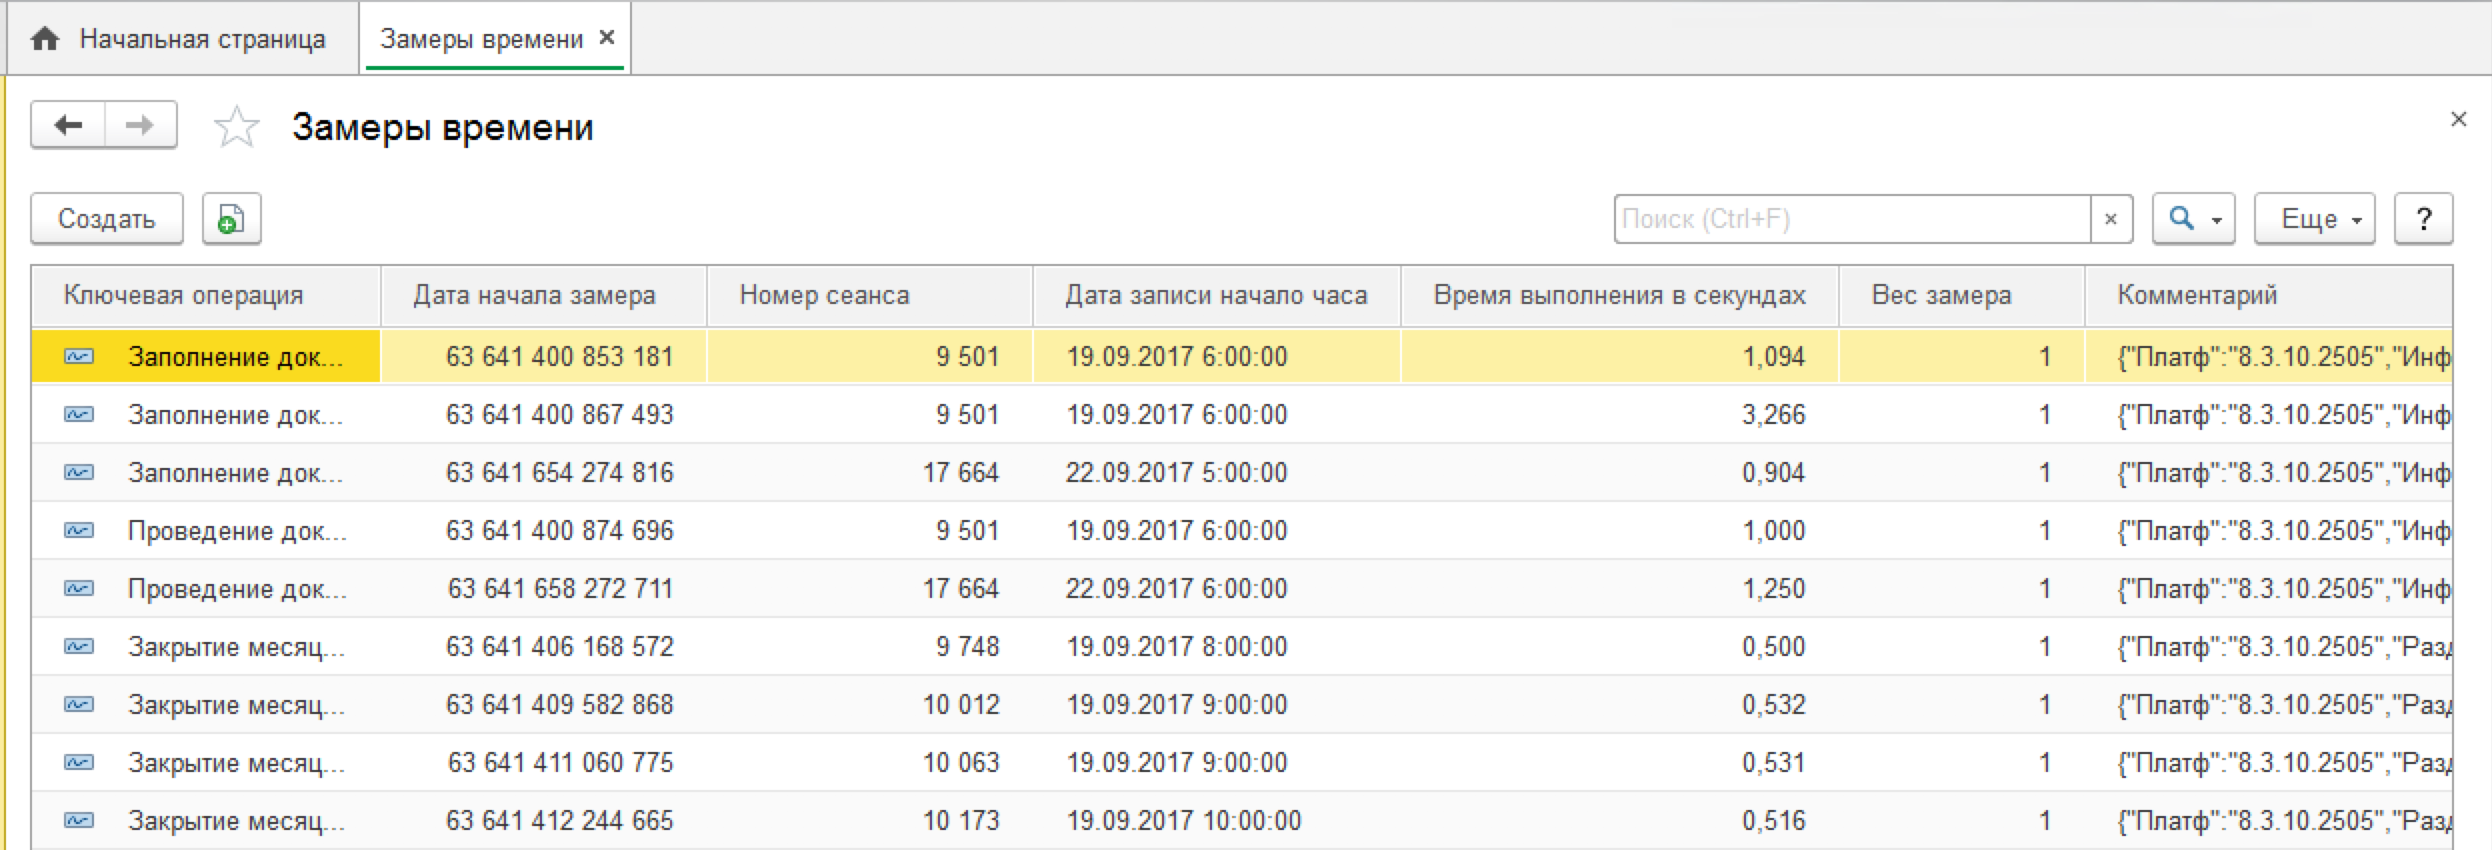
After that, all measurements of the execution time of user operations will be recorded in the “Time Measurements” information register, from where this information can be obtained in various ways.
And finally, the fifth stage, obtaining an assessment of APDEX based on the collected results.
The formula for calculating APDEX: APDEX = (NS + NT / 2) / N
Where:
N is the total number of executions of this operation;
NS is the number of executions with a response time from 0 to T;
NT is the number of executions with response times from T to 4T.
The calculation results will add to the table:
The APDEX technique allows us to interpret the obtained numerical values of the coefficient in terms of qualitative estimates. For this, the APDEX Scale is provided, which contains the following ranges of values:
Interpreting the values, we get the following table:
To monitor the performance and availability of services, we use Zabbix and the Grafana add-on. For all our services, including 1C Fresh, the following indicators are monitored: CPU load on each server, amount of free RAM, queue depth of the disk subsystem (load by disk I / O operations), amount of free disk space, number of INSERT operations, UPDATE , DELETE per second on the database server.

To track Apdex scores, we didn’t come up with anything new and added a score display in Zabbix. In order for Zabbix to receive data on the execution time of operations from 1c, they must first be unloaded somewhere. To do this, we use the PostgreSQL intermediate database. You can upload data from 1C to the database in several ways. We implemented this mechanism through routine tasks.
Each scheduled task can be run on schedule:
In the process of starting, a scheduled task generates a background task, which performs the actual processing. The routine task can be executed on behalf of the specified user and has the ability to restart (for example, in the event of an unexpected shutdown).
For unloading, we will use the following register values:
1. Name of the database of the applied configuration. Since 1C Fresh technology assumes the use of a large number of databases and application solutions, we need to distinguish measurements for each of them.
2. The name of the operation.
3. Start time
4. The time of the operation
5. The data area in which the operation was performed
6. The user who performed the operation
The background task is a procedure:
By unloading data from 1C in this way, we will now have no difficulty in processing this in Zabbix. Using the example of the “Total application launch time” operation in IB ea_01, we will form an sql query to the database:
In the first step, we will create a configuration file for the agent, which will be executed on the database server where the measurement data is stored.
Using parameters will give us the opportunity to use this configuration file for various information databases and measured operations.
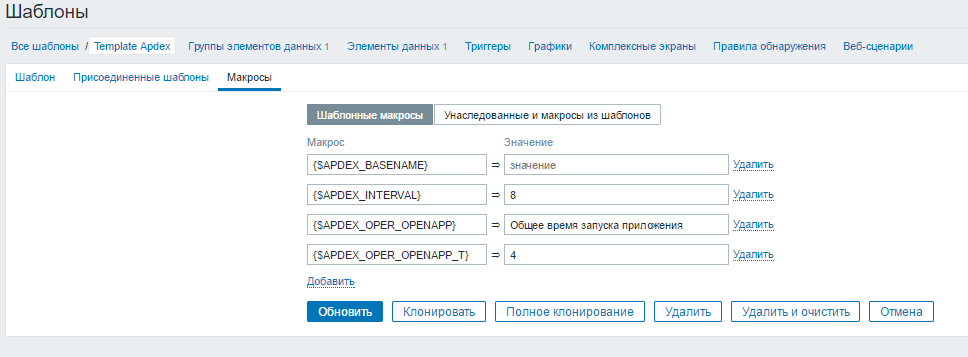
In the second step, we will create a template in Zabbix, where we will describe the macros we need:
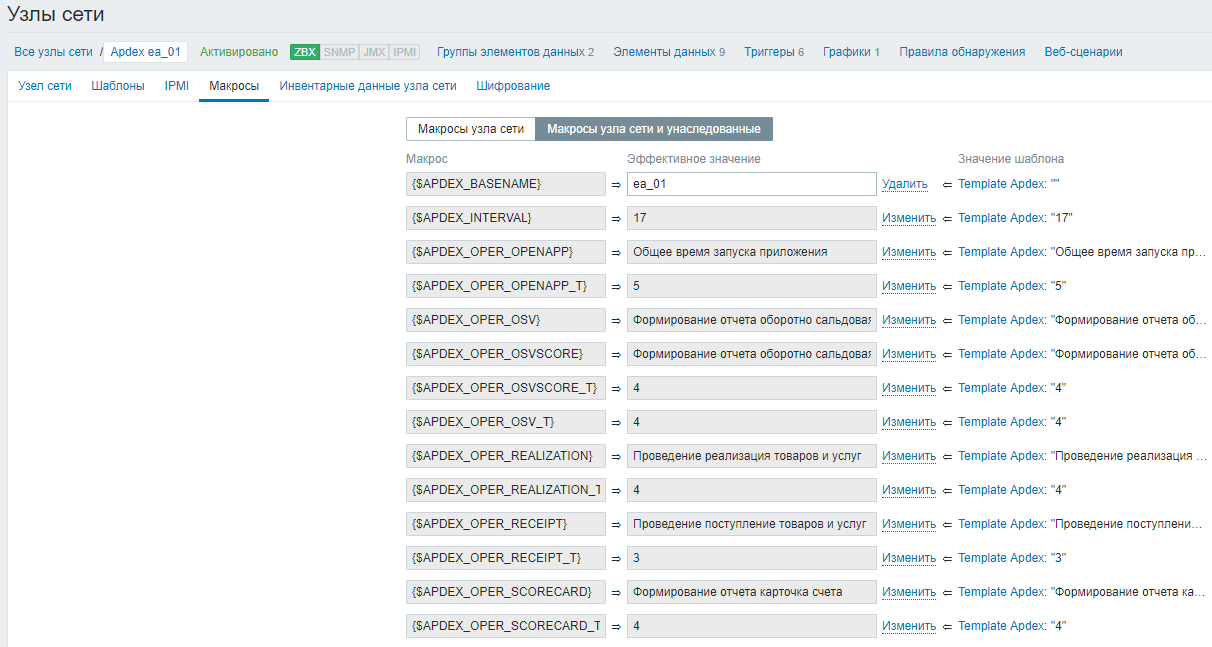
Then we bind this template to the required network node and redefine the individual parameters for macros.
Repeating these steps for each measured parameter, we will receive continuous performance monitoring using the APDEX technique.
Now, almost in real time, we can see Apdex rating on our 1cFresh databases. But we went further.
In addition to automatic monitoring of indicators, we also set up an automatic response to a drop in performance on any parameter. Zabbix provides a lot of room for the implementation of various reactions through scripting tools.
We will respond to a drop in performance by including the 1C: Enterprise technology journal.
The script is quite simple:
The performance of the operation drops → a trigger triggers a drop → an action is triggered, which edits the technology log settings file.
After analyzing the problem, or restoring performance, the reverse actions are carried out.
Performance goes to a normal level → a trigger is triggered → the technical log settings block is deleted.
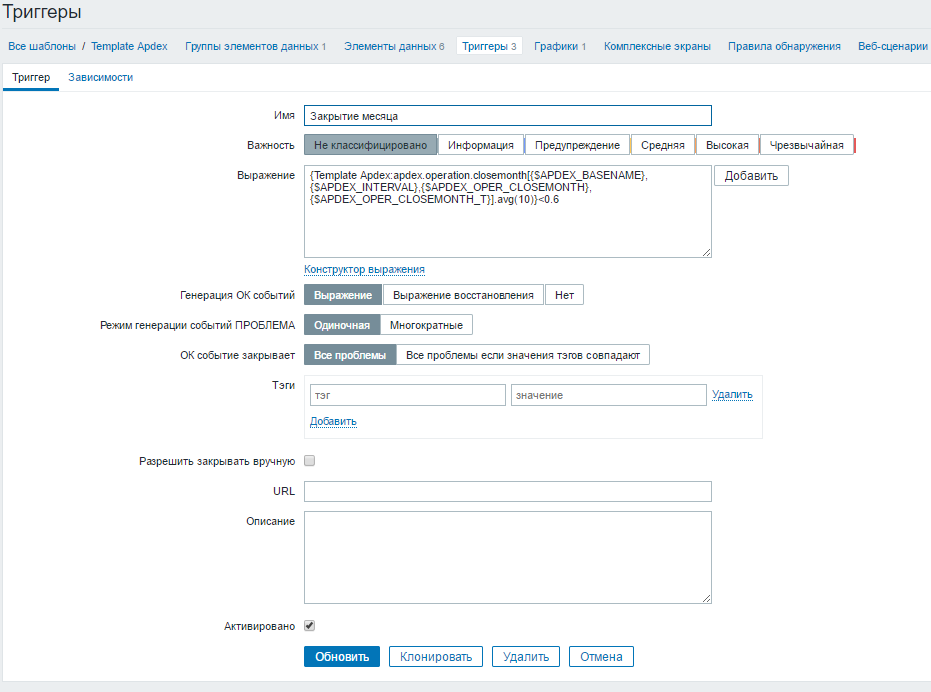
Create a trigger in which we write the trigger conditions. In our case, the Apdex score falls below 0.6.
Then create an action to trigger the trigger.

In this action we set the command

Based on the collected TJ, it is possible to analyze what caused the performance drop, what were the errors, what the user was doing at the moment, which user, etc. Comparing the data of TJ and monitoring Zabbix, you can draw conclusions and develop plans for troubleshooting, optimizing hardware, optimizing user experience.
Thanks to monitoring and performance evaluation, we were able to reach the 99% availability rate of our 1C Fresh installation. Our Apdex scores have not yet reached 1.0, but we are already working on it :)
Introduction
In any company that produces any product, there is a quality control department. Usually this department checks the output, exactly what the consumer gets into his hands. If the company provides services, then there are special people who ring up customers and find out if they liked everything. After that, based on the collected statistics, any changes are made to the process and everything is repeated in a circle. Well, of course, if such departments and people exist in the company. In our world, most often either you use what you have, or you are looking for other companies and no one worries about it.
In our Button, our users of the 1C Fresh product are primarily our accountants. The higher the stability and speed of 1C, the higher the speed of the accountant. This means that customers who are served in the Button will receive faster payments for taxes, advance payments, salaries, etc.
There are many different options for assessing the performance (or quality) of IT systems and software. To assess the performance of our 1C Fresh, we use many well-known methods APDEX.
')
Apdex. reference
Apdex (Application Performance Index) - application performance index. An open international standard designed to form an objective assessment of the performance indicators of corporate information systems.
Apdex serves to measure user satisfaction with system performance. This experience can be represented on a scale from excellent to unsatisfactory.
The technique consists of the following steps:
- getting a list of key operations;
- determining the priority of each operation;
- determination of target time for each operation;
- collection of information on the execution time of each key operation;
- obtaining an estimate based on the information collected.
Upon completion of all these steps, it becomes possible to interpret the result in terms of qualitative assessment. About Apdex is information on the site 1C , where we actually scooped knowledge.
Implementation. Theory
The first step in measuring performance using the Apdex methodology is to highlight the list of key operations. Having conducted some analytics together with our accountants, we identified a number of operations that are most often used in work with 1C.
The second stage is the determination of the priority of each operation. The higher the priority, the more important the performance of the operation. Properly placed priorities will allow us to further assess the severity of performance problems in the system, and correctly prioritize the work on optimization.
The next stage is the most interesting: determining the target time for each operation. Those. it is necessary to select the time for performing the specified operation in seconds (T), which will satisfy the client, i.e. our accountant. For each operation, we subjectively identified T and recorded in our table.
| Operation | A priority | T |
| Carrying out the receipt of goods and services | 3 | one |
| Total application launch time | 2 | 3 |
| Formation of the report "card account" | 6 | four |
| SALT formation | four | 3 |
| The formation of the salt in the account | five | 3 |
| Carrying out the sale of goods and services | one | 3 |
The next step is to collect information about the time of each operation. 1C took care of this and took this functionality into account in their products. We took the measurements from the configuration of Enterprise Accounting 3.0. In order for 1c to start measuring the time for performing operations, it is necessary to set the constant “Perform performance measurements”. It is necessary to do this for each IB operating in the service model.
After that, all measurements of the execution time of user operations will be recorded in the “Time Measurements” information register, from where this information can be obtained in various ways.
And finally, the fifth stage, obtaining an assessment of APDEX based on the collected results.
The formula for calculating APDEX: APDEX = (NS + NT / 2) / N
Where:
N is the total number of executions of this operation;
NS is the number of executions with a response time from 0 to T;
NT is the number of executions with response times from T to 4T.
The calculation results will add to the table:
| Operation | A priority | T | N | NS | NT | APDEX |
| Carrying out the receipt of goods and services | 3 | 3 | 387 | 320 | 34 | 0.67 |
| Total start time applications | 2 | five | 357 | 185 | 164 | 0.68 |
| Report Formation "Account card" | 6 | four | 99 | 94 | five | 0.84 |
| SALT formation | four | four | 224 | 190 | 31 | 0.95 |
| SALT formation in a row | five | four | 732 | 559 | 158 | 0.88 |
| Carrying out the sale of goods and services | one | four | 387 | 353 | 34 | 0.67 |
The APDEX technique allows us to interpret the obtained numerical values of the coefficient in terms of qualitative estimates. For this, the APDEX Scale is provided, which contains the following ranges of values:
- From 0.00 to 0.50 - Unacceptable
- From 0.50 to 0.70 - unsatisfactory
- From 0.70 to 0.85 - satisfactory
- From 0.85 to 0.94 - good
- From 0.94 to 1.00 - excellent
Interpreting the values, we get the following table:
| Operation | Apdex |
| Carrying out the sale of goods and services | unsatisfactory |
| Total application launch time | unsatisfactory |
| Formation of the report "card account" | satisfactorily |
| Formation of light | fine |
| Formation of the account OV | OK |
| Carrying out the sale of goods and services | unsatisfactory |
Implementation. Practice
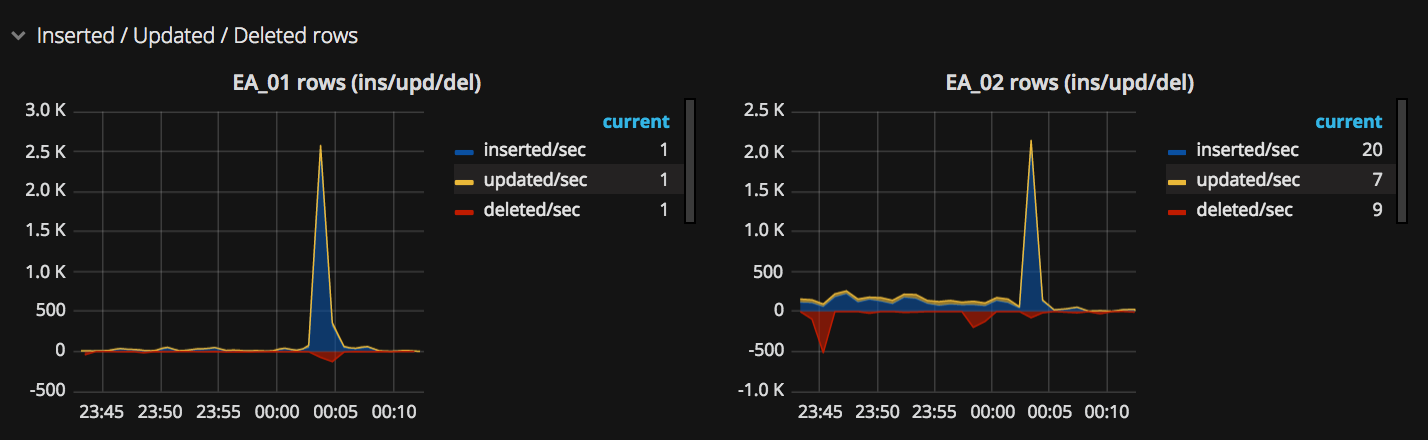
To monitor the performance and availability of services, we use Zabbix and the Grafana add-on. For all our services, including 1C Fresh, the following indicators are monitored: CPU load on each server, amount of free RAM, queue depth of the disk subsystem (load by disk I / O operations), amount of free disk space, number of INSERT operations, UPDATE , DELETE per second on the database server.
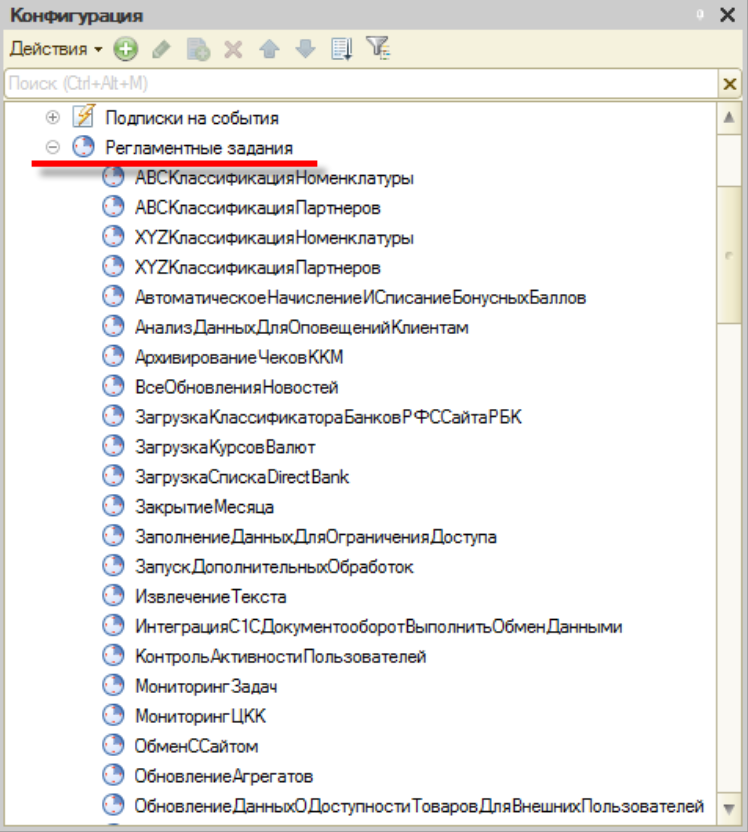
To track Apdex scores, we didn’t come up with anything new and added a score display in Zabbix. In order for Zabbix to receive data on the execution time of operations from 1c, they must first be unloaded somewhere. To do this, we use the PostgreSQL intermediate database. You can upload data from 1C to the database in several ways. We implemented this mechanism through routine tasks.
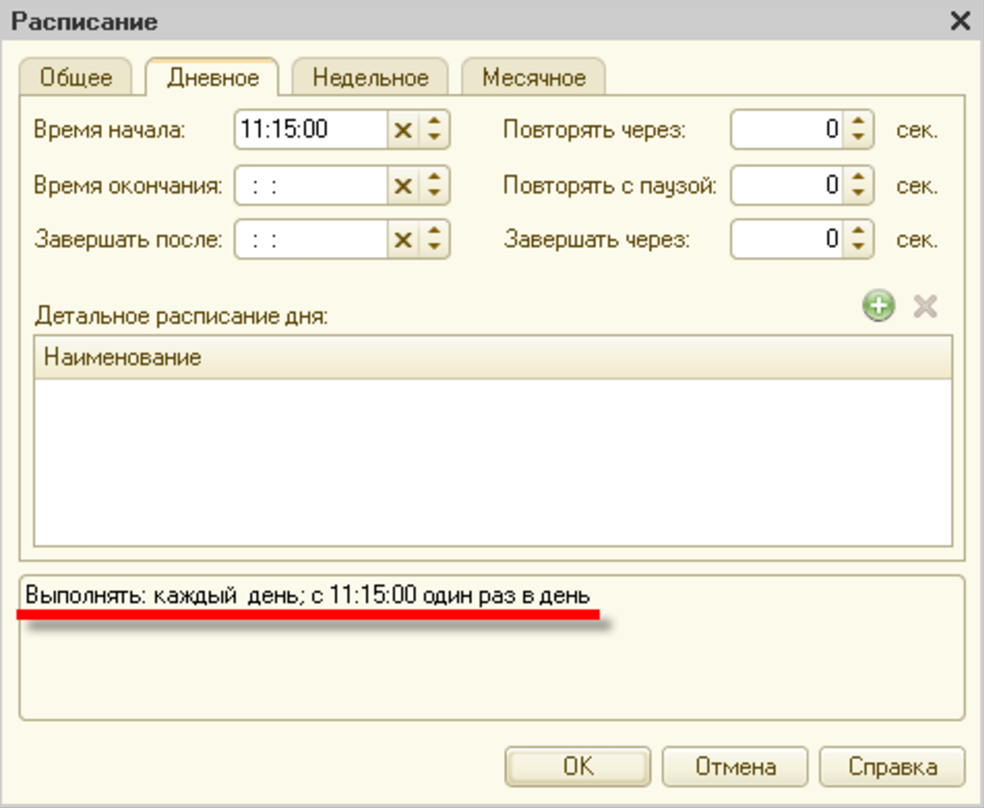
Each scheduled task can be run on schedule:
In the process of starting, a scheduled task generates a background task, which performs the actual processing. The routine task can be executed on behalf of the specified user and has the ability to restart (for example, in the event of an unexpected shutdown).
For unloading, we will use the following register values:
1. Name of the database of the applied configuration. Since 1C Fresh technology assumes the use of a large number of databases and application solutions, we need to distinguish measurements for each of them.
2. The name of the operation.
3. Start time
4. The time of the operation
5. The data area in which the operation was performed
6. The user who performed the operation
The background task is a procedure:
() = () - 1800 - 18000; = "server"; = "apdex"; = "username"; = "pswd"; = "perfomance"; = (); = (, "Ref="); = (, + 4); = (, """", ""); = (, ";", ""); = ; . = " | . , | . , | . , | . | | . | | . >= &"; ..("", ); = .().(); (.()); = "Driver={PostgreSQL Unicode}; |data source=PostgreSQL35W; |Server=" + + "; |Port=5433; |Database=" + + "; |Uid="++"; |Pwd="++"; |STMT=utf8"; = COM("ADODB.Connection"); .Provider = "MSDASQL.1"; .ConnectionString = ; .Open(); .() = COM("ADODB.RecordSet"); = COM("ADODB.Command"); .ActiveConnection = ; = .; = .; = (1,1,1,0,0,0) + (/1000); = (., ",", "."); = ((,.,"")," ",""); = .; = (,";",.); = (,1); = (,2); .CommandText = "Insert into " + + " (basename,operation,startdate,operationtime,username, name) values ("+"'" + + "','" + + "','" + + "','" + + "','" + + "','" + + "'"+")"; = .Execute(); ; .Close(); By unloading data from 1C in this way, we will now have no difficulty in processing this in Zabbix. Using the example of the “Total application launch time” operation in IB ea_01, we will form an sql query to the database:
select ( ( ( select count(*) as cnt from perfomance where operation=' ' and basename = 'ea_01' and startdate > (NOW() - INTERVAL 2 hour ) and operationtime < 3 ) + ( select count(*) as cnt from perfomance where operation=' ' and basename = 'ea_01' and startdate >= (NOW() - INTERVAL 2 hour ) and operationtime > 3 and operationtime < 4*3)/2)::real / Nullif ( ( select count(*) from perfomance where operation=' ' and basename = 'ea_01' and startdate >= (NOW() - INTERVAL 2 hour ) ),0)::real) In the first step, we will create a configuration file for the agent, which will be executed on the database server where the measurement data is stored.
UserParameter=apdex.operation.openapp[*],psql -U postgres -p 5433 -d apdex -t -c "select (((select count(*) as cnt from perfomance where operation='$3' and basename = '$1' and startdate > (NOW() - INTERVAL '$2 hour' ) and operationtime < $4) + (select count(*) as cnt from perfomance where operation='$3' and basename = '$1' and startdate >= (NOW() - INTERVAL '$2 hour' ) and operationtime > $4 and operationtime < 4*$4)/2)::real / nullif((select count(*) from perfomance where operation='$3' and basename = '$1' and startdate >= (NOW() - INTERVAL '$2 hour' )),0)::real) Using parameters will give us the opportunity to use this configuration file for various information databases and measured operations.
In the second step, we will create a template in Zabbix, where we will describe the macros we need:
Then we bind this template to the required network node and redefine the individual parameters for macros.
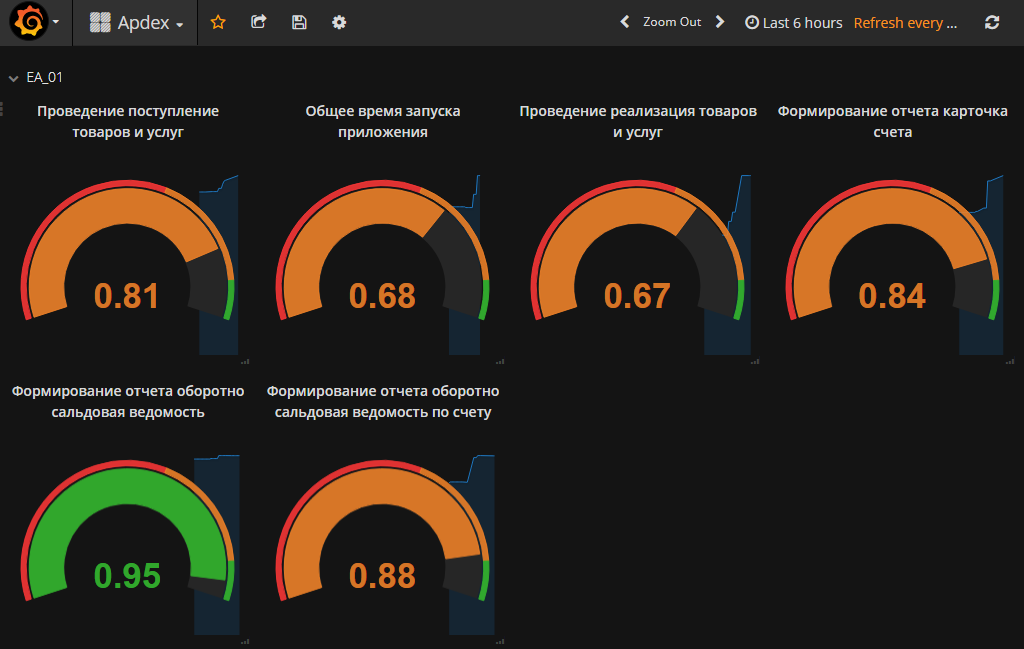
Repeating these steps for each measured parameter, we will receive continuous performance monitoring using the APDEX technique.
Now, almost in real time, we can see Apdex rating on our 1cFresh databases. But we went further.
Adjust response to performance drop
In addition to automatic monitoring of indicators, we also set up an automatic response to a drop in performance on any parameter. Zabbix provides a lot of room for the implementation of various reactions through scripting tools.
We will respond to a drop in performance by including the 1C: Enterprise technology journal.
The script is quite simple:
The performance of the operation drops → a trigger triggers a drop → an action is triggered, which edits the technology log settings file.
After analyzing the problem, or restoring performance, the reverse actions are carried out.
Performance goes to a normal level → a trigger is triggered → the technical log settings block is deleted.
Create a trigger in which we write the trigger conditions. In our case, the Apdex score falls below 0.6.
Then create an action to trigger the trigger.
In this action we set the command
Based on the collected TJ, it is possible to analyze what caused the performance drop, what were the errors, what the user was doing at the moment, which user, etc. Comparing the data of TJ and monitoring Zabbix, you can draw conclusions and develop plans for troubleshooting, optimizing hardware, optimizing user experience.
Thanks to monitoring and performance evaluation, we were able to reach the 99% availability rate of our 1C Fresh installation. Our Apdex scores have not yet reached 1.0, but we are already working on it :)
Source: https://habr.com/ru/post/339394/
All Articles